
Happy birthday Terrill 🥳
15.12.2025 19:35 — 👍 1 🔁 0 💬 0 📌 0Happy birthday Terrill 🥳
15.12.2025 19:35 — 👍 1 🔁 0 💬 0 📌 0
ICE DETAINED MARILYN. Fuck these people. www.seattletimes.com/seattle-news...
27.11.2025 16:35 — 👍 6776 🔁 3155 💬 229 📌 465Awful.
25.11.2025 22:50 — 👍 1 🔁 0 💬 0 📌 0
This image shows gauges with the Nov 22 - Dec 5, 2025 Forecast scores for Canada, the provinces, & territories. From left to right: Canada: HIGH - 9.4 Alberta: SEVERE - 15.1 British Columbia: HIGH - 7.2 Manitoba: VERY HIGH - 13.9 New Brunswick: VERY HIGH - 14.0 Newfoundland & Labrador: HIGH - 7.9 North: VERY HIGH - 11.1 Nova Scotia: VERY HIGH - 14.3 Ontario: HIGH - 8.2 Prince Edward Island: HIGH - 8.8 Quebec: HIGH - 8.7 Saskatchewan: VERY HIGH - 14.5 A text box reads: "The COVID Forecast is calculated from 3 equally weighted categories: 1) Current infections and spread; 2) Healthcare system impact; 3) Mortality. Within each category there is one sub-category for trends over the most recent week (Trends) and one sub-category for current parameter values relative to a specified baseline (Current values). Trends and current values are weighted equally when determining the final score for a category. All Forecast input data and sources are available here (https://datastudio.google.com/embed/u/0/reporting/42b886cf-d661-488e-b7d8-5c5836b55ab6/page/p_2yqs028mwc). Past Forecast scores are available in the table below. Forecast scores are grouped into 4 ranges: MODERATE (1 to <5, white), HIGH (6 to <10, yellow), VERY HIGH (10 to <15, orange), SEVERE (>15 red)."
Canadian COVID Forecast: Nov 22 - Dec 5, 2025
SEVERE: AB
VERY HIGH: MB, NB, North, NS, SK
HIGH: CAN, BC, NL, ON, PEI, QC
MODERATE: none
About 1 in 161 people in Canada are CURRENTLY infected.
Hasselback!
24.11.2025 17:04 — 👍 0 🔁 0 💬 0 📌 0
#Bill60 will likely be passed this week, and it will grow homelessness across Ontario — something our food banks, shelters, and municipalities do not have the resources to address.
When you wonder why encampments are growing in your community, remember Bill 60.
My remarks today at the OLA:

With the recent spike in residential school denialism, I'm happy to share this important conversation with Phyllis Webstad and Willie Sellars, "Truth Before Reconciliation: Addressing Residential School Denialism": www.youtube.com/watch?v=RorH...
17.11.2025 19:17 — 👍 12 🔁 6 💬 0 📌 0I'm planning to see Blue Moon this weekend ... Have you seen it?
14.11.2025 06:48 — 👍 0 🔁 0 💬 0 📌 0
This image shows gauges with the Nov 8 - Nov 21, 2025 Forecast scores for Canada, the provinces, & territories. From left to right: Canada: VERY HIGH - 10.1 Alberta: SEVERE - 16.2 British Columbia: HIGH - 8.4 Manitoba: VERY HIGH - 11.9 New Brunswick: VERY HIGH - 14.5 Newfoundland & Labrador: VERY HIGH - 10.1 North: VERY HIGH - 11.5 Nova Scotia: VERY HIGH - 12.7 Ontario: HIGH - 9.2 Prince Edward Island: HIGH - 7.7 Quebec: VERY HIGH - 10.1 Saskatchewan: VERY HIGH - 13.1 A text box reads: "The COVID Forecast is calculated from 3 equally weighted categories: 1) Current infections and spread; 2) Healthcare system impact; 3) Mortality. Within each category there is one sub-category for trends over the most recent week (Trends) and one sub-category for current parameter values relative to a specified baseline (Current values). Trends and current values are weighted equally when determining the final score for a category. All Forecast input data and sources are available here (https://datastudio.google.com/embed/u/0/reporting/42b886cf-d661-488e-b7d8-5c5836b55ab6/page/p_2yqs028mwc). Past Forecast scores are available in the table below. Forecast scores are grouped into 4 ranges: MODERATE (1 to <5, white), HIGH (6 to <10, yellow), VERY HIGH (10 to <15, orange), SEVERE (>15 red)."
Canadian COVID Forecast: Nov 8 - Nov 21, 2025
SEVERE: AB
VERY HIGH: CAN, MB, NB, NL, North, NS, QC, SK
HIGH: BC, ON, PEI
MODERATE: none
About 1 in 118 people in Canada are CURRENTLY infected.
I'm so sorry to hear this
03.11.2025 20:10 — 👍 3 🔁 0 💬 0 📌 0
I will never not take acetaminophen 💅🏽 globalnews.ca/news/500400/...
31.10.2025 19:03 — 👍 0 🔁 0 💬 0 📌 0K now do Stellan
30.10.2025 18:04 — 👍 1 🔁 0 💬 1 📌 0Which one?
27.10.2025 01:51 — 👍 1 🔁 0 💬 1 📌 0
This image shows gauges with the Oct 11 - Oct 24, 2025 Forecast scores for Canada, the provinces, & territories. From left to right: Canada: HIGH - 8.9 Alberta: HIGH - 7.0 British Columbia: HIGH - 8.4 Manitoba: VERY HIGH - 14.9 New Brunswick: VERY HIGH - 11.3 Newfoundland & Labrador: SEVERE - 17.0 North: VERY HIGH - 12.3 Nova Scotia: SEVERE - 16.3 Ontario: HIGH - 7.5 Prince Edward Island: VERY HIGH - 11.8 Quebec: HIGH - 10.0 Saskatchewan: SEVERE - 17.0 A text box reads: "The COVID Forecast is calculated from 3 equally weighted categories: 1) Current infections and spread; 2) Healthcare system impact; 3) Mortality. Within each category there is one sub-category for trends over the most recent week (Trends) and one sub-category for current parameter values relative to a specified baseline (Current values). Trends and current values are weighted equally when determining the final score for a category. All Forecast input data and sources are available here (https://datastudio.google.com/embed/u/0/reporting/42b886cf-d661-488e-b7d8-5c5836b55ab6/page/p_2yqs028mwc). Past Forecast scores are available in the table below. Forecast scores are grouped into 4 ranges: MODERATE (1 to <5, white), HIGH (6 to <10, yellow), VERY HIGH (10 to <15, orange), SEVERE (>15 red)."
Canadian COVID Forecast: Oct 11 - Oct 24, 2025
SEVERE: NL, NS, SK
VERY HIGH: MB, NB, North, PEI
HIGH: CAN, AB, BC, ON, QC
MODERATE: none
About 1 in 95 people in Canada are CURRENTLY infected.

My video story on Lindsay Shepherd losing her job over her post complaining about having to view orange shirts or flags. #truthandreconciliation #bcpoli
02.10.2025 19:23 — 👍 29 🔁 10 💬 2 📌 4As if lol ♈
14.10.2025 00:44 — 👍 1 🔁 0 💬 0 📌 0
#birdbot
08.10.2025 23:00 — 👍 46 🔁 7 💬 0 📌 0
This image shows gauges with the Sep 27 - Oct 10, 2025 Forecast scores for Canada, the provinces, & territories. From left to right: Canada: HIGH - 7.5 Alberta: HIGH - 6 British Columbia: HIGH - 5.8 Manitoba: VERY HIGH - 12.1 New Brunswick: HIGH - 6.3 Newfoundland & Labrador: VERY HIGH - 10.2 North: HIGH - 9.2 Nova Scotia: VERY HIGH - 11.6 Ontario: HIGH - 6.3 Prince Edward Island: HIGH - 7 Quebec: HIGH - 9.6 Saskatchewan: VERY HIGH - 12.4 A text box reads: "The COVID Forecast is calculated from 3 equally weighted categories: 1) Current infections and spread; 2) Healthcare system impact; 3) Mortality. Within each category, there is one sub-category for trends over the most recent week (Trends) and one sub-category for current parameter values relative to a specified baseline (Current values). Trends and current values are weighted equally when determining the final score for a category. All Forecast input data and sources are available here (https://datastudio.google.com/embed/u/0/reporting/42b886cf-d661-488e-b7d8-5c5836b55ab6/page/p_2yqs028mwc). Past Forecast scores are available in the table below. Forecast scores are grouped into 4 ranges: MODERATE (1 to <5, white), HIGH (6 to <10, yellow), VERY HIGH (10 to <15, orange), SEVERE (>15 red)."
Canadian COVID Forecast: Sep 27 - Oct 10, 2025
SEVERE: none
VERY HIGH: MB, NL, NS, SK
HIGH: CAN, AB, BC, NB, North, ON, PEI, QC,
MODERATE: none
About 1 in 60 people in Canada are CURRENTLY infected.

This image describes the Canadian COVID Forecast for the fourteen-day period between September 13-26, 2025, which is produced by COVID-19 Resources Canada. Canada’s COVID Forecast outlook is VERY HIGH (no change) with a COVID INDEX SCORE of 13.4 About 1 of every 81 people is infected. Estimated infections this week: 537,000-948,750 What these numbers mean: MODERATE 1-5, HIGH 5-10, VERY HIGH 10-15, SEVERE >15 COMPARED TO THE LOWEST POINT IN THE COVID PANDEMIC IN CANADA How much higher are key indicators compared to the lowest point in the COVID pandemic in Canada? Waste water, infections: VERY HIGH; 11.5X higher Long COVID estimate: HIGH; 8.6X higher Hospitalizations, ICU: VERY HIGH; 14.6X higher Deaths: VERY HIGH: 14.2X higher HOW TO HELP: EVERYONE: UPDATE vaccines every 6 months WEAR N95-type masks AVOID indoor social gatherings AVOID crowded non-essential places Who is HIGH RISK? People 60 and older, babies < 1 year, pregnant ALL AGES: immunocompromised OR medically at-risk OR no vaccine or infection in the last 6 months Recommendations are based on the COVID-19 Risk Index from the Peterborough ON Public Health Unit COVID-19 Resources Canada is a grassroots organization of volunteer scientists supporting Canadian COVID responses. Sources, data and methods for the COVID Index are available at www.Covid19Resources.ca
Canadian COVID Forecast Sep 13-26, 2025
CANADA
VERY HIGH (no change)
About 1 in every 81 people infected
Compared to lowest point of pandemic in Canada:
-Infections ~12X higher
-Long COVID ~8X higher
-Hospitalizations ~15X higher
-Deaths ~14X higher
Canadian COVID Forecast Aug 30 - Sep 12 2025
CANADA
High [No change]
About 1 in 65 people in Canada are CURRENTLY infected.
Compared to lowest point of pandemic in Canada:
-Infections ~7.2 higher
-Long COVID ~7.7 higher
-Hospitalizations ~10.7 higher
-Deaths ~10.9 higher

#birdbot
05.09.2025 06:00 — 👍 32 🔁 5 💬 0 📌 0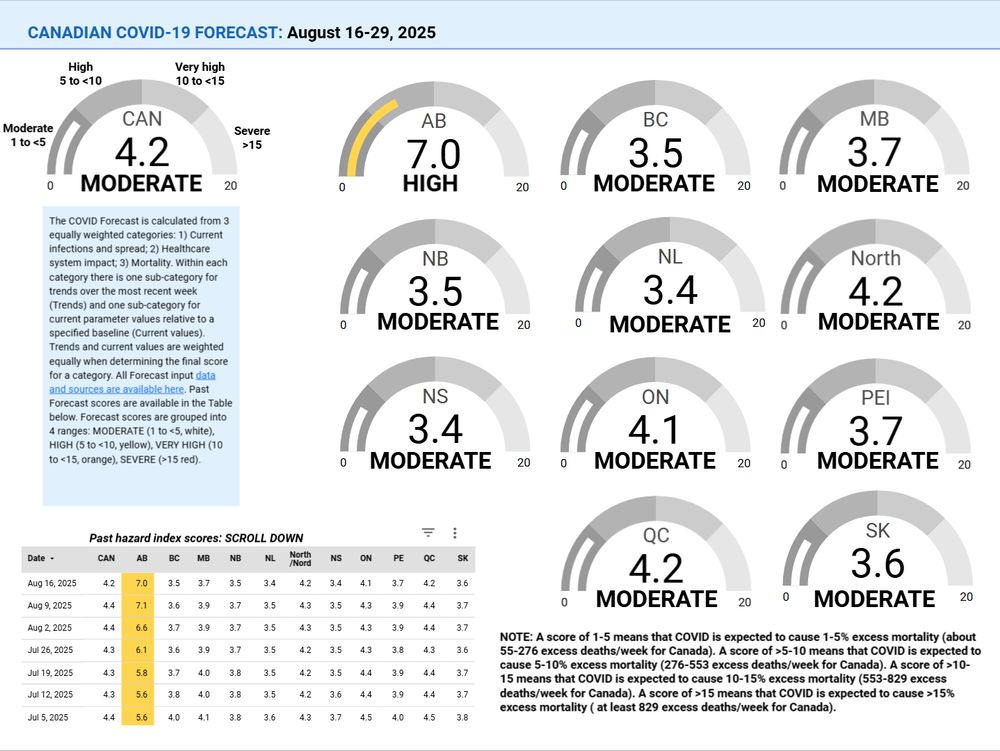
This image shows gauges with the Aug 16-Aug 29, 2025 COVID Forecast scores for Canada, the provinces, & territories. From left to right: Canada: 4.2 - MODERATE Alberta: 7.0 - HIGH British Columbia: 3.5 - MODERATE Manitoba: 3.7 - MODERATE New Brunswick: 3.5 - MODERATE Newfoundland and Labrador: 3.4 - MODERATE North: 4.2 - MODERATE Nova Scotia: 3.4 - MODERATE Ontario: 4.1 - MODERATE Prince Edward Island: 3.7 - MODERATE Quebec: 4.2 - MODERATE Saskatchewan: 3.6 - MODERATE A text box reads: "The COVID Forecast is calculated from 3 equally weighted categories: 1) Current infections and spread; 2) Healthcare system impact; 3) Mortality. Within each category there is one sub-category for trends over the most recent week (Trends) and one sub-category for current parameter values relative to a specified baseline (Current values). Trends and current values are weighted equally when determining the final score for a category. All Forecast input data and sources are available here (https://datastudio.google.com/embed/u/0/reporting/42b886cf-d661-488e-b7d8-5c5836b55ab6/page/p_2yqs028mwc). Past Forecast scores are available in the table below. Forecast scores are grouped into 4 ranges: MODERATE (1 to <5, white), HIGH (6 to <10, yellow), VERY HIGH (10 to <15, orange), SEVERE (>15 red).
Canadian COVID Forecast: Aug 16-Aug 29, 2025
SEVERE: none
VERY HIGH: none
HIGH: AB
MODERATE: CAN, BC, MB, NB, NL, North, NS, ON, PEI, QC, SK
About 1 in 121 people in Canada are CURRENTLY infected.

Handwritten text on a notecard: My husbands ashes; I made me feel alone scared, empty, now I wonder where he is and if he's all still in his urn and if hes ok and I hope he's not in the dump
We asked people who experienced "sweeps" of homeless encampments to write about it in their own words.
In Portland, Teresa Stratton told us about how her husband’s ashes were taken in a removal:
It's a death cult, yearning for an apocalypse.
16.08.2025 11:26 — 👍 7 🔁 0 💬 0 📌 0
For years, residential school denialists have demanded "proof," despite church and state records already confirming 4000+ residential school deaths. Disrespectfully, they say: "show me the bodies!" Well, Deninu Kųę́ First Nation have now exhumed remains: www.cbc.ca/news/canada/...
11.08.2025 16:14 — 👍 107 🔁 64 💬 4 📌 4


This past week, 4 research school research teams have shared evidence - from historical documents to exhumation - confirming additional deaths of children at residential schools across the country. IRS denialists will no doubt downplay results, but they are truly heartbreaking.
15.08.2025 20:13 — 👍 23 🔁 13 💬 0 📌 0
Because of this: mondoweiss.net/2025/08/how-...
11.08.2025 16:03 — 👍 17 🔁 3 💬 1 📌 0
Anas Jamal Al-Sharif left these words for if he was martyred. I read them shared on Al Jazeera.
www.aljazeera.com/news/liveblo...
