
Celebrate the positive when it comes along:
Two charismatic marsupial species that had been thought extinct for 6,000 years are alive in rainforest in remote West Papu
www.theguardian.com/environment/... 🧪

@patmnorman.bsky.social
Researcher studying remote sensing and forests for the Climate Action Beacon, Griffith University, Australia. Huge fan of everything nature and technology. All views and opinions are my own.
Celebrate the positive when it comes along:
Two charismatic marsupial species that had been thought extinct for 6,000 years are alive in rainforest in remote West Papu
www.theguardian.com/environment/... 🧪

Over 46 million ha burnt across the Tropical Savannas in 2025. Naturally fire-prone, these landscapes need fire, still this was a big year! The biggest fire season since 2012! The early dry and late dry seasons indicate a shift from fires that are more likely to be of low intensity to severe events.
14.02.2026 00:09 — 👍 3 🔁 1 💬 0 📌 0
2026-02-04 Happy Birthday OSGeo! Celebrating 20 years of Free and Open Source Software for Geospatial
Happy Birthday OSGeo! Celebrating 20 years of Free and Open Source Software for Geospatial 2026-02-04
Thank you to everyone who has been part of this endeavour over the last 20 years.
We invite you to celebrate with us, to share memories & to look ahead to […]
[Original post on fosstodon.org]

How to Download and Visualize NASA-ISRO NISAR Data in QGIS | Step-by-Step Tutorial
Learn how to download and visualize NASA-ISRO NISAR SAR satellite data in QGIS without coding! This complete tutorial shows you how to use the NASA Earthdata plugin for QGIS to access powerful SAR data.

As a climate scientist, I know heatwaves in Australia will only get worse. We need to start preparing now | Sarah Perkins-Kirkpatrick
08.01.2026 21:36 — 👍 39 🔁 17 💬 2 📌 3
Composite burn index map for fire perimeters analysed in this study (a); inset map of the fire location (b); classified composite burn severity classes across the study area and severity for large patches are presented in insets (i), (ii) and (iii).

Partial dependence plots of each variable with the respective relative contributions to the model in parentheses. The dashed lines represent the partial dependence values, while the solid line shows a fitted curve with loess smoothing applied. The density distribution of the sampled test data is shown at the bottom of each plot for continuous variables and alongside predicted response for a categorical variable. The red dots represent the predicted response for each vegetation type. CBI: Composite Burn Index.

Bar plot showing the mean forest cover (%) for different forest age classes in Quebec. Analysis is based on forest cover data from four studies ( Hansen et al. 2013; Sexton et al. 2013; Matasci et al. 2018; Feng et al. 2022) and age class data from Maltman et al. (2023). The error bars represent the standard deviation (s.d.) of the mean cover for each age class.
🔥New in IJWF:
Mackey et al.
The 2023 Québec fires burned 4.5 M ha of boreal forest. Using Sentinel-2 CBI mapping the authors show burn severity peaks on dry topographic positions, under extreme fire weather, and in 20–40-year forests.
🔗 doi.org/10.1071/WF24175
#IJWildlandFire

A screenshot of an ABC News article titled 'Hoop pine may set record as Australia's tallest rainforest tree'. The header image is a photo of massive hoop pines, taken from the ground looking directly up the trunks to their canopies.
A towering discovery: a 77-metre hoop pine may be Australia’s tallest rainforest tree! 🌲
In a study in #AusJBotany, researchers using Airborne Laser Scanning data to model the canopies of millions of trees identified some that stood head and shoulders above the rest.
www.abc.net.au/news/2025-10...
🚀 SamGeo v0.14.0 is here!
This release brings interactive segmentation for remote sensing imagery powered by Meta’s SAM3.
🟦 Draw a bounding box to automatically detect all similar objects across the image.
📝 Or just type a text prompt to segment objects instantly.

Quick explainer on some of the main features of the new nature laws, noting some details remain to be seen
27.11.2025 05:35 — 👍 52 🔁 27 💬 0 📌 1
This paper is now in press at Oikos, and I can submit an image for the journal cover. I have various crappy photos of mistletoe munching tyrannoids; if you have a great shot you can donate to the cause, I’ll shout you a quality beverage at the very next opportunity
www.authorea.com/doi/full/10....

A pheasant coucal is a mass of contradictions: a bewildered bravo rolling through my house like a feathered wrecking ball | Bronwen Scott
02.10.2025 15:02 — 👍 10 🔁 4 💬 0 📌 1
🚀 Exciting update! The GeoAI Python package is getting even smarter — soon it will support AI agents.
That means you’ll be able to use natural language to effortlessly download, analyze, and visualize geospatial data 🌍🤖
Stay tuned for the upcoming release!
🔗 GitHub: github.com/opengeos/geoai

A Maxar satellite image of Mt Fuji. The satellite was only 3 degrees above the horizon at the time, so the capture angle is almost directly side on instead of top down.
Just spent some time digging through old Maxar/DigitalGlobe blogs to find a reference image and found this incredible capture of Mt Fuji. Incredible.
The satellite was only three degrees above the horizon when it captured this image.
blog.maxar.com/earth-intell...
As the giant #Antarctic iceberg #A23a is currently breaking apart, we created a video about its dance in the water in the last year, including spinning in a Taylor column! Even though A23a is not sea ice, the microwave signature is similar and it shows up in our data! Can you spot it in the video?
08.09.2025 09:15 — 👍 5 🔁 2 💬 0 📌 0


#USGS #CorridorMappingTeam - #Ungulate #Migrations of #West
-
tinyurl.com/2tt37swu
-
doi.org/10.3133/sir2...
-
#GIS #spatial #mapping #USWest #route #ecosystems #wildlife #publicland #privateland #opendata #fedopendata #fedscience #tracking #GPS #seasonal #habitat #protection #management #USFWS

Flower of Eupomatia bennettii
Nice to wake up to some weird magnoliid action this morning. Here is a flowering Eupomatia bennettii (small bolwarra) in our dry rainforest garden.
30.08.2025 22:18 — 👍 9 🔁 1 💬 0 📌 0
Good on the NSW EPA! “The alleged offences include failing to properly search for and identify glider den trees before logging, failing to replace hollow-bearing … trees that were damaged or felled, and damaging the habitat of a threatened species.”
🧪
www.abc.net.au/news/2025-08...

Chlorophyll concentrations in South Australian coastal waters on 13 August 2025. Note the broad spread of light blue areas, and the noticeable yellow zones along the coast, with highest concentrations close to the shores, around Adelaide and Kangaroo island.
Parts of South Australia, especially around Adelaide - home to the Australian Space Agency - continue to be affected by an ongoing microalgae bloom. Algal blooms are a natural phenomena, but this one has lingered for months.
(Pic: chlorophyll concentration from #Copernicus Sentinel-3 on 13 August)

🤔
We’re collecting cool datasets to show on OpenDroneMap.org, but it also might be useful to have a sentence from you on how you use OpenDroneMap and how it has effected you in your industry.
How has OpenDroneMap changed / improved / supported what you do in your sector?
🤔

Snow covered street curving away from the camera. Everything is white.
Biggest snow fall in decades here in Armidale NSW. We usually get an occasional flurry that doesn't settle. Heavy snow fell all day, around 40cm+ in drifts around our yard. Lots of fun, but also lots of trees cracking and falling, not used to the weight. Some birds struggling to fly!
02.08.2025 10:32 — 👍 77 🔁 16 💬 6 📌 2
We would like to thank Professor Michael Calver as he steps down as the #PacificConsBio Editor-in-Chief after 15 years of service!
From cover to cover, your work has left a lasting impression, thank you for your unbinding commitment!
You’ve always had the write stuff!
@CSIROpublishing.bsky.social

1/ Working with big data in R?
Your wrangling just got a massive upgrade.
duckplyr is now in the tidyverse—and it’s fast. Really fast. 🧵
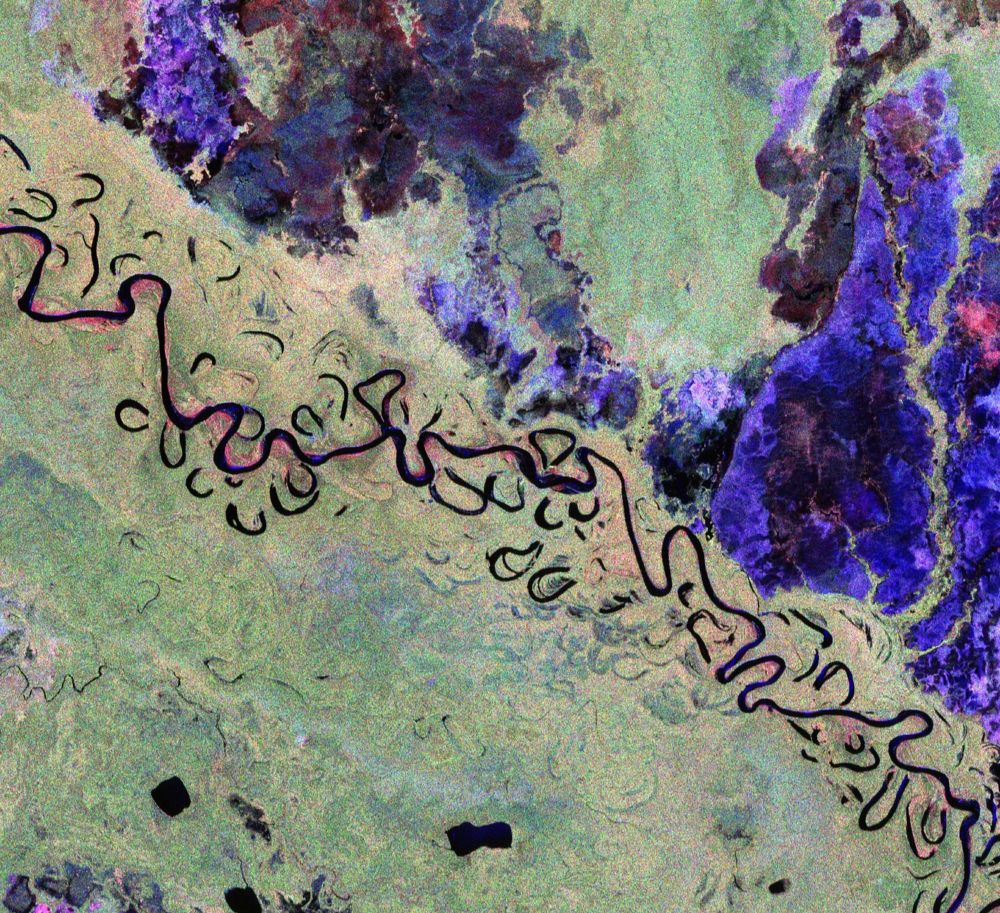
This image features part of Bolivia. This vibrant image was created using the radar instrument’s different polarisation channels, with each colour revealing distinct characteristics of the landscape. For instance, green hues mainly represent rainforest, red hues forested floodplains and wetlands, and blue–purple is indicative of grasslands, while black areas are rivers and lakes. The image spans approximately 90 km along the Biomass satellite's flight path (length) and 60 km across in width, with north oriented to the right.
🆕 The first stunning images from our groundbreaking #Biomass satellite mission have been released – they mark a major leap forward in our ability to understand how Earth’s forests are changing and exactly how they contribute to the global carbon cycle 🌳🌍
www.esa.int/Applications...
🚀 Exciting news! The #GeoAI Python package now lets you train land cover classification models with just one line of code.
Leverage any PyTorch segmentation model from smp.readthedocs.io — with hundreds of image encoders & pretrained weights available.

I am pleased to announce the release of PDAL 2.9.0
github.com/PDAL/PDAL/re...
Goodies include GDAL VSI support by Norman Barker, FileSpec support by Thomas Swamy, filters.supervoxel by Bram Ton, SPZ read/write, `ogr` option for filtering, and greatly enhanced readers.tindex support by Isaac Bell.


Great Poster session!
It was great discussions biodiversity conservation in African rainforest with all of you. And I look forward to developping the ideas we shared #ICCB2025
#Brisbane #Australia
Thank you to all those who stopp🙏🙏🙏

Thanks to everyone who shared #rstats hex stickers so far at #ICCB2025! Some very cool projects represented here…
17.06.2025 05:27 — 👍 14 🔁 2 💬 1 📌 0
Great talk by @drdave.bsky.social at #ICCB2025 Exploring connectivity, patch size and how technology can help in our monitoring.
17.06.2025 06:05 — 👍 5 🔁 1 💬 1 📌 1
galah hex logo. An illustration of a galah (an australian species of cockatoo) with pink feathers on its head and chest and grey feathers on its wings. The galah is inside a hexagon with aqua green, sunburst background. Outside of the hexagon is a pattern of pink dots exploding outwards from behind the hexagon in all directions
🚨galah 2.1.2 is on CRAN! 📦
This version fixes a major bug that prevented queries with more complex filters from returning the correct result. It also adds a way to get species conservation status from authoritative lists
🔗 Details: galah.ala.org.au/news/index.h...
#rstats @rowdynerd.bsky.social 🌏

🚀 Excited to share the draft Table of Contents for my upcoming book, "Introduction to GIS Programming: A Practical #Python Guide to Open Source Geospatial Tools." 📚
github.com/giswqs/intro...
📅 Aiming for a July 2025 release! Stay tuned!


