Right now, the jet stream is bulging far north over the western U.S. while plunging deep south over the east, allowing Arctic air to spill unusually far south. The pattern is becoming more common as the Arctic warms faster than the rest of the planet.
31.01.2026 14:03 —
👍 234
🔁 113
💬 5
📌 8

What Trump Leaving U.N. Environment Groups Means for the Climate
Trump is pulling the U.S. out of 66 international organizations. Experts weigh in on the climate impacts.
Our President and CEO R. Max Holmes spoke to TIME about the U.S. withdrawing from the UNFCCC.
“The federal government, over the last 11 plus months, has already done everything they can to put the brakes on energy transition and climate action.”
Read more at time.com/7344810/trum...
08.01.2026 23:09 —
👍 4
🔁 2
💬 0
📌 0

8️⃣ General Circulation Models, or GCMs, help us understand our changing climate. This map visualizes temp change as a substitute for true elevation in a 3d map, illustrating the disproportionate effect of climate change on the Arctic.
Data Source: KNMI Climate Explorer
🗺️: by @gfiske.bsky.social
15.10.2025 15:49 —
👍 4
🔁 1
💬 0
📌 0

Like to vote for your favorite ⬇️
7️⃣ This data visualization of hurricane Beryl uses federal data to put the story of climate change on the map. Higher global temperatures will cause hurricanes to survive longer over land before dissipating.
Data Source: GOES dataset
🗺️: by @gfiske.bsky.social
15.10.2025 15:49 —
👍 5
🔁 2
💬 2
📌 0

6️⃣ An artistic rendition of the Lena River Delta in Russia that represents the realities of our changing Arctic. Since 2003, Woodwell Climate’s ArcticGRO has provided essential data about the biogeochemistry and discharge of the largest Arctic rivers.
Data Source: ArcticDEM
🗺️: by @gfiske.bsky.social
15.10.2025 15:42 —
👍 3
🔁 0
💬 1
📌 0

Like to vote for your favorite⬇️
5️⃣ To understand the impacts of abrupt thaw, @permafrostpathways.bsky.social is using the features in this map to train a model to identify changes in the Arctic. This is a tributary of the Taz River in Siberia, Russia.
Data Source: ArcticDEM
🗺️: @gfiske.bsky.social
15.10.2025 15:42 —
👍 4
🔁 1
💬 2
📌 0

4️⃣This shows the presence of ship activity in the Arctic Ocean from 2009-2018. Patterns of blue (low ship numbers) to white (high ship numbers) reflect the human presence in this new, largely becoming ice-free, part of the world.
Data Source: Berkman et al 2020, Esri.
Map by @gfiske.bsky.social
14.10.2025 19:05 —
👍 7
🔁 2
💬 0
📌 0

Like to vote for your favorite ⬇️
3️⃣This art shows elevation data from the ArcticDEM project (NGA-NSF) for the Taz River in north-central Siberia. The topographic elevation was colored with earth tones to vary from low (very dark) to high (light).
Data source: ArcticDEM
Map by @gfiske.bsky.social
14.10.2025 19:05 —
👍 5
🔁 0
💬 1
📌 0

2️⃣ Forests hold mountains of carbon. The Amazon Rainforest is one of the world’s most carbon-rich forests and tropical forests are one of the only large-scale tools available to combat global warming.
Data source: thecarbonsource.org
Map by @gfiske.bsky.social
14.10.2025 19:01 —
👍 8
🔁 3
💬 0
📌 0

Like to vote for your favorite ⬇️
1️⃣ This map demonstrates the power and quality of the ArcticDEM dataset. We use this high resolution elevation data in our mapping of Arctic abrupt thaw features.
Data Source: ArcticDEM
🗺️: @gfiske.bsky.social
14.10.2025 19:01 —
👍 6
🔁 1
💬 1
📌 0
Science for the world. And for you. - Woodwell Climate
Remember, subscribe to our email newsletter before then to enter into our raffle, and you may go home with the winning map! www.woodwellclimate.org/email-signup/
14.10.2025 14:59 —
👍 0
🔁 0
💬 0
📌 0

We are kicking off the mappiest week of the year - our first Map Bracket Showdown! Starting today, we’ll post head to head competitions of some of @gfiske.bsky.social gorgeous storytelling, and innovative data visualizations.
Vote for your favorites and learn about the science behind the art.
14.10.2025 14:59 —
👍 7
🔁 3
💬 2
📌 0

Day 1️⃣ of Climate Week
Stay tuned for updates from our panel discussions and partner collaborations.
Map by @gfiske.bsky.social
@permafrostpathways.bsky.social
22.09.2025 16:06 —
👍 5
🔁 3
💬 0
📌 0

Woodwell Climate is proud to announce the appointment of three endowed chairs, an exciting milestone in our 40-year history that will sustain groundbreaking climate research for generations to come.
www.woodwellclimate.org/endowed-chai...
15.09.2025 17:16 —
👍 8
🔁 1
💬 0
📌 0
Science for the world. And for you. - Woodwell Climate
But here’s the twist — you help choose the prize! Starting October 13, we’ll host a map bracket showdown on social media. Vote for your favorites, and the winning map will be the one we print and send to our lucky winner.
For more information, go to www.woodwellclimate.org/email-signup/
08.09.2025 18:32 —
👍 2
🔁 1
💬 0
📌 0

Join our list between September 8 and October 17, and you’ll be entered into our email raffle for a chance to win a beautiful printed map by Woodwell Climate’s own @gfiske.bsky.social
08.09.2025 18:32 —
👍 3
🔁 3
💬 1
📌 0
Science for the world. And for you. - Woodwell Climate
From Climate Week NYC to COP30 in Belém, we are resolute in our pursuit of a better climate future. Subscribe to our email updates to stay connected with our ambitious solutions and critical progress. www.woodwellclimate.org/email-signup/
08.09.2025 18:32 —
👍 0
🔁 0
💬 1
📌 0
Bluesky
This month, @gfiske.bsky.social e.bsky.social traveled to the region with Marina Tonkopeeva of the International Center for Reindeer Husbandry to work on co-produced maps between Indigenous Dukha herders, ICR experts, and Woodwell Climate cartographers.
28.08.2025 16:07 —
👍 1
🔁 0
💬 0
📌 0

This map from @cmshintani.bsky.social shows the range of the nomadic Dukha reindeer herders on the high taiga of northwest Mongolia.
28.08.2025 16:07 —
👍 9
🔁 3
💬 1
📌 0
IPCC concludes selection of authors for its Seventh Assessment Report — IPCC
More than 600 experts from 111 countries were selected to author and edit the influential UN climate report. Learn more about the full report from @ipcc.bsky.social www.ipcc.ch/2025/08/18/p...
22.08.2025 15:17 —
👍 2
🔁 0
💬 0
📌 0
As a lead author of Chapter Four, Natali, project lead of @permafrostpathways.bsky.social joins 20 other experts from 16 nations to gather the best available science on land surface processes, interactions between the cryosphere, ocean, and atmosphere, and changes in carbon sinks and sources.
22.08.2025 15:17 —
👍 2
🔁 1
💬 1
📌 0
📣 We’re excited to share that Senior Scientist and Arctic ecologist Dr. Sue Natali has been named a lead author for the Intergovernmental Panel on Climate Change (#IPCC) Seventh Assessment Report!
22.08.2025 15:17 —
👍 8
🔁 2
💬 2
📌 0

We have an opportunity members of the scientific community will not want to miss! Join us at the center in-person tomorrow, July 31 at 12:30 PM EST for an exciting presentation and discussion with UN High Level Climate Champion, Gonzalo Muñoz Abogabir.
Please RSVP at bit.ly/46SFM4z
30.07.2025 19:53 —
👍 3
🔁 1
💬 0
📌 0
This #MapMonday from @maps-and-pepper.bsky.social shows the predicted return period of once-in-a-generation storms.
As climate change increases extreme weather events, we need to prepare with accurate risk information.
28.07.2025 20:13 —
👍 17
🔁 8
💬 1
📌 2
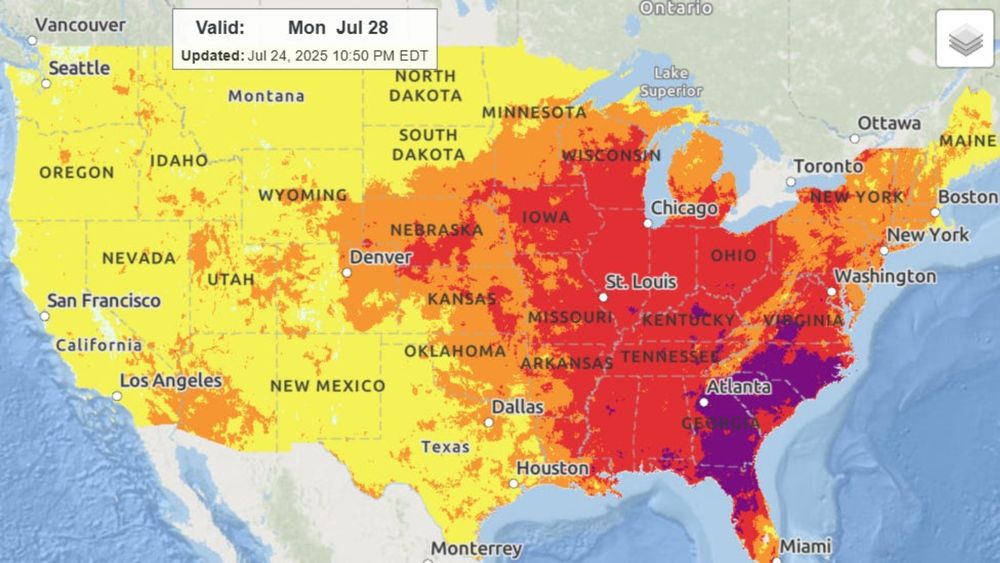
Late July's oppressive heat forecast isn't normal
A punishing heat wave will bring hot temperatures to eastern US and linger for several days, underscoring how climate change heats things up.
"This is exactly what we expected to happen," Holmes said. "As the earth gets warmer, we see more extremes and it's the extremes that get us. They kill us. They make us sick."
Quotes from our President, Dr. Max Holmes in this USA Today piece from @dinahvp.bsky.social: share.google/MJOpg6JF39JG...
28.07.2025 19:57 —
👍 5
🔁 3
💬 0
📌 0
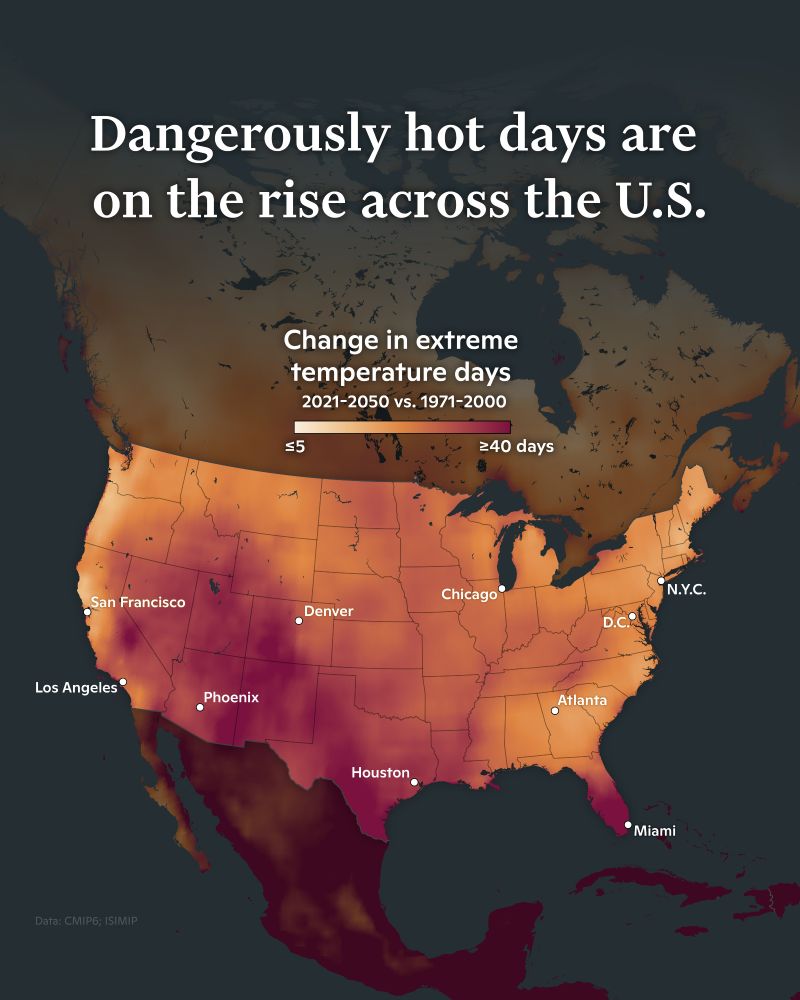
🌡️Have you been feeling the heat this week? Stay informed, hydrated, and safe!
Dangerously hot days are on the rise across the U.S. according to this map from @cmshintani.bsky.social. This week’s extreme temperatures are part of a larger trend of climate change.
25.07.2025 17:34 —
👍 5
🔁 4
💬 0
📌 0
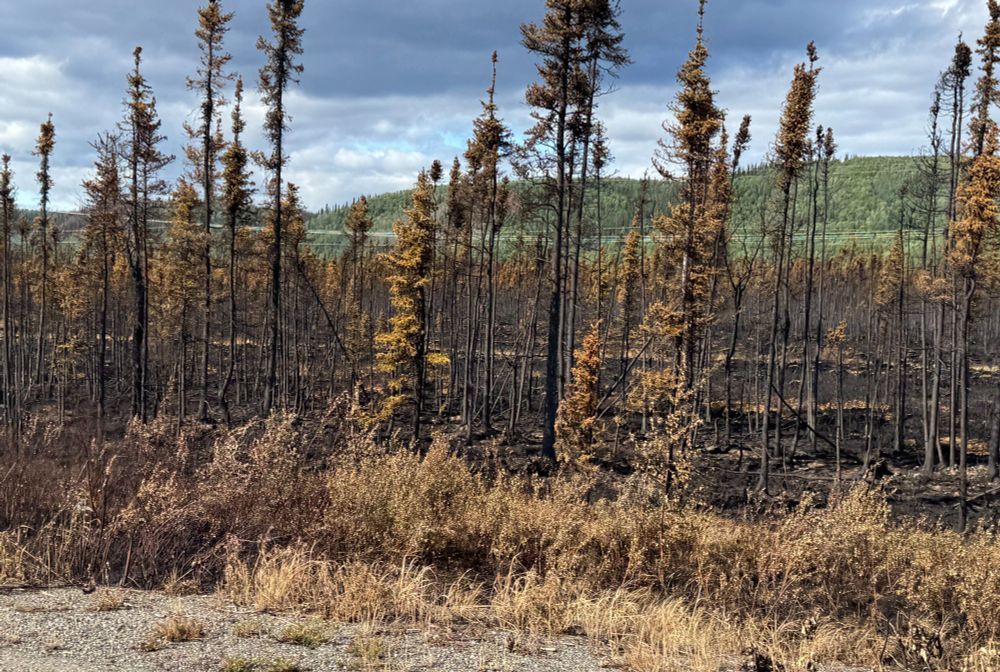
Research teams, including @permafrostpathways.bsky.social and collaborators, are refining tools to predict what increasing fires mean for regional and global carbon emissions and climate targets. Follow them to learn more!
24.07.2025 20:50 —
👍 5
🔁 1
💬 0
📌 0
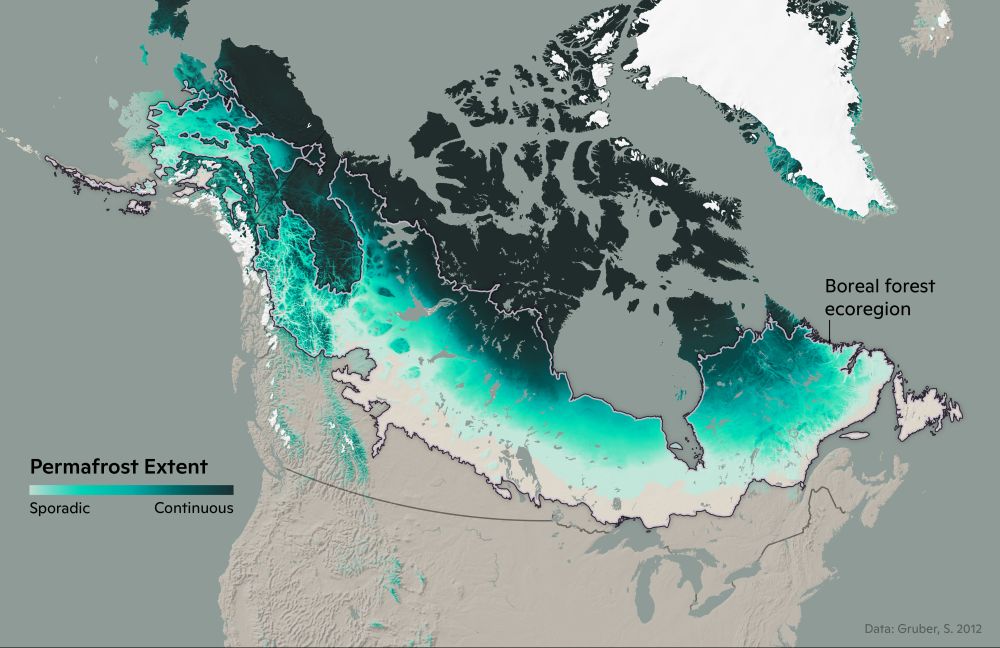
This map from @cmshintani.bsky.social shows the permafrost extant across the boreal forest ecoregion.
Read more about the connection between boreal wildfires and permafrost at www.woodwellclimate.org/connection-b...
24.07.2025 14:54 —
👍 32
🔁 9
💬 4
📌 0