

r6d10: Besides wild graph visualizations, one of my hobbies is designing funding models for NGOs. And why not combine both?
🇩🇪 y.lab.nrw/r6d10 🐘
\__
#100DaysOfCode #visjs #ngo #volunteering #publicgood #OpenSource #OpenScience
r6d10: Besides wild graph visualizations, one of my hobbies is designing funding models for NGOs. And why not combine both?
🇩🇪 y.lab.nrw/r6d10 🐘
\__
#100DaysOfCode #visjs #ngo #volunteering #publicgood #OpenSource #OpenScience

Multinational Corporations’ complex ownership structures allow them to reallocate activities that hurt their #ESG performance to locations with laxer rules.
Stefano Cascino and Maria Correia write on @lsebr.bsky.social we need to close the gaps in #regulation to achieve real ESG compliance.
Wichtige Geschichte von @gesasteeger.bsky.social und @gabrielakeller.bsky.social für @correctiv.org! Es weht ein neuer #Trump -Wind und die Finanzwelt passt sich an: teilweise still und heimlich verschwinden etwa Sozialziele – auch in Deutschland. #ESG
12.06.2025 08:27 — 👍 24 🔁 19 💬 0 📌 0
The great thing about futures is for every short there is a long.
For every trade you enter, there is a smart trader on the opposite side of your trade, that thinks you are wrong. Great isn't it?
An astute observation from Chris Shea worth noting 👇

Key Process Interactions Between SuccessFactors LMS and other modules
#SAP #SAPSuccessFactors #HRTech #LMS #LXP #HCM
The modern way to do #JSON #API.
15.06.2025 23:55 — 👍 1 🔁 0 💬 0 📌 0
Visual Description: Cover of the paper "Energiwirtschaftliche Segment Taxonomie ESTa 2.0" by Detlef Burkhardt. On a black, wavy-patterned background, a white frame contains four geometric shapes: a blue triangle, a green pentagon, a yellow circle, and a gray square. Below are the DOI, the URL fosseam.org, and the FOSS E³AM logo. Content Summary: The taxonomy structures the energy market into: • 3 Levels: Distribution Grid, Utility Case, Transmission Grid • 5 Market Segments: Prosumer, Residential, C&I, Utility Scale, Grid Scale • Monetization: EPEX, EEX, OTC, Redispatch 2.0, PPA, VPP
New #FOSSEA³M paper! We present #ESTa 2.0, our new taxonomy for the complex energy market.
👉 Please note: The publication is currently in German.
We are gauging interest for an English translation. Let us know in the replies if you'd be interested.
y.lab.nrw/esta2
#EnergyTransition #SmartGrid

🚨 Save the date for the next #OSPO OnRamp!
📜 #OpenSource at the European 🇪🇺 Commission
🎙️ Gijs Hillenius from the EC OSPO
📅 May 16, 10:30–12:00 CEST
🧩 Open to all. No registration
Lear from decades of #OpenSource inside the 🇪🇺EC
▶️ forum.ospo-alliance.org/t/onramp-on-...

A good book to add to your trading library is Van Tharp's "Trade Your Way to Financial Freedom"
Wise words👇

Wise words from Peter Brandt again 👇
16.04.2025 03:55 — 👍 1 🔁 1 💬 0 📌 0
Y'all ever breathe hexagonally?
Yea me too
👾 :: Code :: www.shadertoy.com/view/3fsXW2
🏷️ :: #threejs #glsl #shadergang #creativecoding #genart #art #code #gamedev #ue5 #buildinpublic #indiehacker #godot #gamedev
New #EU rules are strengthening #ESG requirements for banks, aiming to improve risk management and align portfolios with climate goals. Banks must now reflect ESG factors in executive pay and plan for transition risks. A step forward for sustainable finance!
#Eurostock #Nasdaq100

Screenshot from a table comparing FBI and FAIR pattern.
Day 44:
This sounds a bit techie, but I love these puns:
Formerly everything used to be
#FBI 🕵️ < 😎
Today everything is
#FAIR 🌱 <- 🤩
Ohkey that's a bit of a limp. FBI is for (web-)services, FAIR is more for data.
\__
#100DaysOfCode #OpenSource #EIP #API #Fintech #BigData #OpenFinance
DDay 43:
So many beautiful #Jupyter solutions. I can’t even make up my mind. So I started a dataset comparing free options, cloud-native ones (AMIGOs), and subscription-based tools.
👉 Check it out here: y.lab.nrw/jupyter
We’re still looking for contributors.
\__
#100DaysOfCode #OpenSource #Dev
Day 42:
.
Yes 42
.
\__
#100DaysofTrade #100DaysOfCode #Dev

Chris Shea coached a lot of traders. From what he saw only about 10% make it on a consistent long term basis.
Are you in that 10%? What are you doing to get into that cohort?
From Chris' book 👇
⚠️ All content is for educational purposes only.
⚠️ None of our content should be considered financial advice.
⚠️ Trading involves significant risk.
⚠️ Trading leveraged products can lead to financial ruin.
👉 Have a plan.
👉 Follow your plan.
👉 Control risk always.
And
👉 Trade small to survive.

Today, the S&P 500 is up +35 points.
#finsky #econsky

Screenshot showing a PAWS Jupyter Notebook.
Greetings from the depths of my actual rabbit hole.
\__
#100DaysOfCode #100DaysOfTrade #yfinance #python #dev #fintech

A stylized rabbit falls headfirst into a deep hole, surrounded by Jupyter Notebook symbols, Python logos, and the error number 429. The background transitions from warm orange to cool blue, symbolizing a digital journey.
Day 40:
Actually, I just wanted to see what yfinance, a #Python library for #YahooFinance, was like. But then I encountered an HTTP error called 429. And now I've fallen into the Rabithole #Jupyter Notebooks. Great, I like it here.
\__
#100DaysOfCode #Dev #OpenSource #Fintech

March means it's #SXSW Time. A lot of smart episodes to binge. And here are my first recomendation, not only why she is the CEO of #bluesky. Yes, it's #Opensource
y.lab.nrw/bsky-ceo
\__
#100DaysOfTrade #100DaysOfCode #ScocialTrading #SocialMedia #dev
Update to v0.7.6.
... I've added Chapter 1 and 2 with a nice "Brief History".
doi.org/10.5281/zeno...
RFC: I need you for a peer review. Let me know if you're interested.

Image: A stylized black-and-white digital illustration of a globe, surrounded by interconnected data points, lines, and financial charts. The image represents the complexity of global trade, industry classification, and economic systems, visually symbolizing the structure of economic taxonomies. Content: From ISIC to GICS: The Evolution of Economic Classification Standards Across Regions Understanding the world economy requires structure. Industry classifications define how businesses, markets, and entire economies are categorized, influencing trade, investment, and policy decisions. This working paper explores the historical development and modern application of economic classification systems, from global frameworks like ISIC to market-driven structures such as GICS. Chapters: 1. Introduction – Why classifying economies matters 2. From Ancient Trade to AI Support – The evolution of classification 3. ISIC as the Global Standard – The backbone of economic classification 4. GICS & Market Systems – How financial markets define industries 5. Resources – Key datasets, research, and institutional frameworks Economic classification is more than a technicality—it shapes how we measure growth, allocate capital, and analyze markets. This paper lays the foundation for further research into the intersection of taxonomy, geo-spatial frameworks, and market-driven classifications. Hashtags: #Economy #IndustryClassification #GICS #ISIC #Finance #EconomicResearch #GlobalTrade #Markets #UN #100DaysOfTrade
Day 39:
Taxonomy of the world economy. Sounds odd? Maybe. But classifying industries, markets and assets is how we make sense of global trade. I compared some major, like #ISIC or #GICS and start a working paper:
y.lab.nrw/evoecoclass (DOI)
\__
#100DaysOfTrade #EconomicResearch #MSCI #SPDJI

Check out the new offering from my #startup. #ESG #quiz.
themiddleroad.org/courses/esg-...

Recent DSLC.io club meetings:
🔵 R4DS: Web scraping youtu.be/Kx5D4sbjQ-k
From the aRchives:
🔵 Tidy Modeling with R: youtu.be/FbPjR_Iimwk
Visit dslc.video for hours of new #DataScience videos every week!
#dataBS #RStats #R4DS

Update today:
09.03.2025 12:55 — 👍 0 🔁 0 💬 0 📌 0
Image: An open book with Python code on the right page and financial charts, heatmaps, and candlestick patterns on the left. The background features a minimalist workspace with Python and OpenAPI/Swagger icons, symbolizing algorithmic trading and API integration. The color scheme blends warm browns and cool blues. Content: This guide (v0.7.5) helps you calculate asset correlations using Python and the Capital API. - Step 1: Set up API access and enable 2FA for security. - Step 2: Retrieve basic market data using API requests. - Step 3: Fetch multi-asset data and compute correlations. - Step 4: Visualize correlations with heatmaps and export results. Try it here: y.lab.nrw/algo08 and share your feedback! Hashtags: #100DaysOfTrade #100DaysOfCode #Python #OpenSource #AlgoTrading #DataScience #QuantFinance #FinanceAPI #APIs
Day 40:
Version 0.7.5 is live! Want to calculate asset correlations with #Python & the Capital API? #Heatmaps, alerts & CSV export included. Throw your feedback at me! Click ALT. Try it out:
y.lab.nrw/algo08.
\___
#100DaysOfTrade #100DaysOfCode #OpenSource #AlgoTrading #DataScience #FinanceAPI

Screenshot BTC/USD Overall

Screenshot BTC/USD last 6 month.

Screenshot BTC/USD last month.
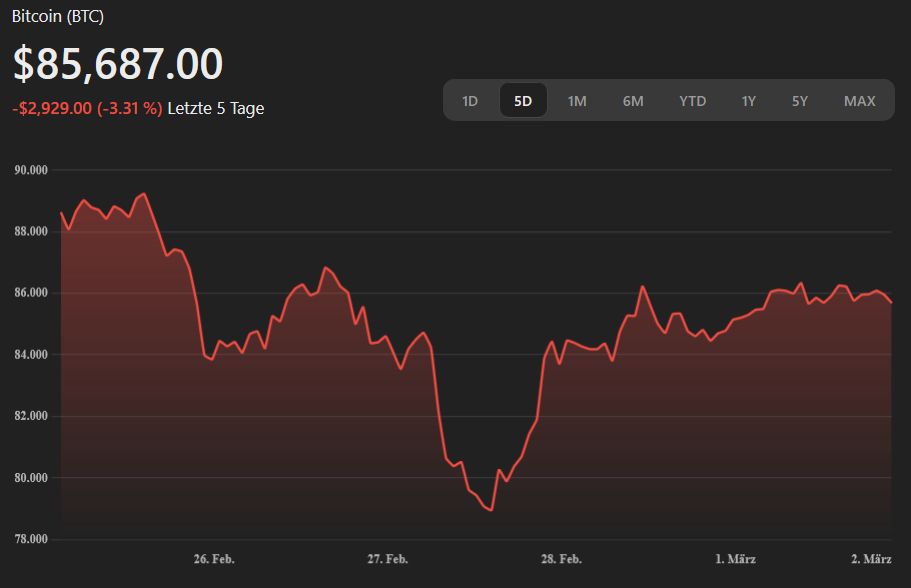
Screenshot BTC/USD last 5 days.
Day 39:
4 Views, 1 Asset: BTC/USD.
It's a pitty that #BTCUSD is so heavily influencing the other #altcoins as well. How could this be better decoupled? It can't be that every time a bag of rice tips over in China or a wallet is hacked, everything immediately goes #bearish.
\__
#100DaysOfTrade

@Saylor: "Sell a kidney if you must, but keep the bitcoin."
checking in on #MichaelSaylor now that bitcoin is below $80k and he bought ~$20 billion worth for $95-105k with borrowed money in the past two months:
https://x.com/saylor/status/1895325810942411234
#MSTR #MicroStrategy #bitcoin #BTC
