P.S.: I still think Python and R are incredible programming languages with amazing libraries and packages, like pandas and the tidyverse.
The great thing is that you can also use DuckDB with them!
duckdb.org
4/4 🧵

@naelshiab.bsky.social
Senior data producer, CBC/Radio-Canada. Behind https://github.com/nshiab/simple-data-analysis and https://code-like-a-journalist.com/. More on https://naelshiab.com/.
P.S.: I still think Python and R are incredible programming languages with amazing libraries and packages, like pandas and the tidyverse.
The great thing is that you can also use DuckDB with them!
duckdb.org
4/4 🧵
Under the hood, the simple-data-analysis library uses the incredibly fast @duckdb.org and its extensions. If you want to check it out, here's the repo: github.com/nshiab/simpl...
And if you want to make my day, test it and, if you enjoy it, give it a ⭐!
3/4 🧵

For geospatial data, it's 3x-5x faster to join and count the trees in each Montreal neighbourhood.
I started working on the library 3 years ago. I was tired of switching between R/Python/JavaScript in my projects and wanted to keep it to TypeScript from A to Z. 🤓
2/4 🧵

So happy to see how fast the TypeScript library simple-data-analysis has become for tabular and geospatial data! 🤩
It's now processing data 6x-12x faster than traditional R and Python solutions in my little test in which I crunched a 1.7 GB CSV file.
1/4 🧵
Interesting! I'll have a look. Thanks! :)
07.11.2025 21:28 — 👍 1 🔁 0 💬 0 📌 0Hey @threlte.xyz ! 👋 I was wondering if you knew a good way to record animations made with the amazing Threlte library as videos. Thank you for all of your amazing work!
07.11.2025 21:07 — 👍 2 🔁 0 💬 1 📌 0
Thanks for the mention in your newsletter, @observablehq.com!
23.09.2025 15:30 — 👍 4 🔁 0 💬 0 📌 0Happy to see @nodejs.org! But it would be wonderful to add @deno.land as well! 🦆
12.09.2025 17:53 — 👍 0 🔁 0 💬 0 📌 0Recoding parts of my TypeScript libraries using generics and function overloads. It's beautiful. 🥹
08.09.2025 16:35 — 👍 1 🔁 0 💬 0 📌 0
Here's the link.
newsinteractives.cbc.ca/features/202...


We have just updated our international trade tracker with the latest numbers from July. See all imports and exports broken down by country, province, and product!
Link below!
Here's the link.
observablehq.com/@nshiab/math...


My most popular interactive @observablehq.com notebook, Math for Journalists, just got a fresh update! 🧑🎓
👉 Sample size and confidence: I explain how sample sizes work, like in a survey.
👉 Tests for statistical significance: I break down what "statistically significant" means.
Link in comments! 👇
What an amazing dataset!
20.08.2025 12:47 — 👍 1 🔁 0 💬 1 📌 0
Here's the link.
newsinteractives.cbc.ca/features/202...


New project is live! We're now tracking all products coming in and out of Canada 🇨🇦. See how international trade is rapidly shifting, with breakdowns by country, province, and product 🚗🥦🛢️.
Link in the comments! 👇

Amazing work by @maxxen.bsky.social and the @duckdb.org team. I've been using the spatial extension for a while now for my geospatial analyses, and it's wonderful to see it getting better and faster.
duckdb.org/2025/08/08/s...

Will you be the 300th person to fall in love with this amazing library? 😏
09.07.2025 17:32 — 👍 3 🔁 0 💬 0 📌 1
I asked Gemini-CLI to fix mistakes and add examples to the documentation of the open-source library journalism. It updated 58 files and did a pretty good job in half an hour. I used the free tier, but the @simonwillison.net LLM pricing calculator estimated the cost at $6 USD! Very impressed. 😶
02.07.2025 18:40 — 👍 1 🔁 0 💬 0 📌 0Very interesting. Thanks @jensvb.bsky.social !
02.07.2025 18:36 — 👍 2 🔁 0 💬 0 📌 0Last week, we published our interactive project on climate matches. I published my detailed methodology on how we wrangled the data. Here's the link, with a shout-out to @freakonometrics.bsky.social who helped me with the statistical approach! 🧑🏫
👇
newsinteractives.cbc.ca/features/202...
 02.07.2025 00:34 — 👍 3 🔁 0 💬 0 📌 0

Maybe www.code-like-a-journalist.com will be of interest for you. :)
28.06.2025 02:18 — 👍 1 🔁 0 💬 2 📌 0Coded in Svelte! Maps done with Observable plot!
27.06.2025 19:18 — 👍 5 🔁 0 💬 2 📌 0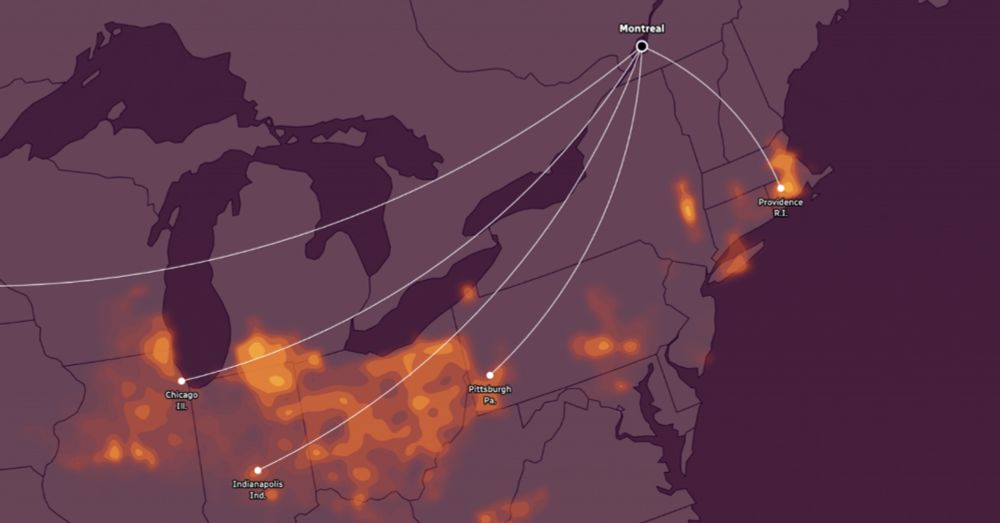
Here's the link. newsinteractives.cbc.ca/features/202...
26.06.2025 13:21 — 👍 4 🔁 3 💬 2 📌 1New project! I've always felt climate projections were a bit too abstract. To make them more concrete, I identified North American cities that already experience the projected temperature and precipitation of Canadian cities. And the result is... 😳
Link in the comments! 👇
#dataviz #climate
Over 100 heat records could be broken today in Ontario and Quebec. 🫠
23.06.2025 12:38 — 👍 4 🔁 2 💬 1 📌 0So nice of you! Feel free to ping me if you are stuck on anything! :)
16.06.2025 13:05 — 👍 1 🔁 0 💬 0 📌 0
Thank you @datawrapper.de for mentioning our Climate Dashboard! 🤩
11.06.2025 13:27 — 👍 2 🔁 0 💬 0 📌 0
Terrible air quality in Alberta and Saskatchewan right now. 😷
10.06.2025 17:17 — 👍 3 🔁 2 💬 0 📌 3