Witkoff tries to praise Netanyahu in Tel Aviv, but has a hard time finishing his thought because of booing
11.10.2025 17:33 — 👍 12317 🔁 3141 💬 1015 📌 377
😡
18.06.2025 22:20 — 👍 1 🔁 0 💬 0 📌 0
Repost from @resistancerangers.bsky.social on IG- I know we're about to declare war with Iran, and there are so many fronts to this continuing shitzkrieg, but this one, this right here, hurts my little raccoon soul most. For the love of all that's green and blue, keep calling.
💚🌲🌊💙
18.06.2025 01:17 — 👍 199 🔁 82 💬 12 📌 11
Up for sale by the Wyoming congressional delegation
17.06.2025 16:44 — 👍 3 🔁 0 💬 0 📌 0
We need to stop this bill!
17.06.2025 16:42 — 👍 2 🔁 0 💬 0 📌 0
Psst…the only way to stop climate change is to stop burning fossil fuels. Pass it on.
09.06.2025 19:28 — 👍 773 🔁 230 💬 24 📌 4
@billmckibben.bsky.social can you DM me? Thanks!
23.05.2025 03:04 — 👍 1 🔁 0 💬 0 📌 0
Install batteries
07.04.2025 18:54 — 👍 1 🔁 0 💬 0 📌 0
Gloating? On losing our retirement savings? You think Democrats are not American? Somehow we are immune? It’s not our jobs that are cut? Not our finances? Who are you?
04.04.2025 11:43 — 👍 0 🔁 0 💬 1 📌 0
Agreed
14.03.2025 12:27 — 👍 2 🔁 0 💬 0 📌 0
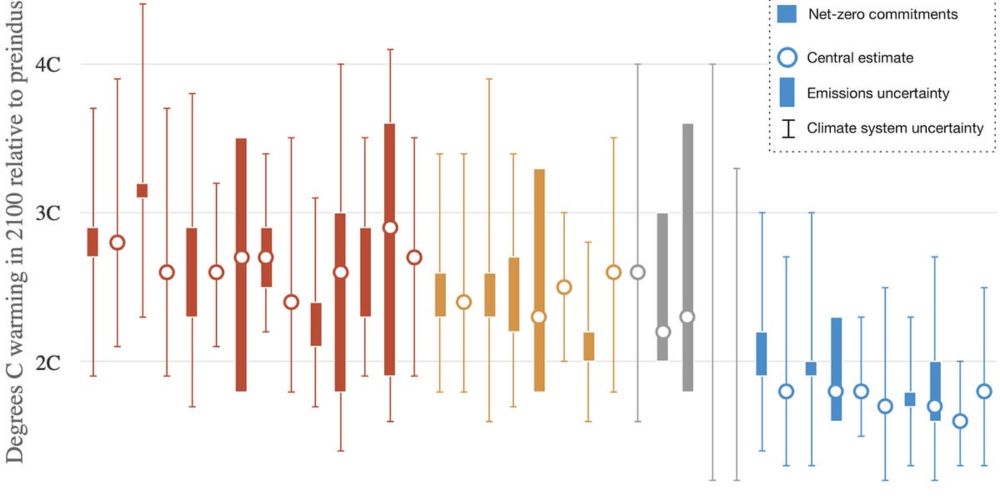
Moving away from high-end emissions scenarios
I have a new commentary in Dialogues on Climate Change exploring climate outcomes in current policy scenarios
New post on The Climate Brink from Zeke @hausfath.bsky.social about our climate future. With current policies, we’re on track for a bit less than 3C, with 2030 NDCs we’re on track for about 2.5C, and with net zero pledges we’re on track for a bit less than 2C.
www.theclimatebrink.com/p/moving-awa...
15.01.2025 18:43 — 👍 241 🔁 101 💬 17 📌 19
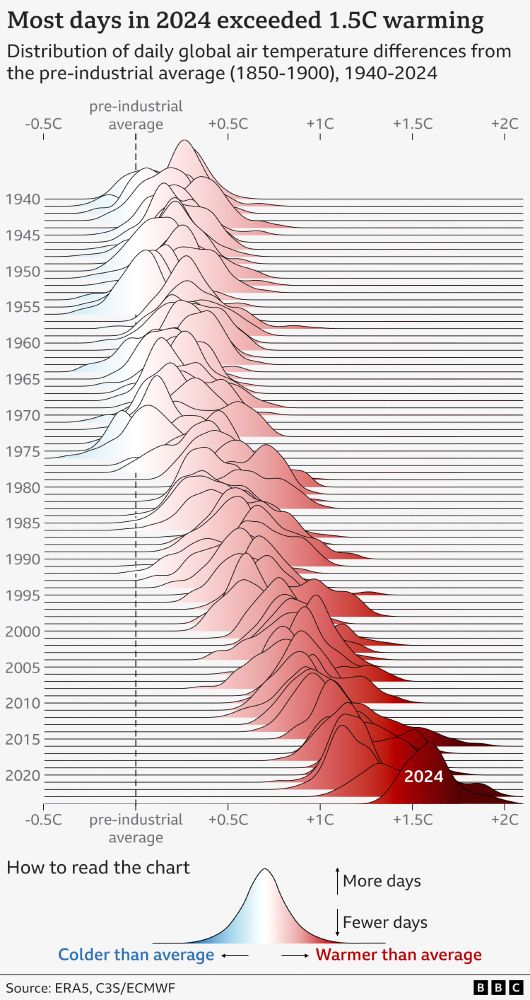
Ridgeline chart showing the distribution of global daily air temperature differences from the pre-industrial reference period (1850-1900), for every year between 1940 and 2024. Each individual year resembles a hill, shaded in a darker shade of red and further to the right for warmer years. The trend is clearly towards warmer years, with 2024 standing out as first year above 1.5C.
NEW: 2024 has just been confirmed as the warmest year on record, and the first to breach the 1.5C threshold.
We used a ridgeline (Joy Division inspired) chart to visualise daily temperature anomalies since 1940.
2024 clearly stands out with 100% of its days above 1.3C and 75% above 1.5C.
10.01.2025 08:04 — 👍 5921 🔁 2769 💬 211 📌 332
I support Ken Martin!
02.01.2025 22:42 — 👍 0 🔁 0 💬 0 📌 0
Simulated reconstruction of December #Arctic sea ice thickness since 1901. Large interannual variability, but watch what happens in recent years...
Information about this data: doi.org/10.1175/JCLI.... Data set only available through 2010.
28.12.2024 23:10 — 👍 120 🔁 31 💬 5 📌 1

Line graph time series of 2024's daily Arctic sea ice extent compared to decadal averages from the 1980s to the 2010s. The decadal averages are shown with different colored lines with white for the 1980s, green for the 1990s, blue for the 2000s, and purple for the 2010s. Thin white lines are also shown for each year from 2002 to 2022. 2024 is shown with a thick gold line. There is a long-term decreasing trend in ice extent for every day of the year shown on this graph between October and January by looking at the decadal average line positions.
Friday ice update - #Arctic sea ice extent is currently the *lowest* on record (JAXA data)
• about 600,000 km² below the 2010s mean
• about 1,140,000 km² below the 2000s mean
• about 1,690,000 km² below the 1990s mean
• about 2,110,000 km² below the 1980s mean
Plots zacklabe.com/arctic-sea-i...
20.12.2024 15:21 — 👍 113 🔁 45 💬 2 📌 8
Tons of fuel oil thrown into the sea during the wreck of Russian tankers,reached the shores of Russia's Krasnodar region, the plume stretched for 55 km
Beaches of Anapa may become unsuitable for human habitation for years. Also, the Kerch Strait water area may be polluted due to the change of wind.
20.12.2024 12:48 — 👍 432 🔁 123 💬 19 📌 8

Breaking News!
An extremely dangerous level 8 heatstroke alert has been issued for Santa's reindeer.
18.12.2024 19:42 — 👍 155 🔁 30 💬 13 📌 2
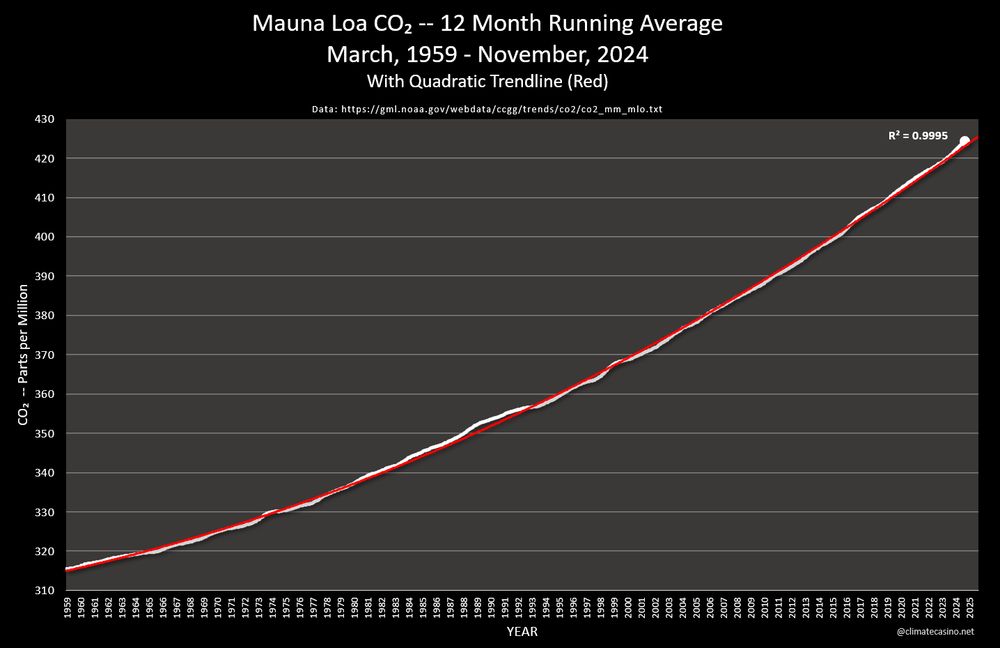
This graphic gives the 12-month running average for Mauna Loa CO₂ since 1959, with a quadratic trendline (in red).
An R² of 0.9995 is overwhelming evidence that atmospheric CO₂ growth is accelerating. And at present, CO₂ is above the trendline!
The climate 8-ball says: "Outlook f&%ked, try again."
17.12.2024 18:56 — 👍 205 🔁 61 💬 9 📌 7
Looks optimistic to me!
15.12.2024 21:59 — 👍 4 🔁 0 💬 0 📌 0

Line graph time series showing global land surface temperatures (90°S to 90°N) in a red line and global mean surface temperatures (90°S to 90°N) in a blue line. Temperatures are averaged annually from 1900 through 2023. Line trends are also shown from 1990 to 2023. The land is warming faster than the global mean.
As a reminder, land areas (where we live) are warming around twice as fast as the oceans. Subsequently, most of us are 'experiencing' temperatures rising faster than the global mean record.
Data from NASA GISTEMPv4: data.giss.nasa.gov/gistemp/ ⚒️🧪
05.12.2024 00:50 — 👍 238 🔁 89 💬 9 📌 6

Four polar stereographic maps showing Arctic near-surface air temperature anomalies for the month of December in 1984-1993, 1994-2003, 2004-2013, and 2014-2023. Most all areas are observing long-term warming, which is largest over the Arctic Ocean.
Well it's December, which is another month that observes particularly large #Arctic amplification. Here's a view of those temperature changes by decade...
Data from ERA5: cds.climate.copernicus.eu/datasets/rea...
01.12.2024 13:46 — 👍 118 🔁 31 💬 2 📌 4
Delicious!
30.11.2024 02:33 — 👍 0 🔁 0 💬 0 📌 0

Green line graph time series of average sea surface temperature anomalies for each January to October period from 1900 through 2024. There is large interannual variability, but an overall long-term increasing trend. Anomalies are computed relative to a 1981-2010 baseline.
Global mean sea surface temperature anomalies (departure from average) so far this year ➡️ highest on record
Data from NOAA ERSSTv5 averaged over January to October.
20.11.2024 13:00 — 👍 178 🔁 66 💬 7 📌 3

Elwha
16.11.2024 20:43 — 👍 2 🔁 0 💬 0 📌 0
NO KINGS
DOWN WITH MAGA
Trump is a pedophile rapist sex trafficker
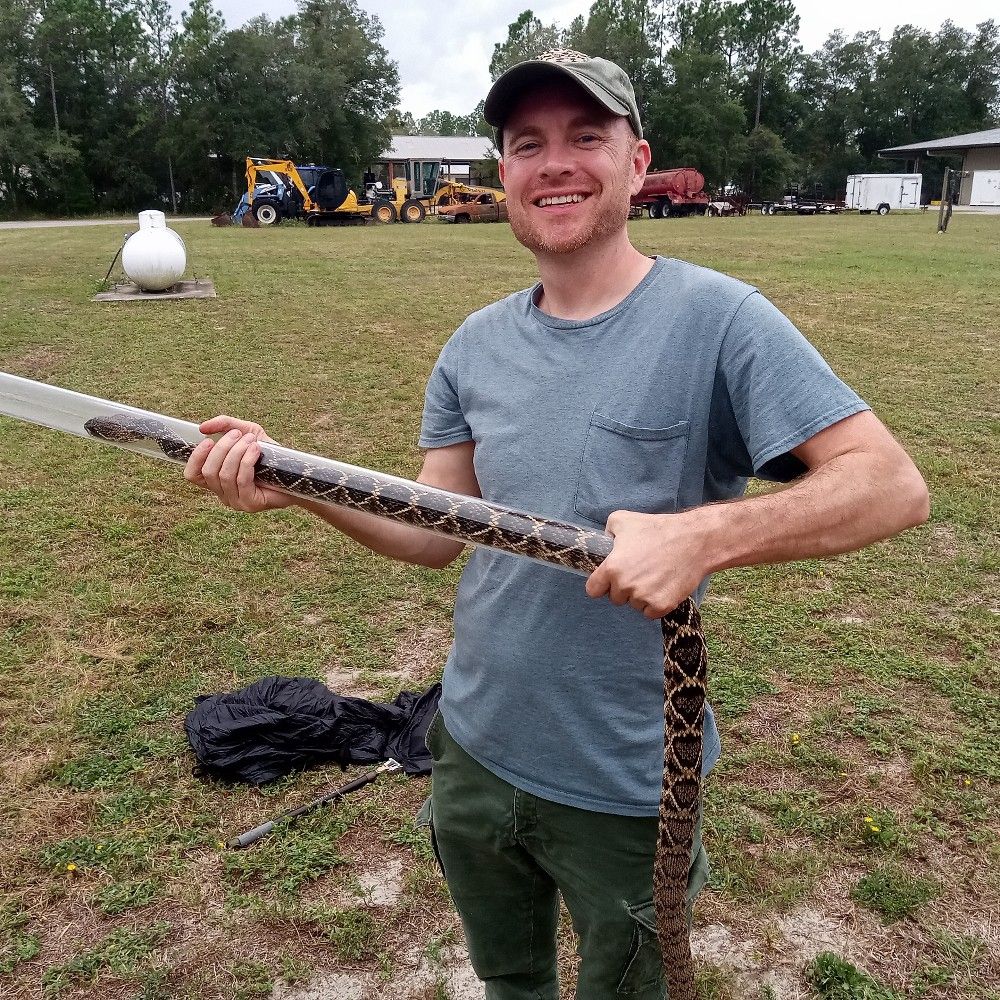
Fish biologist and ecologist studying fish movement and invasive species.
I am a scientist who works (& plays) in waterways to understand their health & function.
Associate Professor in Biological Sciences & Global Change Center Faculty Affiliate @ Virginia Tech. UWYO/Emory alum. she/her. Posts=my opinions. www.hotchkisslab.com
U.S. Congressman serving my hometown #IL17. TV Meteorologist/climate guy for 22+ years. (Personal/Campaign Account) 🇺🇸🏳️🌈🌎
Canada Research Chair in Wildlife Restoration Ecology, Department of Biology, University of British Columbia
#WiRELab
Syilx Territory & Kelowna, BC
atford.weebly.com
I am a professor of tropical ecology at the University of York. I have a passion for Mountain ecosystems and cultures across the Global South, particularly in Kenya and Tanzania where I work with many Universities, NGOs and Government organisations.
The official "Resistance" team of U.S. National Park Service. Our website: www.ourparks.org
Doting grandmother, among other things.
An adventurous cowboy living life to the fullest. Green Beret, rodeo rider, pilot, hiker, etc. I love exploring new places. Now in Mexico. 🤠
Online coaching to prepare you for interviews: https://zcal.co/i/RCa7IPCc 15-minute free trial
Full-Time Federal Campaigns Director @NRDC.org 🌎. Part-Time Westie belly scratcher 🐶. Breast cancer thriver. 🫶🏻 Denver based 🏔️ World bound. ✈️
Alum of:
✔️Kamala Harris
✔️First Descents
✔️Hillary
✔️Planned Parenthood
✔️Wellesley College
The Freedom Writers Collaborative is a multi-state Indivisible Group and a grass roots operation providing messaging and social media content inspired by our progressive allies.
https://freedomwriterscollaborative.org
I'm a wetland ecologist and conservation biologist with the NYS DEC. Obsessed with reptiles, amphibians, spiders, insects, and other creepy crawlies.
Screw it, let's do it.
Proof it's the real me: https://www.linkedin.com/posts/rbranson_richard-branson-richardbransonbskysocial-activity-7267516793689124864--I14
Here's my blog: https://www.virgin.com/branson-
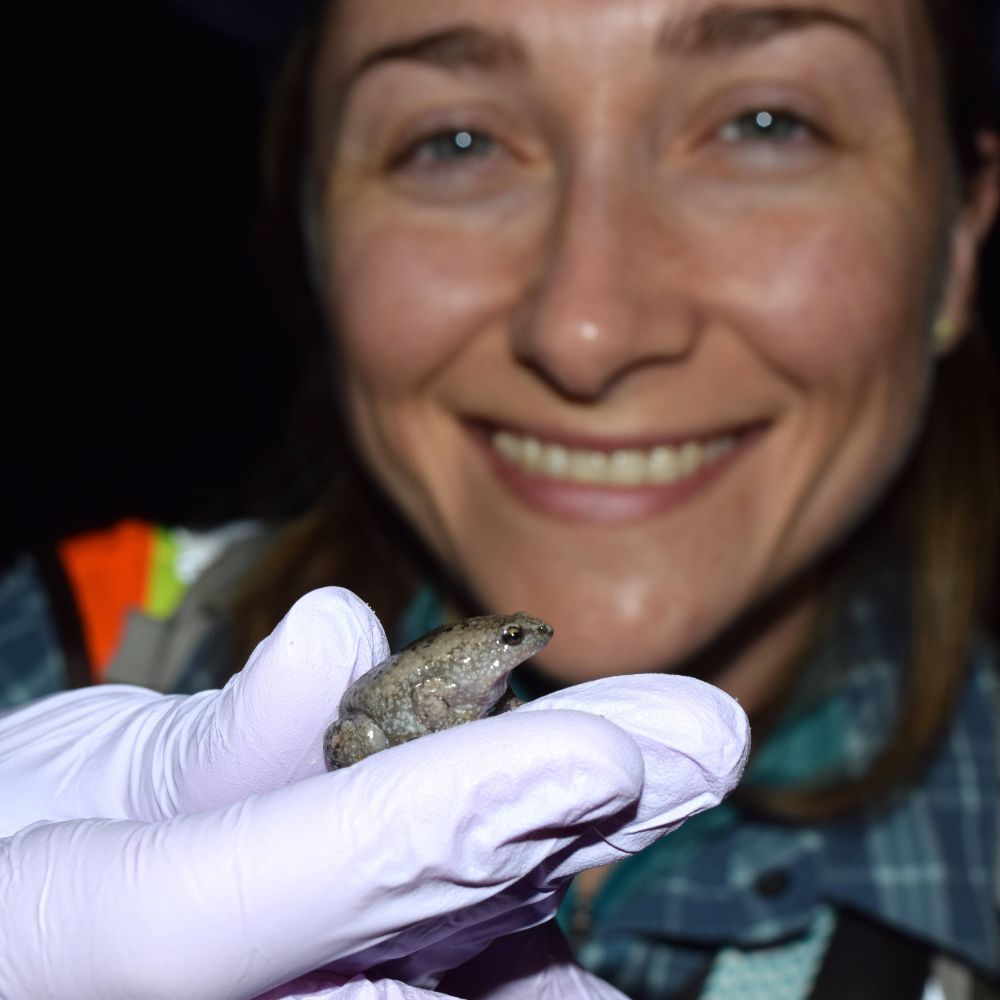
Assistant Professor @ University of Mississippi | Amphibian ecophysiology, climate change, and disease #HERper | she/her
Personal account | Views my own
A scientific journal designed for ease and ethics. Publishing open-access articles, Special Issues, and entire journals.
Join Us ⬇️
https://www.stacksjournal.org
💧🕊️ Internationalisation @ Watersnoodmuseum (Flood Museum). Learning from floods worldwide. Opinions mine: joepjanssen.com
Ecologist, researcher, prof emerita, volunteer, speck in the universe; former city council member; past candidate for Utah Senate; engaged in our community
ACTIVISM AGAINST FASCISM!
Woke. Baby Boomer. Dog Lover.
Concern: fascism spreading globally.
Leftie/liberal. Defending democracy.
Maximizing followers/following to exchange as much dialogue as possible in America's darkest hours.