I can't speak for the literature in general but I re-calculated these quantities for two studies (mouse VISp, monkey MT) and the SC-NC relation is robust. The confounded estimate can overstate the magnitude of the relationship when using few repeats but most studies use many repeats.
04.02.2026 21:03 —
👍 1
🔁 0
💬 0
📌 0
Ah! So you calculated signal correlation across non-overlapping repeats (randomly chosen)? I did not pick up on that from brief read of methods.
04.02.2026 18:59 —
👍 0
🔁 0
💬 2
📌 0
It probably doesn't matter for the sample size you used (20 repeats!). But I wanted to mention a small sample bias the community should consider for future follow on studies w/ smaller sample sizes.
04.02.2026 18:15 —
👍 0
🔁 0
💬 1
📌 0
Thanks Dr Rust!
30.01.2026 19:52 —
👍 1
🔁 0
💬 0
📌 0
Note that cts mapping theorem is with regards to the 'converged' estimate, so there are no 'errors' in the eigenvalue estimates. You have to imagine you have the true eigenvalues in hand, they follow a power-law, and you are reading off the exponent (maybe log-log fit like Stringer et al.).
28.01.2026 18:31 —
👍 1
🔁 0
💬 0
📌 0
I would be surprised if the transformation from eigs that follow power law to exp wasn't continuous but my intuition has often been discredited! (there maybe a tricky point of discontinuity?)
28.01.2026 18:31 —
👍 1
🔁 0
💬 1
📌 0
unbiased seems impossible!
28.01.2026 16:00 —
👍 0
🔁 0
💬 0
📌 0
Consistency maybe: Kong and Valiant 2017 (arxiv.org/pdf/1602.00061) give a a proof that spectrum reconstruction by eigenmoment matching is consistent. By cts map theorem tail exponents read off from their estimator should follow as consistent also (en.wikipedia.org/wiki/Continu...).
28.01.2026 16:00 —
👍 0
🔁 0
💬 2
📌 0
Thanks Kam!
28.01.2026 15:41 —
👍 0
🔁 0
💬 0
📌 0

Multi-panel figure (A–F) illustrating eigendecoding of neural population activity. Panel A shows eigenmode neural loadings plotted against neuron index (sorted by SNR). Panel B shows eigemode tuning curves across stimulus index, with overlaid model predictions (linear and DNN) and reported R² values. Panel C shows example images of maximally excitatory and inhibitory driving stimuli. Panel D presents a schematic decomposition of a stimulus into a weighted sum of eigenmodes with eigenvalues λᵢ and eigenvectors uᵢ. Panel E plots fraction of variance explained (R²) versus eigenmode index, comparing eigenmodes to single-neuron averages. Panel F shows signal-to-noise ratio (SNR) versus eigenmode index, with points and error bars for eigenmodes and a dashed line for neuron-average SNR
These features are more robustly encoded (higher SNR) and more easily characterized than single neuron tuning (higher R2 by classic models, corrected for SNR) —suggesting studying population visual representations may prove more tractable than studying single neuron tuning. (5/6)
27.01.2026 16:34 —
👍 9
🔁 1
💬 1
📌 0

Four-panel figure labeled E–H. Panel E (‘Example recording fit eigenspectra’) shows a log–log plot of eigenvalues λᵢ versus rank i with three fitted curves: a blue cvPCA power law, a light red MEME power law, and a darker red MEME broken power law. Panel F (‘Model vs data eigenmoments’) plots eigenmoment value versus eigenmoment power, showing colored model curves compared to gray points with error bars labeled as an unbiased estimate. Panel G (‘Broken power law across recordings’) shows multiple red log–log eigenspectra with a slope change, annotated with α₁ for low ranks and α₂ for high ranks. Panel H (‘Comparison of tail slope’) is a scatter plot of MEME α₂ versus cvPCA α with points and error bars relative to a black identity line MEME and cvPCA estimates diverge.
We find that instead mouse visual cortex follows a piecewise power-law with slopes of 0.5 and then 1.2. Thus the visual representation is less complex than previously thought—10 image features can explain 30% of the representation. (4/6)
27.01.2026 16:34 —
👍 9
🔁 0
💬 1
📌 0

Two side-by-side scatter plots labeled E and F comparing estimated α versus true α. Panel E, titled ‘Signal & noise eigenvectors aligned,’ shows blue points (cvPCA) and red points (MEME) clustered near a black diagonal identity line, with MEME closer to the line than cvPCA. Panel F, titled ‘Signal & noise independently sampled,’ shows red MEME points remaining near the identity line, while blue cvPCA points fall well below it. Axes range approximately from 0.5 to 1.25 on both true α (x-axis) and estimated α (y-axis).
We find that the estimator (cvPCA) used to determine this slope was biased and we propose a novel approach (MEME) to inferring eigenvalues that is robust to noise correlation and can even infer eigenvalues beyond the rank of the data. (3/6)
27.01.2026 16:34 —
👍 12
🔁 1
💬 1
📌 0

“Log–log plot labeled panel C showing variance versus PC dimension. The y-axis (variance) ranges from 10⁻¹ to 10⁻⁵, and the x-axis (PC dimension) ranges from 10⁰ to 10³. A black straight line with negative slope indicates a power-law decay, annotated with α = 1.04. A blue curve follows a similar trend but deviates at low and high PC dimensions.”
Prior work concluded that the eigenvalues of mouse primary visual cortex responses to natural images followed a power-law with a slope of 1 (go.nature.com/3TcQITc). They argued this was a critical balance between representation smoothness and efficiency. (2/6)
27.01.2026 16:34 —
👍 6
🔁 0
💬 1
📌 0
PNAS
Proceedings of the National Academy of Sciences (PNAS), a peer reviewed journal of the National Academy of Sciences (NAS) - an authoritative source of high-impact, original research that broadly spans...
New paper out at PNAS: www.pnas.org/doi/10.1073/...
Revisiting the high-dimensional geometry of population responses in the visual cortex with @jpillowtime.bsky.social. The review took forever because a reviewer was doubtful our new estimator can infer eigenvalues beyond the rank of the data! (1/6)
27.01.2026 16:34 —
👍 70
🔁 19
💬 2
📌 2

Beautiful figure!
31.12.2025 00:47 —
👍 1
🔁 0
💬 1
📌 0
That image is from 1961 and an idealization. Here is an actual trajectory of fixational eye movements. The dots are 2 ms apart. If a midget ganglion cell, with single-cone receptive field, fires at 100 Hz, then every spike reports about a different cone. How can we ever read anything?
07.11.2025 18:23 —
👍 31
🔁 8
💬 3
📌 1
Thrilled to join UIUC as Prof of
Computational Neuroscience! Lets figure the brain out before we're dead! Recruiting PhDs via CS, ECE & Psych. We study stats methods, mechanistic model inference (w/ connectomics), sensory coding & more. Reach out! deanp@illinois.edu
19.08.2025 19:45 —
👍 9
🔁 2
💬 0
📌 0
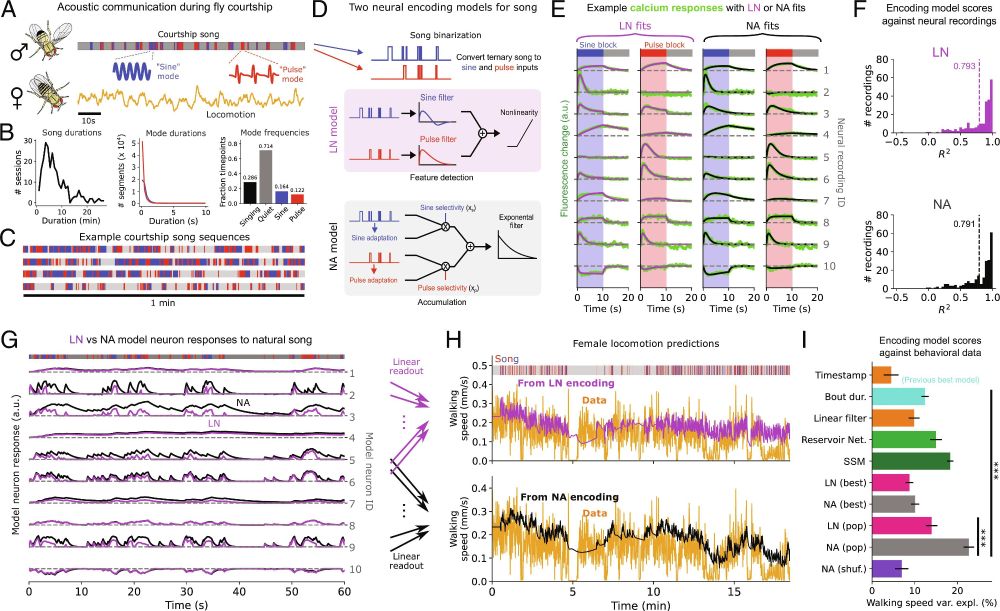
Inferring neural population codes for Drosophila acoustic communication | PNAS
Social communication between animals is often mediated by sequences of acoustic signals,
sometimes spanning long timescales. How auditory neural ci...
How do we get more neuroscience out of our behavioral data? Excited to share new work with C.A.Baker, M.Murthy and @jpillowtime.bsky.social, where we use natural behavior data to extend predictions from neural recordings about population codes for dynamic social stimuli: tinyurl.com/2d3wwfyf
27.05.2025 15:31 —
👍 26
🔁 10
💬 3
📌 0
Someone please do this with a neuroscience foundation model. Start with known computations: reichardt detector in fly, inter-aural delay lines in owl, etc. @tyrellturing.bsky.social ?
16.06.2025 01:06 —
👍 2
🔁 2
💬 0
📌 0
No feedback from cortex. Within the retina yes.
Would you agree the whole point of opsins is to rep. photon count weighted by wavelength?
I want to understand at what point you would say something is a representation. Not sure how to convince.
06.06.2025 12:27 —
👍 0
🔁 0
💬 1
📌 0
Or do you prefer the word encode?
06.06.2025 00:19 —
👍 0
🔁 0
💬 0
📌 0
Photoreceptors definitely represent photons. To hold off on that judgement until we have a complete theory of the brain seems impractical. Similar arguments could be made for other sensory systems, especially early. Are you thinking mainly of higher order areas?
06.06.2025 00:17 —
👍 0
🔁 0
💬 2
📌 0
Believe it a not, a third multisite connectomic project also lost funding. The multi-PI R01 led by @darbly.bsky.social with myself and @bassemh.bsky.social as co-PIs.
28.05.2025 22:46 —
👍 13
🔁 11
💬 3
📌 0
I am confused. Neither is either, except in a very abstract sense. Is this a counter example?
11.04.2025 00:16 —
👍 1
🔁 0
💬 0
📌 0
All digital twins are models, not all models are digital twins. I like the distinction of a model that predicts a real thing, e.g. a specific neuron in a brain. As opposed to a toy model that predicts qualitative features of a class of neurons in general.
09.04.2025 14:16 —
👍 1
🔁 0
💬 1
📌 0
Assuming LDS with synapse count as weight, yes, later…
04.03.2025 02:18 —
👍 1
🔁 0
💬 0
📌 0


