![library(dplyr)
library(gm)
golden <- tribble(
~pitches, ~duration, ~lyric,
"E4", "q", "I’m",
"G4", "q", "done",
"C5", "q", "hid-",
"B4", "q", "-ing",
"D4", "q", "now",
"G4", "q", "I’m",
"E5", "q", "shin-",
"D5", "q", "-ing",
"G4", "q", "like",
"B4", "q", "I’m",
"A5", "q", "born",
"F#5", "q/3*(q/8)", "to",
"G5", "q/3", "be._",
"G5", "h", ""
)
music <-
Music() +
Key(1) +
Tempo(125) +
Meter(2, 4) +
Line(pitches = golden$pitches, durations = golden$duration) +
Tie(13) +
Lyric(golden$lyric[1], 1) + Lyric(golden$lyric[2], 2) +
Lyric(golden$lyric[3], 3) + Lyric(golden$lyric[4], 4) +
Lyric(golden$lyric[5], 5) + Lyric(golden$lyric[6], 6) +
Lyric(golden$lyric[7], 7) + Lyric(golden$lyric[8], 8) +
Lyric(golden$lyric[9], 9) + Lyric(golden$lyric[10], 10) +
Lyric(golden$lyric[11], 11) + Lyric(golden$lyric[12], 12) +
Lyric(golden$lyric[13], 13)
show(music)](https://cdn.bsky.app/img/feed_thumbnail/plain/did:plc:2zcfjzyocp6kapg6jc4eacok/bafkreibtyn3pj42roxnclhguomtm5o4n2rdvgf4m3o4bikcrs3snaez3py@jpeg)
library(dplyr)
library(gm)
golden <- tribble(
~pitches, ~duration, ~lyric,
"E4", "q", "I’m",
"G4", "q", "done",
"C5", "q", "hid-",
"B4", "q", "-ing",
"D4", "q", "now",
"G4", "q", "I’m",
"E5", "q", "shin-",
"D5", "q", "-ing",
"G4", "q", "like",
"B4", "q", "I’m",
"A5", "q", "born",
"F#5", "q/3*(q/8)", "to",
"G5", "q/3", "be._",
"G5", "h", ""
)
music <-
Music() +
Key(1) +
Tempo(125) +
Meter(2, 4) +
Line(pitches = golden$pitches, durations = golden$duration) +
Tie(13) +
Lyric(golden$lyric[1], 1) + Lyric(golden$lyric[2], 2) +
Lyric(golden$lyric[3], 3) + Lyric(golden$lyric[4], 4) +
Lyric(golden$lyric[5], 5) + Lyric(golden$lyric[6], 6) +
Lyric(golden$lyric[7], 7) + Lyric(golden$lyric[8], 8) +
Lyric(golden$lyric[9], 9) + Lyric(golden$lyric[10], 10) +
Lyric(golden$lyric[11], 11) + Lyric(golden$lyric[12], 12) +
Lyric(golden$lyric[13], 13)
show(music)

The first part of the bridge from "Golden" from KPop Demon Hunters
Just discovered the {gm} package, which lets you programmatically create sheet music (and audio!) with #rstats (with MuseScore as the backend) flujoo.github.io/gm/index.html
03.10.2025 17:41 — 👍 82 🔁 22 💬 7 📌 1
The @maprva.org surveillance map, ported to #Rstats using mapgl, osmdata, sf, and dplyr.
gist.github.com/mhpob/17782b...
Not 1:1 in terms of Ultra/Mapbox GL JS -> R, but pretty close!
Original query: overpass-ultra.us#query=url%3A...
cc @mackaszechno.bsky.social @kylewalker.bsky.social
07.10.2025 19:09 — 👍 18 🔁 5 💬 1 📌 1
Are you an RStudio user thinking about trying Positron? We put together some resources to help with the transition.
Learn how to import your keybindings and handle projects while gaining a more flexible environment for both #RStats and Python.
Check out the guide: positron.posit.co/migrate-rstu...
10.09.2025 13:44 — 👍 46 🔁 14 💬 3 📌 0

Positron connected to a not-really-remote remote session inside a Docker container
*Another* blog post about @posit.co's Positron! Its Remote Explorer feature lets you connect to other computers via SSH, including locally-running Docker containers, which means you can write and run code in version-locked #rstats environments! www.andrewheiss.com/blog/2025/07...
05.07.2025 17:20 — 👍 87 🔁 17 💬 9 📌 4
Really enjoyed speaking to Cascadia R Conference today! Materials from my talk are at rfortherestofus.com/cascadia2025. #rstats
21.06.2025 23:07 — 👍 49 🔁 10 💬 3 📌 2
Great. Thanks!
11.06.2025 05:35 — 👍 0 🔁 0 💬 0 📌 0
I am contributing with more Rstudios running than browser tabs 😬 (but I do turn them off during Christmas).
10.06.2025 19:41 — 👍 2 🔁 0 💬 0 📌 0
#rstats
I recently needed a Py lib in a R Shiny app (in a Docker container). Magical to use reticulate and uv to make this work! Later, I restarted the container - no code changes. App crashed. Why? uv had silently installed the latest version of a Py lib. What’s the best practice to prevent this?
10.06.2025 18:22 — 👍 0 🔁 0 💬 1 📌 0

A screenshot of the book chapter

A screenshot of the book chapter

A screenshot of the book chapter

A screenshot of the book chapter
Chapter 7: Coordinate Reference Systems 🧭📐🌐
This chapter explains how to work with coordinate reference systems (CRSs) in R. Learn how to reproject vector and raster data, and understand how CRS choices affect spatial analysis.
🔗 r.geocompx.org/reproj-geo-d...
#rstats #rspatial #geocompx
08.06.2025 14:02 — 👍 12 🔁 4 💬 0 📌 0

shikokuchuo{net}: mirai 2.3.0
Advancing Async Computing in R
We are delighted to announce mirai 2.3.0 for advanced async computing in #RStats!
Mirai allows event-driven async in Shiny & parallel processing in purrr.
This release brings improvements in serialization & distributed computing. Read more from @shikokuchuo.net: shikokuchuo.net/posts/26-mir...
06.06.2025 14:43 — 👍 53 🔁 16 💬 0 📌 0

Posit
We’re happy to announce that we’re supporting Typst by funding one of their full-time engineers.
At Posit, we love @typst.app:
⚡ Make PDFs in milliseconds, not minutes
✨ The power of LaTeX with today's technologies
✍️ Modern typography (including emojis!)
🧠 Clear mental model
So I'm thrilled to announce that we're now supporting its development: posit.co/blog/posit-a...
#rstats
03.06.2025 13:47 — 👍 242 🔁 54 💬 5 📌 11
The @mapbox.com Standard Satellite style gives you a stunning 3D globe out of the box that you can use to build your maps and apps.
If you are an R user, this is all you need to get started:
library(mapgl)
mapboxgl(style = mapbox_style("standard-satellite"))
Try it out!
#rstats
29.05.2025 21:28 — 👍 38 🔁 7 💬 2 📌 0
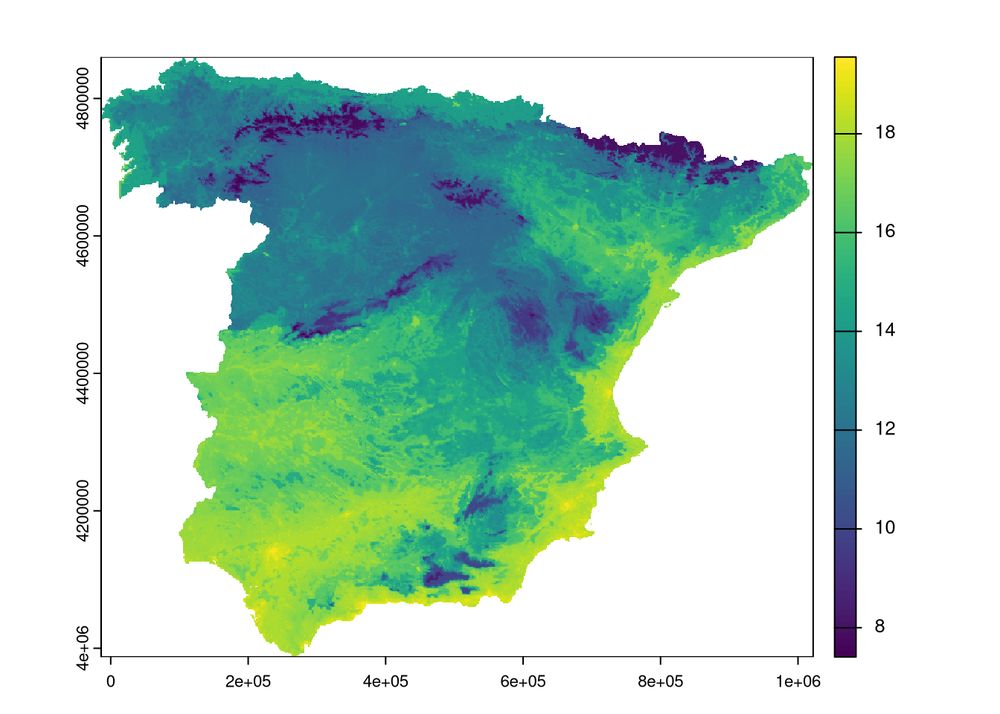
A screenshot from the blog post
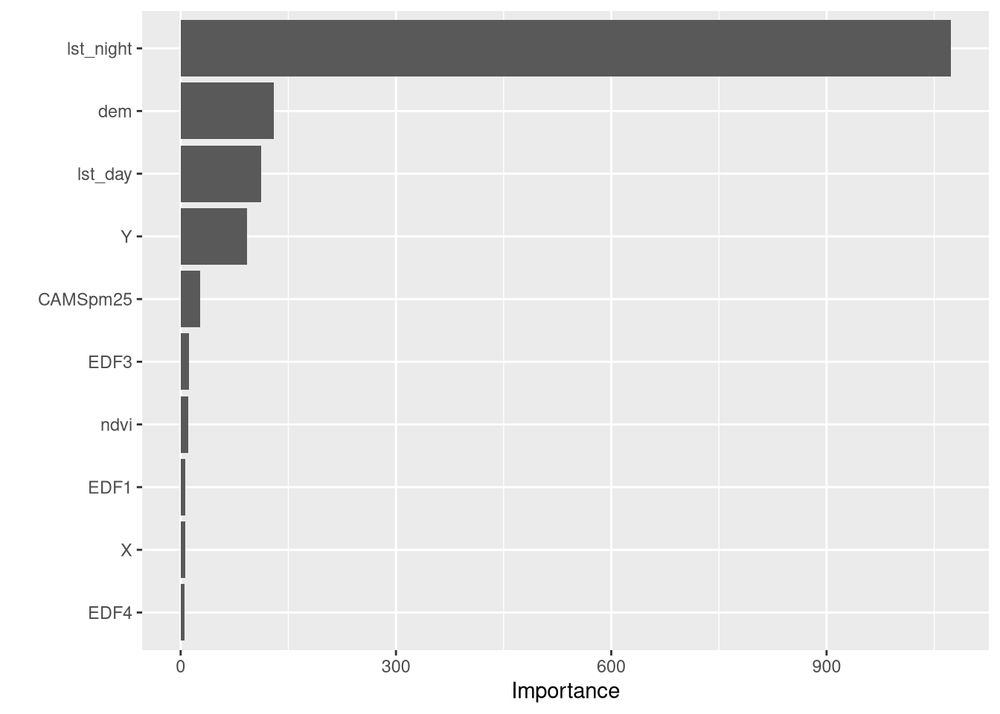
A screenshot from the blog post
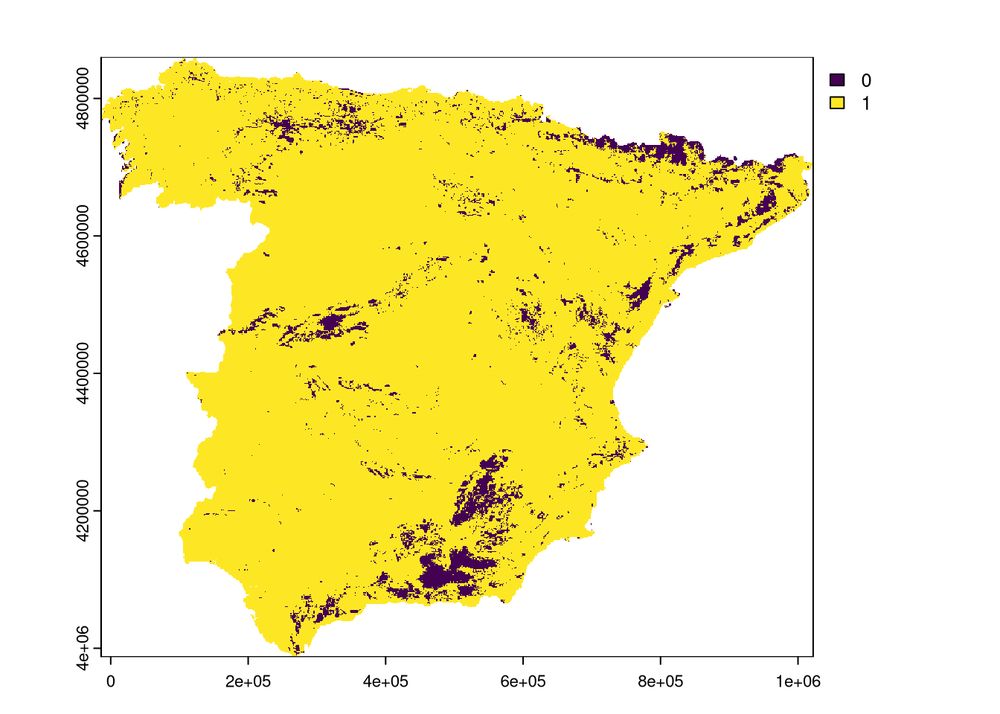
A screenshot from the blog post
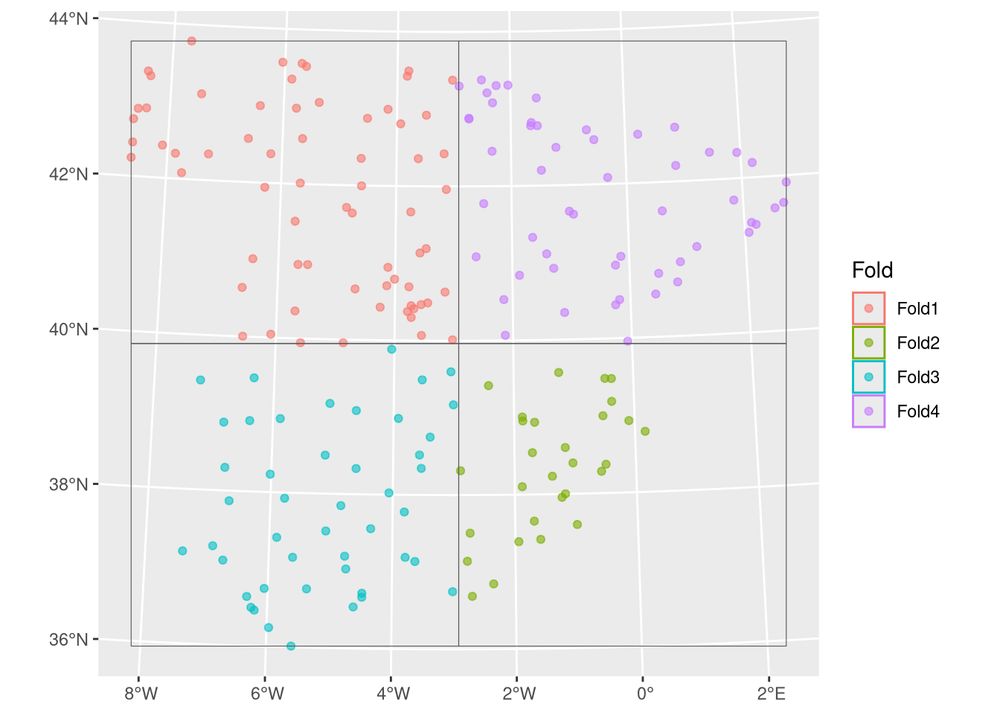
A screenshot from the blog post
New blog post: Spatial Machine Learning with tidymodels 🌍🧠📦
This post shows how to apply the tidymodels framework to spatial data workflows in R. Part 3 in a series about #sml.
🔗 geocompx.org/post/2025/sm...
#rstats #rspatial #tidymodels #gischat
28.05.2025 14:04 — 👍 44 🔁 17 💬 4 📌 0

Fonts in R
Taking control of fonts and text rendering in R can be challenging. This deep-dive teaches you everything (and then some) you need to know to keep your sanity
Mastering typefaces and fonts in #rstats has always been harder than it should.
I have tried to collect much of my relevant knowledge in this deep-dive blog post so you can spend your time picking the right typeface instead of cursing at the computer
12.05.2025 19:03 — 👍 256 🔁 82 💬 12 📌 7
On the blog: side-by-side synced maps, comparison maps in Shiny, and much more in the latest release of {mapgl}.
Read the post: walker-data.com/posts/mapgl-...
#rstats #gis #datascience
30.04.2025 17:14 — 👍 8 🔁 2 💬 0 📌 0
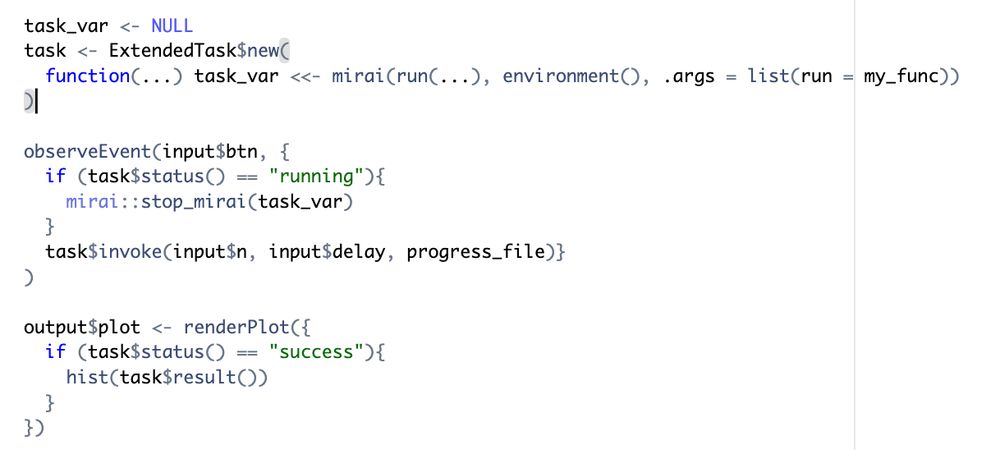
library(shiny)
library(bslib)
library(mirai)
daemons(1)
onStop(function() daemons(0))
ui <- page_fluid(
p("The time is ", textOutput("current_time", inline = TRUE)),
hr(),
numericInput("n", "Sample size (n)", 100),
numericInput("delay", "Seconds to take for plot", 5),
actionButton("btn", "Go"),
textOutput("progress_log"),
plotOutput("plot"),
)
my_func <- function(x, y, file){
writeLines(paste0("Starting..."), file)
for (i in 1:y){
Sys.sleep(1)
writeLines(paste0("Step ", i, " complete"), file)
}
writeLines(paste0("Finished"), file)
runif(x)
}
server <- function(input, output, session) {
progress_file <- tempfile()
output$current_time <- renderText({
invalidateLater(1000)
format(Sys.time(), "%H:%M:%S %p")
})
task_var <- NULL
task <- ExtendedTask$new(
function(...) task_var <<- mirai(run(...), environment(), .args = list(run = my_func))
)
observeEvent(input$btn, {
if (task$status() == "running"){
mirai::stop_mirai(task_var)
}
task$invoke(input$n, input$delay, progress_file)}
)
output$plot <- renderPlot({
if (task$status() == "success"){
hist(task$result())
}
})
progress_reader <- reactiveFileReader(100, session, progress_file,
readFunc = function(file) {
if (file.exists(file)) {
readLines(file)
}
}
)
output$progress_log <- renderPrint({
cat(paste(progress_reader(), collapse = "\n"))
})
}
shinyApp(ui = ui, server = server)
Being able to cancel and restart slow-running jobs in shiny with {mirai} is a bit of a game-changer #rstats Full app in alt text / gist.github.com/simon-smart8... with a method for updating progress too
29.04.2025 15:13 — 👍 11 🔁 5 💬 2 📌 0

It is now possible to easily pass data from and to Python and #RStats by serializing to json (but you can still convert more complex objects using rxp_py2r() and rxp_r2py() which uses {reticulate} under the hood for conversion)
19.04.2025 22:31 — 👍 8 🔁 2 💬 1 📌 0
Yesterday, I was just reading a Hacker News comment about R’s annoying all-or-nothing namespacing, and then R 4.5.0 comes out with `use()`!
Import just what you need:
use(“dplyr”, c(“mutate”, “summarize))
#RStats
11.04.2025 12:22 — 👍 65 🔁 16 💬 5 📌 0

The hex sticker for the chores package: A cartoon illustration of a light orange potato character with rosy cheeks, holding a clipboard with a checklist in one hand and several small cards in the other. The potato is set against a purple hexagon outlined in a lighter orange. The word 'chores' is written diagonally in white in the upper right of the purple hexagon.
Introducing chores, a package that uses LLMs to help with repetitive, hard-to-automate coding tasks!
Manage prompts as markdown, select a chore, and let LLMs handle your tedious #RStats work.
@simonpcouch.com introduces chores and shows how it cuts roxygen2 boilerplate: posit.co/blog/introdu...
08.04.2025 14:03 — 👍 50 🔁 13 💬 2 📌 1

GitHub - USEPA/elevatr: An R package for accessing elevation data
An R package for accessing elevation data. Contribute to USEPA/elevatr development by creating an account on GitHub.
Just wanted to thank all of your #rstats folks that have used and promoted my elevatr 📦(github.com/usepa/elevatr)! It is currently the fourth most starred USEPA repository on GitHub! I am humbled.
And stay tuned for some future updates!
10.01.2025 15:08 — 👍 39 🔁 10 💬 2 📌 1

After an hour of nonsensical discussions with ChatGPT it finally understands how to make me right when I am wrong 😅 #rstats
27.03.2025 18:01 — 👍 0 🔁 0 💬 0 📌 0

Daniël ten Wolde | DuckPGQ: A graph extension supporting SQL/PGQ
Disseminate: The Computer Science Research Podcast · Episode
Disseminate: The Computer Science Research Podcast released the second episode of its new series, “DuckDB in Research”.
In this episode, Daniël ten Wolde talks about his research on integrating SQL/PGQ into DuckDB, and the resulting DuckPGQ community extension.
open.spotify.com/episode/3e3u...
24.03.2025 17:20 — 👍 13 🔁 4 💬 1 📌 0
Mastering Software Development in R by Roger D. Peng, Sean Kross and Brooke Anderson
#RStats
https://bigbookofr.com/chapters/r%20programming.html#mastering-software-development-in-r
21.03.2025 08:28 — 👍 3 🔁 1 💬 0 📌 0
webR is AMAZING!?! I'm running these interactive examples in a revealjs presentation all in the browser! Absolutely endless possibilities being able to write in Svelte, create UI like I normally would but have #rstats running for students to play with. Thats ggplot in the browser omg. #dataviz
19.03.2025 19:14 — 👍 44 🔁 7 💬 4 📌 2

DuckDB got a local UI. Thanks to our friends at MotherDuck, you can now interact with your DuckDB database through an interactive notebook, running on localhost. Read the announcement blog post at duckdb.org/2025/03/12/d...
12.03.2025 13:18 — 👍 171 🔁 47 💬 9 📌 12
@simonpcouch.com is doing some really cool work with LLMs in R!
He's created experimental packages like chores, ensure, and gander to help automate tasks like unit testing and roxygen tags.
Check out his blog post to learn more: www.tidyverse.org/blog/2025/01...
#RStats #LLM
06.03.2025 15:12 — 👍 47 🔁 12 💬 1 📌 0
Air (our extremely fast R formatter!) now has official documentation for both Neovim and Helix, thanks to our awesome community (Tamás Plaszkó, Philippe Massicotte, @mmuecke.bsky.social, and Tymoteusz Makowski)!
Neovim: posit-dev.github.io/air/editor-n...
Helix: posit-dev.github.io/air/editor-h...
04.03.2025 14:24 — 👍 23 🔁 6 💬 0 📌 2

Great Tables plus Python
Creating tables in Python keeps getting better!
With the Great Tables package, you can create professional display tables. We round up some of the updates that you may have missed: posit.co/blog/creatin...
Have questions? Join our Discord: discord.com/invite/skZ5S...
#Python #PythonProgramming
04.03.2025 15:03 — 👍 15 🔁 6 💬 0 📌 0
YouTube video by SSDAN
2025 Webinar 3 Mapping and Spatial Analysis with US Census Data in R with Kyle Walker
@kylewalker.bsky.social's 3rd free workshop on mapping US Census data with R is now on YouTube! Hour 2 is on using his new {mapgl} #RStats 📦 , followed by some advanced workflows in hour 3. I attended live and got a lot of it, highly recommend.
#RSpatial #GIS
04.03.2025 15:59 — 👍 12 🔁 3 💬 1 📌 0
Data Analyst & Science Lead at the Atlas of Living Australia | Evolutionary biologist & social psychologist (PhD) 🧪 | #rstats 📊 | Music enthusiast 🎵
www.daxkellie.com
Opinions are my own, and they do not express those of my employer
🧙♂️✨📊
Independent Data Visualization Designer, Consultant & Instructor | available for projects and workshops
All things data & design with #rstats, #ggplot2, #Figma, #DataWrapper, #Flourish, and more
Co-Founder of the #30DayChartChallenge
Posts about #rstats. Weekly newsletter digest at https://rstats.blaze.email. Maintained by @alastairrushworth.com.
Content strategist and events management. Executive Director for the R Consortium #rstats. www.randomactsoftourism.com All posts are my own.
Bioinformatics Software Engineer. PhD from Schloss Lab at UMich.
https://sovacool.dev
🏃🏻♀️🚴🏻♀️🧗🏻♀️
#python #rstats #nextflow #snakemake
she/her
My views are my own.
Scaling spatial computing at Wherobots, Inc. ApacheArrow PMC, #gischat, #rstats, ex Voltron Data.
Software Engineer, Open Source @posit.co
Full-stack fish ecologist at the UMCES Chesapeake Biological Laboratory, MD, USA. Richmond, VA culture leech living in Eastern Henrico. Small farm dabbler.
https://obrien.page
https://github.com/mhpob
Data visualisation consultant @ www.gpcds.com
All tech is political. 🏳️⚧️
PhD & lic. psychologist. Doing open science at Karolinska Institutet & RISE Research Institutes of Sweden. R package for Rasch psychometrics: pgmj.github.io/easyRasch/
#openscience, #prevention, #psychometrics, #rstats, #photo
I share my experience teaching computational skills and building welcoming communities of practice for programming scientists | rOpenSci Community Manager |
R-Ladies Project Lead | 30 Years in Education | 24 Years as Researcher | Spanglish | #RStats
Har ett garage Sten-Åke Cederhök byggt, men är trots detta blåvit.
Änglatjtöt, Where Angels Dare och hundraårsboken på mitt samvete.
Tillbringat +25 år som statistiker i alla utvecklingsfaser inom det som på svenska kallas Life Science. Bluppar i egen sak
I love posting about #rstats, texas politics, and power markets.
Paleobiologist 🦴, Software Engineer 💻, and Open Scientist 🔍
Postdoctoral Researcher at Syracuse University (He/Him)
#rstats Data Science ⚒️ @ThePCCTC
#RLadies Leadership Team http://rladies.org 💜
former prof at Cal Poly SLO & Emory
blogger & workshop instructor
Am Heimcomputer sitze ich hier und programmieR die Zukunft mir.
PhD Researcher @ Uni Belgrade LIRA Lab | #OpenScience mobilizer | #RStats nerd | distance runner (long enough to reflect on life choices) | #SocialPsyc #HealthPsychology #SciComm | Southeast Europe part of @abrir.bsky.social
orcid.org/0000-0002-0433-0483
Economics and data science | Former academic now working in the tech sector | Views my own | 🇿🇦 in 🇺🇸 | https://grantmcdermott.com/
Prof. Most tweets about R. “Polisci, it’s all about what’s going on.”
http://arelbundock.com
DevRel @observablehq.com, previously teaching faculty (Environmental Data Science) at UC Santa Barbara. PhD, Environmental Science and Management. Data science | R | data visualization | education | art | www.allisonhorst.com
![library(dplyr)
library(gm)
golden <- tribble(
~pitches, ~duration, ~lyric,
"E4", "q", "I’m",
"G4", "q", "done",
"C5", "q", "hid-",
"B4", "q", "-ing",
"D4", "q", "now",
"G4", "q", "I’m",
"E5", "q", "shin-",
"D5", "q", "-ing",
"G4", "q", "like",
"B4", "q", "I’m",
"A5", "q", "born",
"F#5", "q/3*(q/8)", "to",
"G5", "q/3", "be._",
"G5", "h", ""
)
music <-
Music() +
Key(1) +
Tempo(125) +
Meter(2, 4) +
Line(pitches = golden$pitches, durations = golden$duration) +
Tie(13) +
Lyric(golden$lyric[1], 1) + Lyric(golden$lyric[2], 2) +
Lyric(golden$lyric[3], 3) + Lyric(golden$lyric[4], 4) +
Lyric(golden$lyric[5], 5) + Lyric(golden$lyric[6], 6) +
Lyric(golden$lyric[7], 7) + Lyric(golden$lyric[8], 8) +
Lyric(golden$lyric[9], 9) + Lyric(golden$lyric[10], 10) +
Lyric(golden$lyric[11], 11) + Lyric(golden$lyric[12], 12) +
Lyric(golden$lyric[13], 13)
show(music)](https://cdn.bsky.app/img/feed_thumbnail/plain/did:plc:2zcfjzyocp6kapg6jc4eacok/bafkreibtyn3pj42roxnclhguomtm5o4n2rdvgf4m3o4bikcrs3snaez3py@jpeg)


