The 2024 state of the climate report: Perilous times on planet Earth
We are on the brink of an irreversible climate disaster. This is a global emergency beyond any doubt. Much of the very fabric of life on Earth is imperiled
Here is a copy of our most recent state of the climate report. We are on the brink of an irreversible climate disaster. This is a global emergency beyond any doubt. Much of the very fabric of life on Earth is imperiled. . . . . . doi.org/10.1093/bios...
15.07.2025 19:41 —
👍 36
🔁 27
💬 1
📌 4

The men disappeared to El Salvador because of their tattoos
The Trump administration sent Venezuelans to El Salvador’s most infamous prison. Their families are looking for answers.
It seems ICE had a quota for Venezuelan gang members & filled it by picking up people with tattoos. Rose, hummingbird, soccer, mother, Autism awareness. For that people are taken from their families & sent to spend the rest of their lives in horrifying conditions.
www.motherjones.com/politics/202...
27.03.2025 16:40 —
👍 2500
🔁 1059
💬 111
📌 58

Line graph time series of a 12-month running mean of global mean surface temperature anomalies from 1979 through February 2025. There is a long-term increasing trend and large interannual variability on this graph. Anomalies are computed relative to a 1991-2020 baseline. Blue shading is shown for below average anomalies, and red shading is shown for above average anomalies.
The latest 12-month running mean global temperature anomaly... No further explanation needed. 📈
+ More climate indicator visualizations: zacklabe.com/climate-chan...
21.03.2025 01:36 —
👍 250
🔁 81
💬 20
📌 4

So far this year (Jan. 1 - Mar. 12), the average global temperature is 1.67°C over the 1850-1900 IPCC pre-industrial average.
For the year, 2024 was 1.60°C over the pre-industrial average.
Image courtesy of @coderedearth.bsky.social
14.03.2025 13:05 —
👍 125
🔁 37
💬 8
📌 2

Breaking News!
Code UFB!!!
The 365-day running average for global sea-ice extent is once again in "Gobsmacking bananas" territory, registering an average of 20,247,500 km² on March 12, 2025.
How low will it go? The climate 8-ball says: "Sorry, my funding was cut."
13.03.2025 18:42 —
👍 455
🔁 130
💬 14
📌 7
🚨 Catastrophic flooding in Bahia Blanca in Argentina. This is an intensive care ward for babies!!
WAKE THE FUCK UP! #ClimateCrisis
07.03.2025 12:16 —
👍 239
🔁 95
💬 22
📌 8
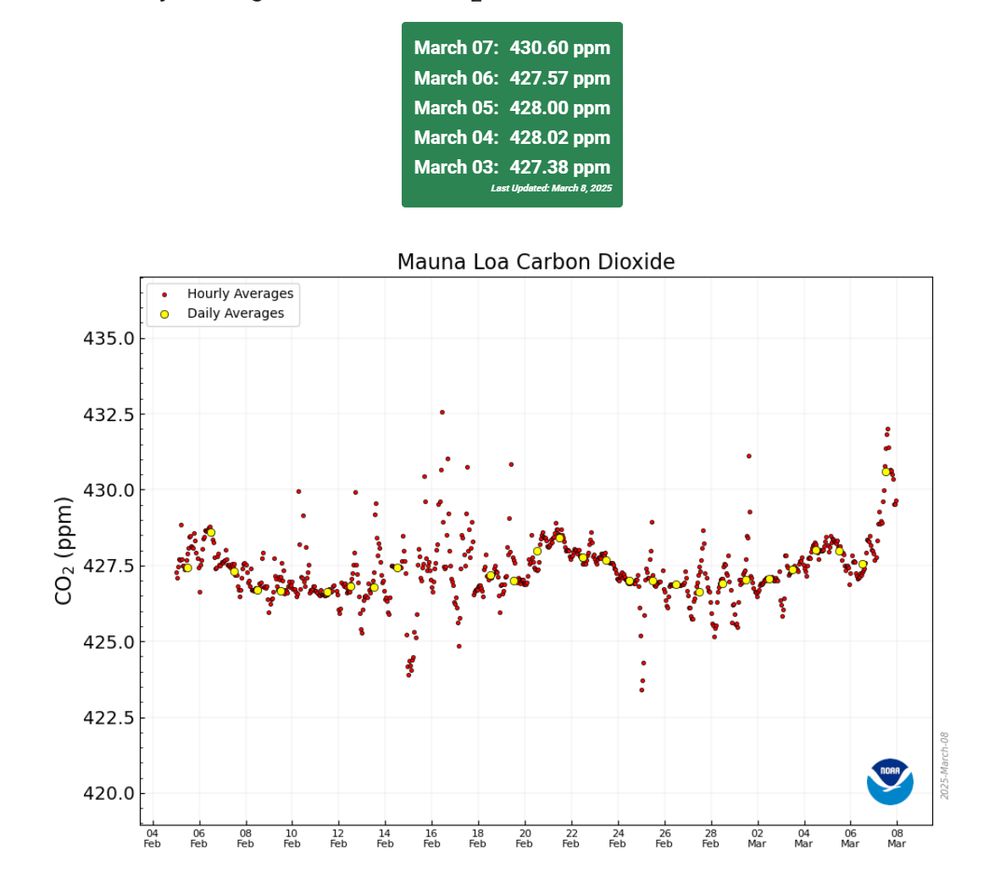
Breaking News!
Code UFB!!!
The daily CO2 number from Mauna Loa exceeded 430 ppm yesterday. This is the first reading above 430 ever recorded.
CO2 levels have not been this high since the Pliocene epoch, 3 to 5 million years ago.
08.03.2025 15:55 —
👍 1039
🔁 471
💬 51
📌 66
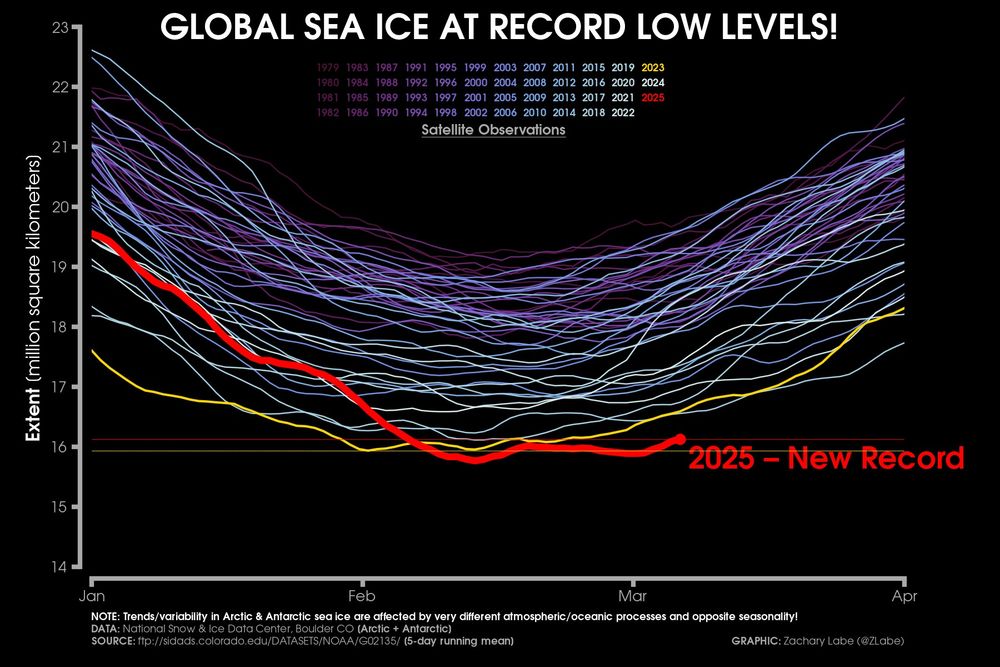
Line graph time series of 2025's daily global sea ice extent in red shading compared to each year from 1979 to 2024 using shades of purple to white for each line for between the months of January and April. The year 2023 is also highlighted in yellow, which was the current absolute record low previously. There is substantial interannual and daily variability.
The extent of sea ice around the world continues to remain the smallest in our satellite observation history for this time of year...
More graphs at zacklabe.com/global-sea-i.... Data from @nsidc.bsky.social.
08.03.2025 21:54 —
👍 333
🔁 136
💬 7
📌 10

If the trend continues, we're about a week away from global sea-ice extent re-entering "Gobsmacking Bananas" territory.
Stay tuned!
07.03.2025 13:30 —
👍 324
🔁 86
💬 19
📌 8
There is a commonplace naivete / ignorance re psychopathy. Underestimating current potential for further harm is enabling harm. We must move toward recognition of some very dark, disturbing, painful realities.
05.03.2025 14:38 —
👍 0
🔁 0
💬 0
📌 0
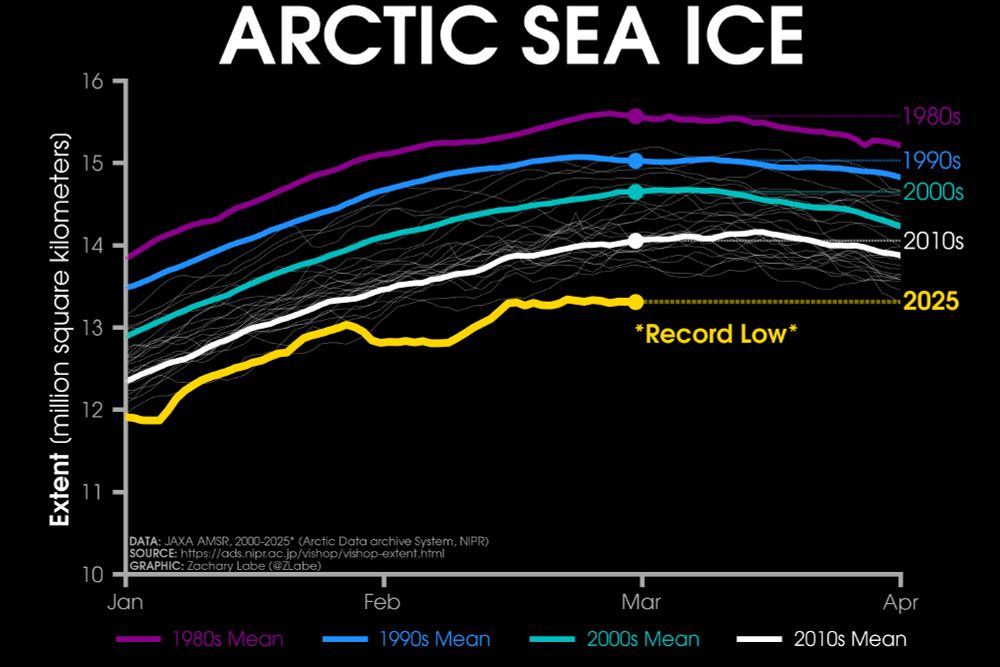
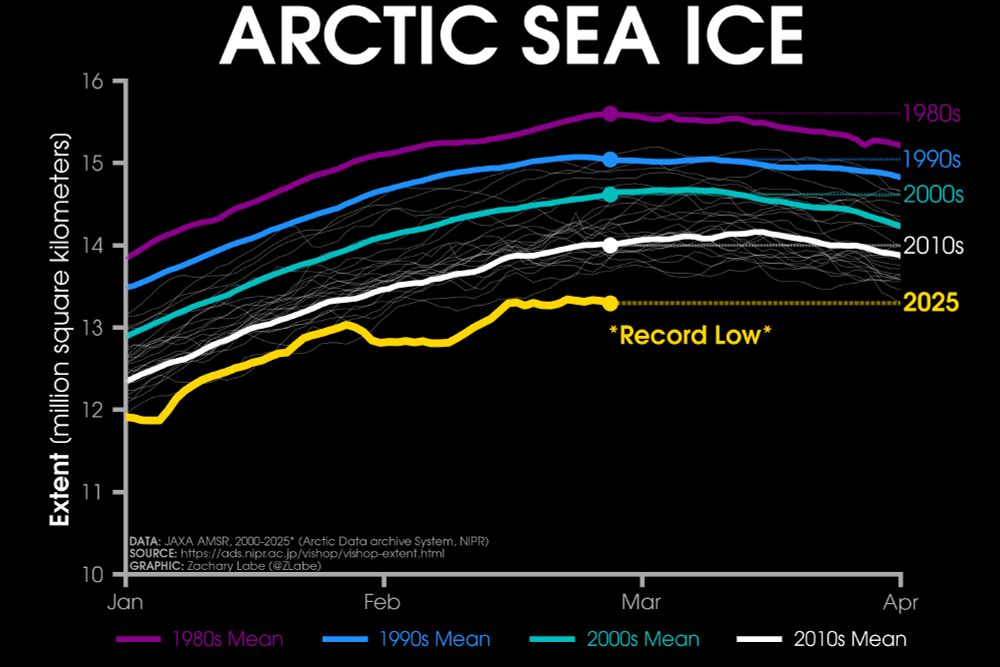
Line graph time series of 2025's daily Arctic sea ice extent compared to decadal averages from the 1980s to the 2010s. The decadal averages are shown with different colored lines with purple for the 1980s, blue for the 1990s, green for the 2000s, and white for the 2010s. Thin white lines are also shown for each year from 2000 to 2024. 2025 is shown with a thick gold line. There is a long-term decreasing trend in ice extent for every day of the year shown on this graph between January and April by looking at the decadal average line positions.
Sunday ice update - #Arctic sea ice extent is currently the lowest on record (JAXA data)
• about 740,000 km² below the 2010s mean
• about 1,340,000 km² below the 2000s mean
• about 1,720,000 km² below the 1990s mean
• about 2,260,000 km² below the 1980s mean
Plots: zacklabe.com/arctic-sea-i... 🌊
03.03.2025 00:38 —
👍 229
🔁 100
💬 8
📌 8
🚨 February 2025 #Arctic sea ice extent was the lowest on record...
This was 1,550,000 km² below the 1981-2010 average. February ice extent is decreasing at about 2.73% per decade. Data: @nsidc.bsky.social (nsidc.org/data/seaice_...).
03.03.2025 13:39 —
👍 191
🔁 78
💬 1
📌 4

1/4 We could crash permanently through the 1.5C guardrail within the next five years, and shatter the 2C limit as soon as 2034. This will almost certainly result in the tipping points for collapse of the Greenland and west Antarctic ice sheets being crossed, ...
26.02.2025 11:35 —
👍 10
🔁 9
💬 2
📌 0

1/2 Do you get it yet? You kill Nature and Nature kills itself, and then it kills us. Nature has no morals, no plan, no shame. Do we want to love each other and so love Nature - or do we want Nature to kill us? That is the question.
28.02.2025 09:00 —
👍 18
🔁 3
💬 1
📌 0
I actually thought people were going to want to address the crisis back then. Then I watched even the climate aware fill driveways w SUVs, frequent flights, and horribly unhealthy animal meat diets. I have been terrified since 2000.
01.03.2025 18:59 —
👍 0
🔁 0
💬 0
📌 0
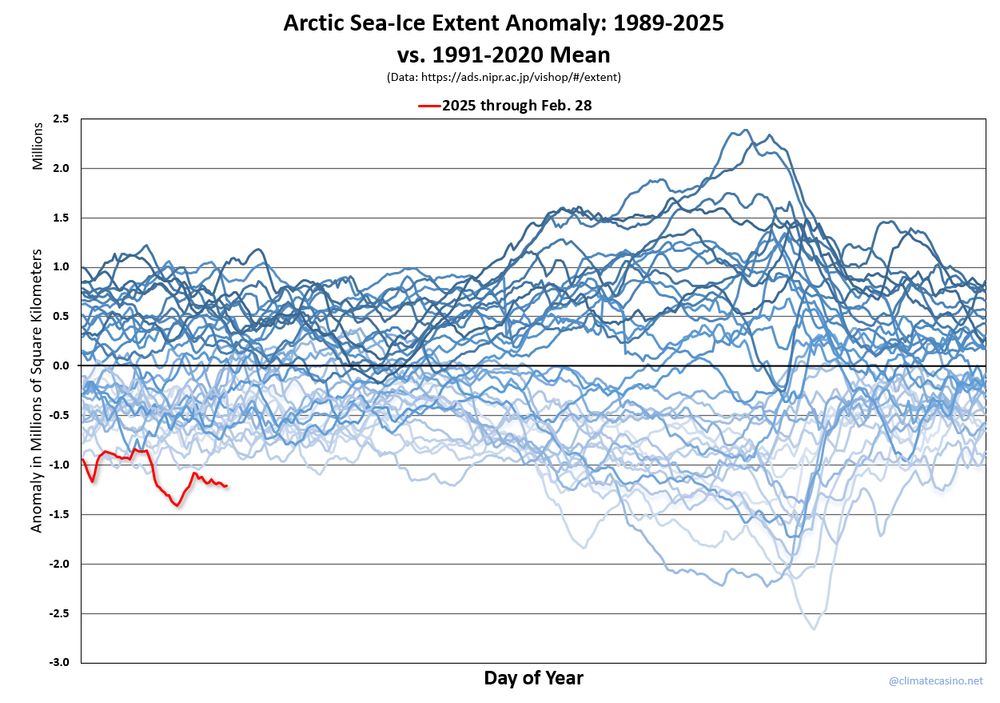
Arctic sea-ice extent anomaly graph for the years 1989-2025, showing that the current year is setting records for lowest sea-ice extent this time of year.
Arctic update for Mar. 1, 2025: Arctic sea-ice extent set a record daily low every day in February and is poised to set an all-time record low maximum this month.
01.03.2025 14:16 —
👍 406
🔁 140
💬 11
📌 17

Breaking News!
Code UFB!!!
Average Arctic sea-ice extent for the month of February, 2025, just set a new record low for the month with an average extent of 13,086,000 km².
This month's record beat the previous record low set in February, 2018, by over 293,000 km².
01.03.2025 15:35 —
👍 184
🔁 71
💬 5
📌 7
In this complex world, science is safety. Dismantle science - eliminate vaccines and environmental protections, ignore the overheating of the Earth - and we stand to lose everything
26.02.2025 23:24 —
👍 626
🔁 128
💬 11
📌 7

Out of ideas. . .
28.02.2025 00:55 —
👍 22
🔁 4
💬 0
📌 0
Line graph time series of 2025's daily Arctic sea ice extent compared to decadal averages from the 1980s to the 2010s. The decadal averages are shown with different colored lines with purple for the 1980s, blue for the 1990s, green for the 2000s, and white for the 2010s. Thin white lines are also shown for each year from 2000 to 2024. 2025 is shown with a thick gold line. There is a long-term decreasing trend in ice extent for every day of the year shown on this graph between January and April by looking at the decadal average line positions.
In the next few days, I will be sharing some of our work that I am most proud of from my time at NOAA/GFDL. But I would also like a little normalcy today on my feed, so here's my go-to sea ice data viz update.
#Arctic sea ice extent still remains the *lowest* on record for the date (JAXA). Not good
01.03.2025 00:00 —
👍 735
🔁 202
💬 15
📌 12

Opinion | Three Former E.P.A. Leaders: You’ll Miss It When It’s Gone
When the next environmental catastrophe arrives, who will be there to deal with the emergency and its aftermath?
"Most of EPA’s work happens behind the scenes, like when one of its enforcement teams raided a warehouse in Colorado full of mislabeled oil barrels that had been prepared for a landfill and discovered they contained nuclear waste..."
www.nytimes.com/2025/02/27/o...
27.02.2025 20:23 —
👍 14097
🔁 5205
💬 413
📌 235
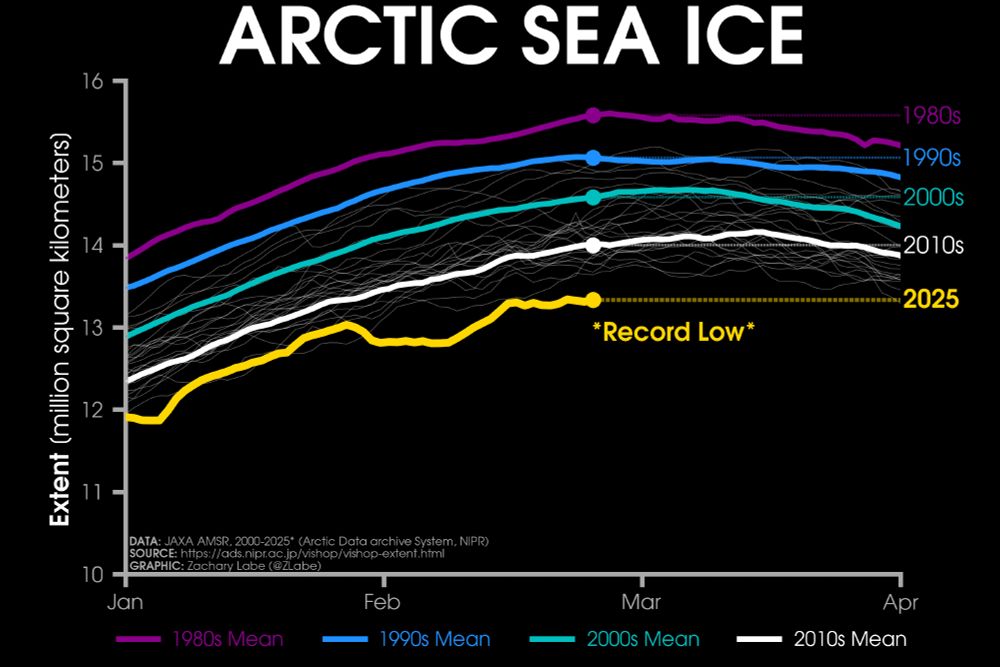
Line graph time series of 2025's daily Arctic sea ice extent compared to decadal averages from the 1980s to the 2010s. The decadal averages are shown with different colored lines with purple for the 1980s, blue for the 1990s, green for the 2000s, and white for the 2010s. Thin white lines are also shown for each year from 2000 to 2024. 2025 is shown with a thick gold line. There is a long-term decreasing trend in ice extent for every day of the year shown on this graph between January and April by looking at the decadal average line positions.
This is still happening. It's your Wednesday ice update - #Arctic sea ice extent is still the *lowest* on record for the date (JAXA)
about 670,000 km² below the 2010s mean
about 2,250,000 km² below the 1980s mean
A winter for the record books in the Arctic. More info zacklabe.com/graduate-res... ⚒️
27.02.2025 00:32 —
👍 262
🔁 103
💬 7
📌 5
The reasons I was given:
-> I did not demonstrate that my work was in the public interest, and my ability, knowledge and/or skills did not match NOAA's needs.
More soon. It will be okay.
27.02.2025 22:37 —
👍 1077
🔁 102
💬 109
📌 15
Last Tuesday, I was set to give a talk on 'climate change in the Northeast' at a retirement home but had to cancel due to hourly job threats.
After nearly two weeks of overwhelming uncertainty, today it happened. I was fired from my dream of working at NOAA. I'm so sorry to everyone also affected.
27.02.2025 22:34 —
👍 7024
🔁 1598
💬 618
📌 176
I am so sorry, Zack. That is so wrong. 💔
27.02.2025 22:43 —
👍 1
🔁 0
💬 0
📌 0
Terrible decision by MSNBC, but so appreciative of all you have given us!
25.02.2025 01:03 —
👍 0
🔁 0
💬 0
📌 0
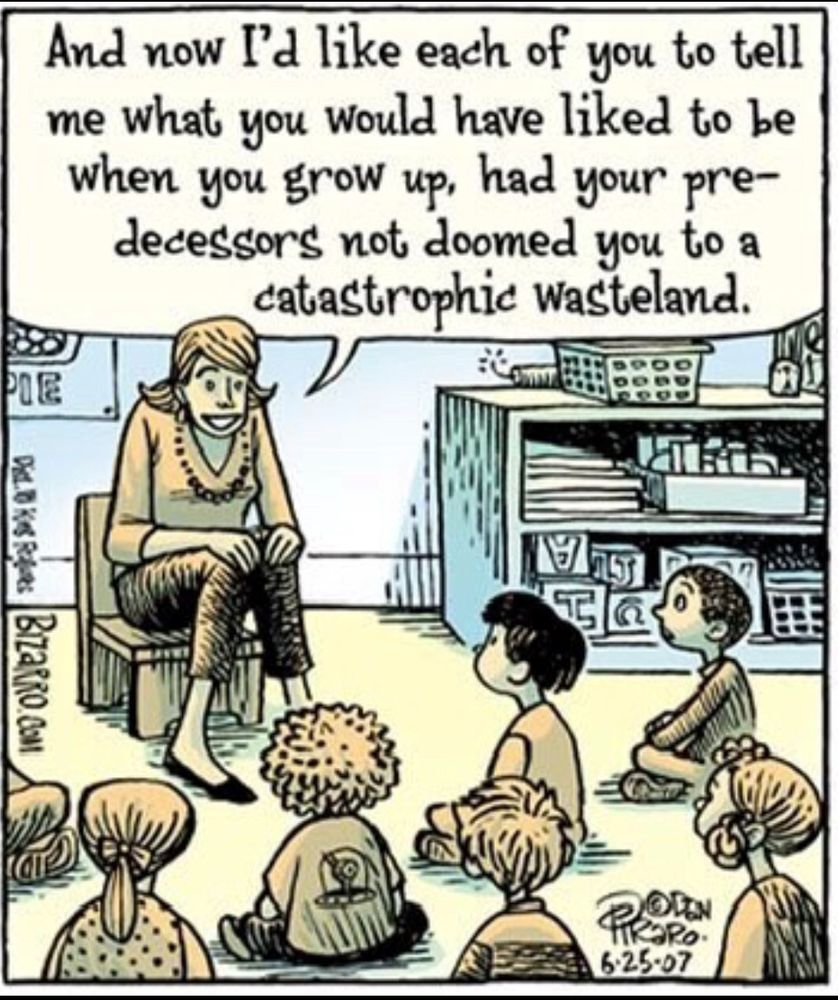
When you grow up. . .
21.02.2025 22:10 —
👍 38
🔁 5
💬 1
📌 1

And, for the record, global sea-ice extent, already at an all-time low for the date, is going the wrong way.
22.02.2025 15:47 —
👍 617
🔁 171
💬 20
📌 15

Another day witnessing the collapse of everything ...
At 21.043°C, the global sea-surface temperature is now ranked officially as "gobsmacking bananas." This temperature is now less than 0.13°C from being in "uncharted territory."
Stay tuned for more bananas!
22.02.2025 15:30 —
👍 426
🔁 134
💬 26
📌 12