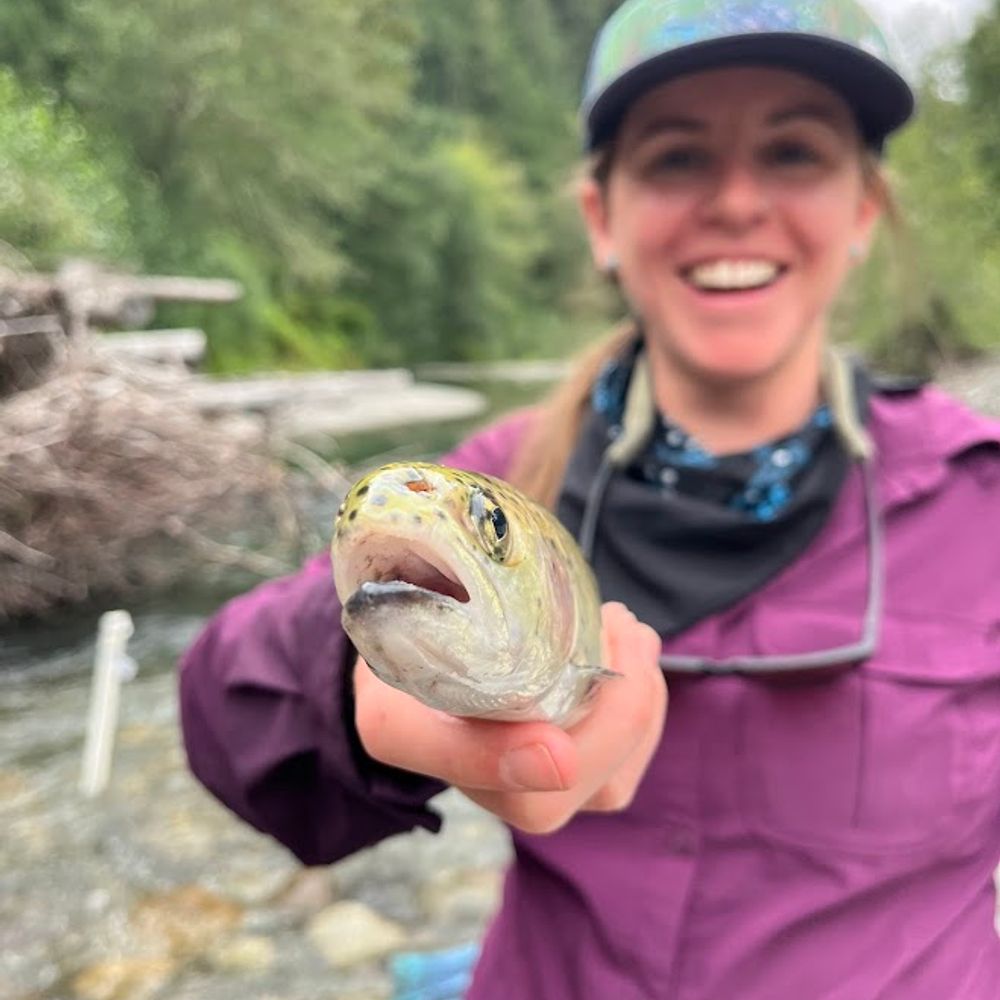
Wild salmon are the Zendayas of the fish world – what that tells us about conservation
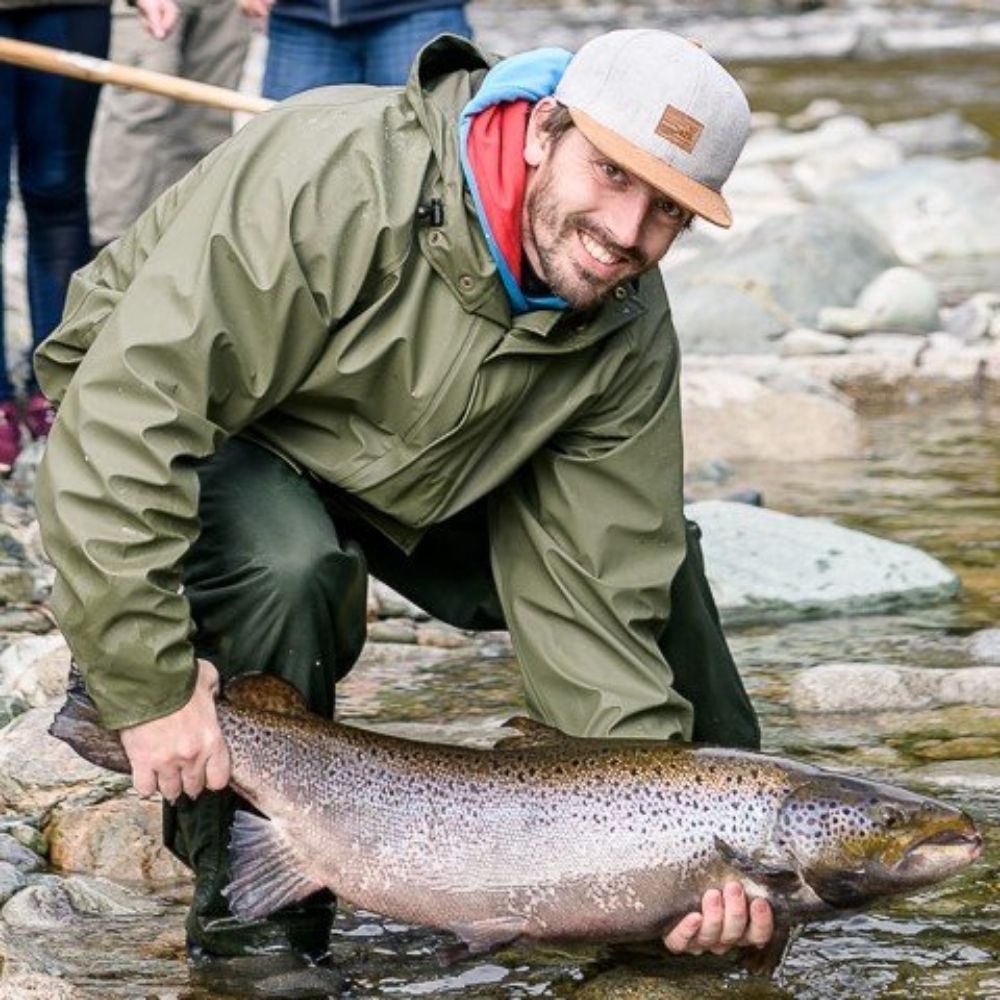
Wild salmon look incredibly symmetrical but captivity makes them more lopsided, stressed and less able to survive in the wild.
New paper on effects of captive rearing of Atlantic salmon on body morphology in context of stocking "Humanity often tries to engineer its way out of environmental crises. But nature isn’t easily replaced. Sometimes, the best solution is to give it the space to recover on its own" bit.ly/4oykzmy
14.08.2025 09:41 — 👍 1 🔁 0 💬 0 📌 0
A fantastic job opportunity for someone to work at the interface between Atlantic salmon habitat modelling and management. Cutting edge research as part of an excellent project team.
28.07.2025 15:38 — 👍 5 🔁 4 💬 0 📌 1
New recommendations for water regulation in England and Wales. In Scotland of course the water industry is publicly owned through Scottish Water.
21.07.2025 06:35 — 👍 3 🔁 0 💬 0 📌 0
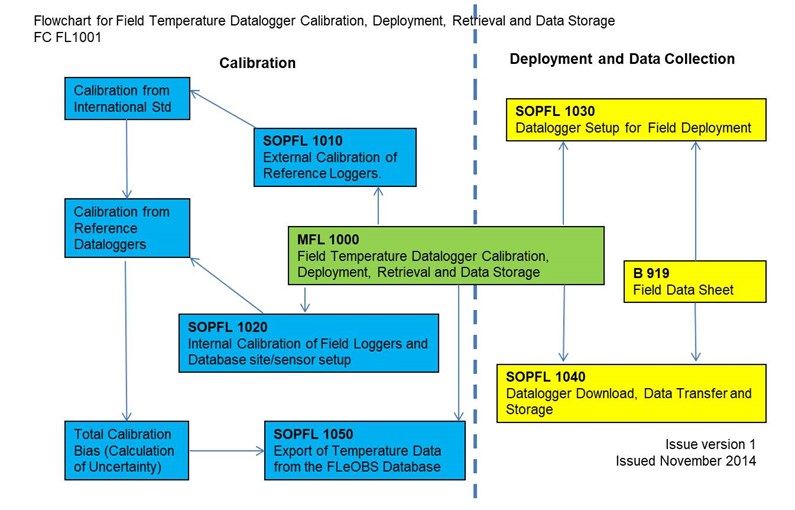
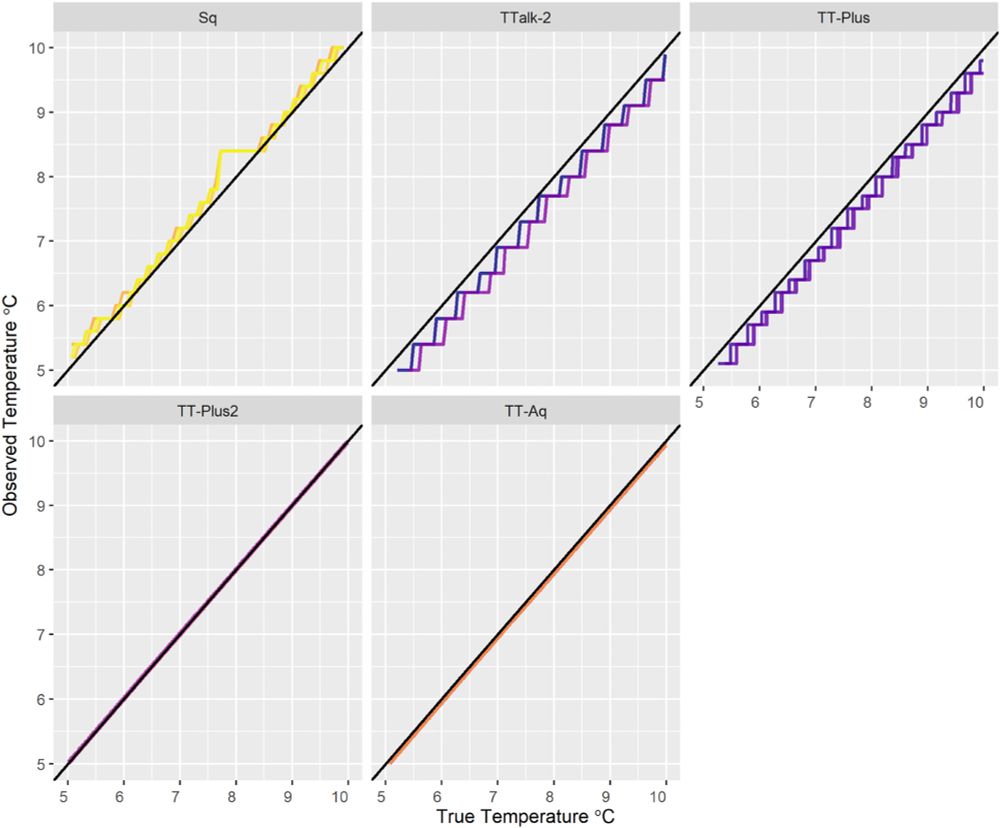
7. Logger calibration & QC are critical for the reliable assessment of river temperature trends. Failure to calibrate loggers can lead to spatio-temporal biases. These principles were core to the establishment of the Scotland River Temperature Monitoring Network #SRTMN www.gov.scot/publications...
19.07.2025 16:34 — 👍 4 🔁 0 💬 0 📌 0
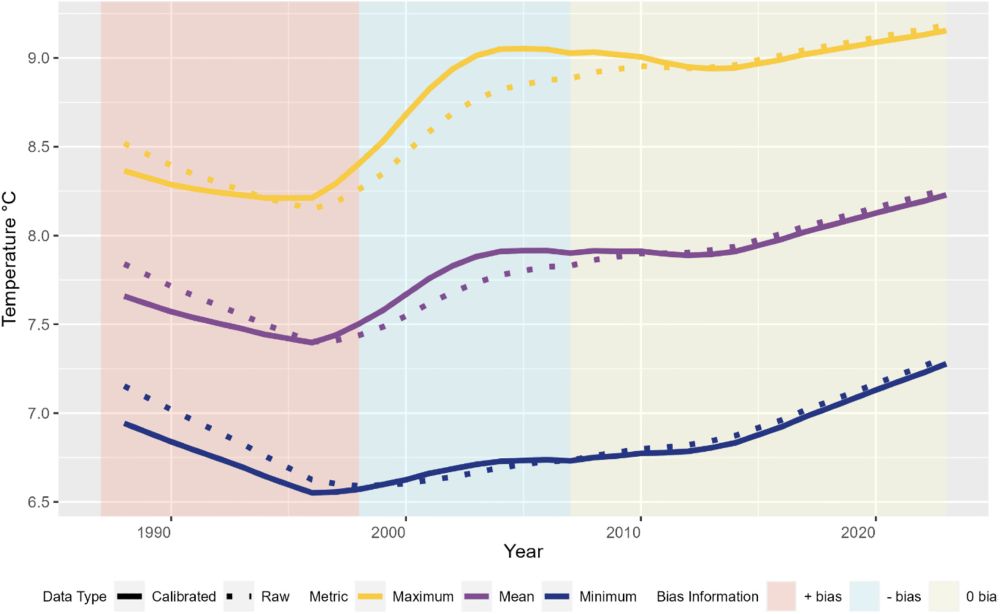
6. In the Girnock Burn, loggers deployed before March 1998 were positively biased while those deployed ca. 1998 to 2007 were negatively biased. The combined effect of these two biases is to moderate the observed temperature trends over the period ca. 1988–2010 relative to the true trend.
19.07.2025 16:34 — 👍 1 🔁 0 💬 1 📌 0
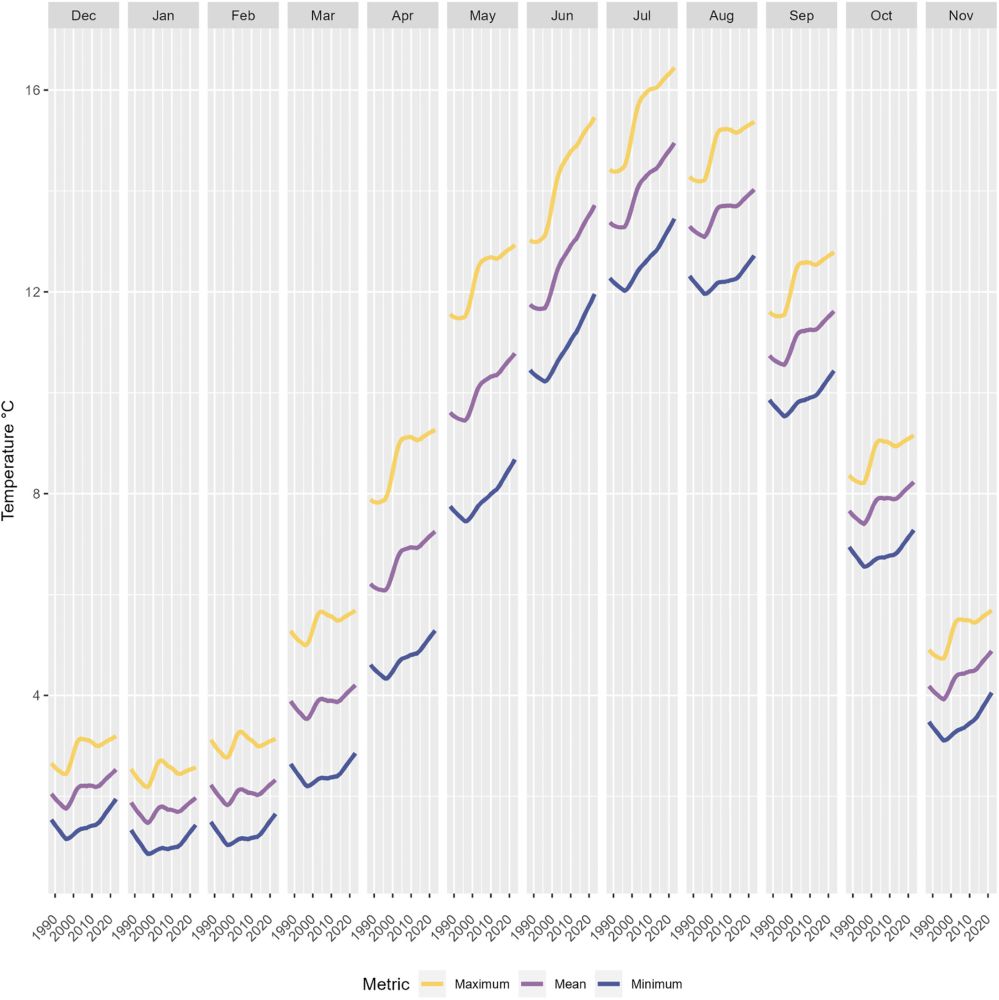
5. Using the bias corrected time-series it was shown that winter temperatures (December–February) were largely stable. Temperatures in other months increased non-linearly. Increases were greatest in summer (June–August) & for daily maximum temperatures, followed by daily mean and minimum.
19.07.2025 16:34 — 👍 1 🔁 0 💬 1 📌 0
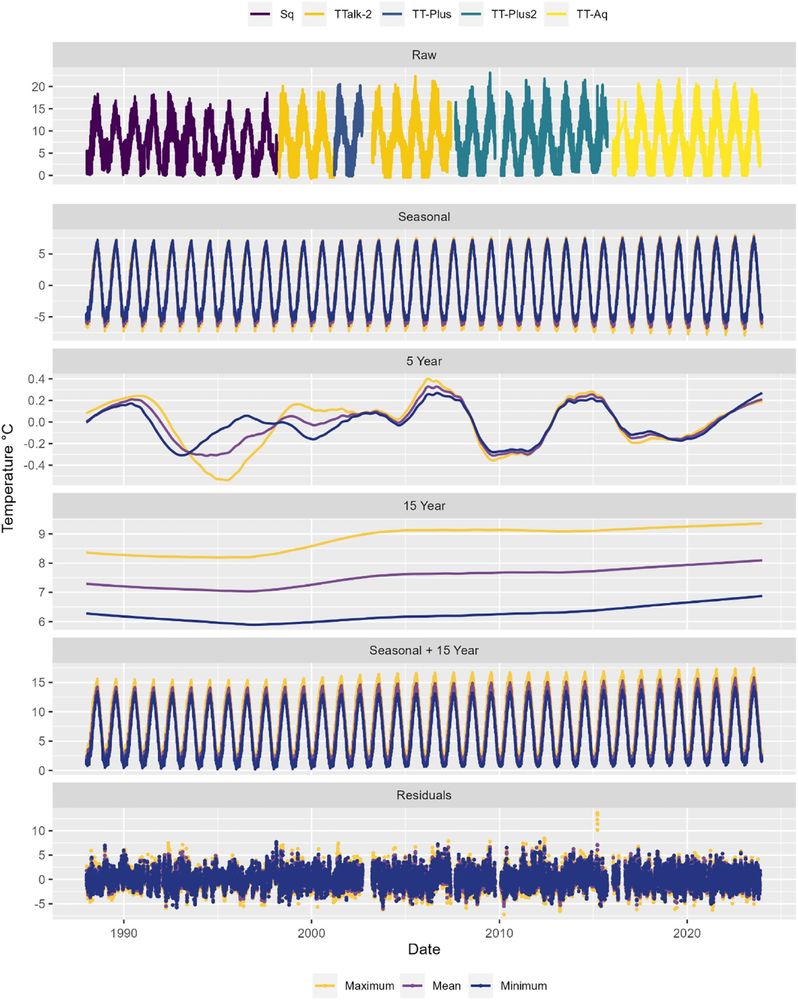
4. We analysed trends in daily mean, max & min river temperature in the #Girnock Burn, the longest continuous sub-daily river temperature dataset in Scotland. Seasonal-Trend decomposition using Loess was undertaken on 1. raw & 2. bias corrected time-series to assess consequences for reported trends.
19.07.2025 16:34 — 👍 0 🔁 0 💬 1 📌 0
3. There are few long-term sub-daily river temperature time-series. These are often comprised of multiple logger/sensor combinations. Technological developments have increased memory, sampling frequency, reporting resolution, and precision of data. However, these changes can also introduce biases
19.07.2025 16:34 — 👍 0 🔁 0 💬 1 📌 0
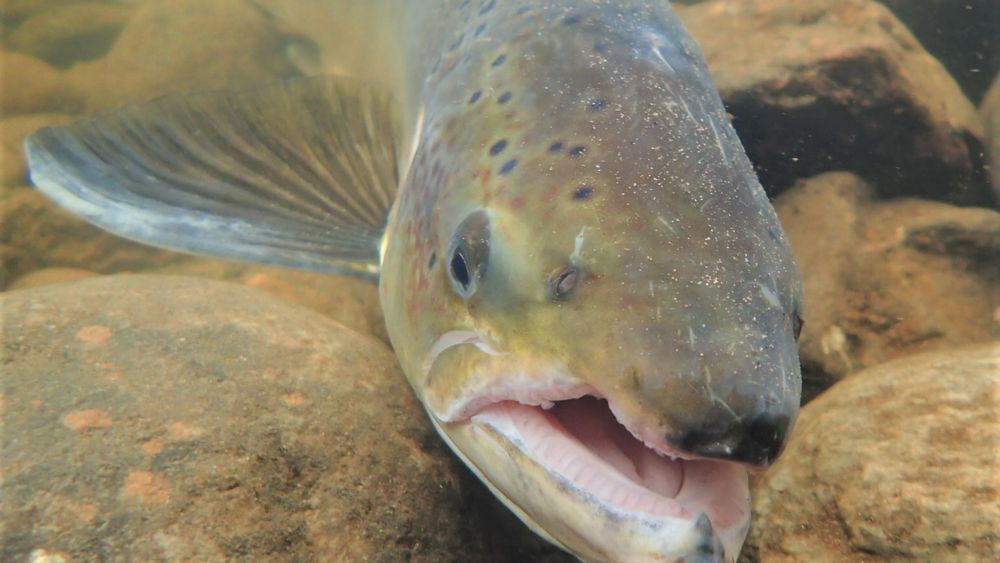
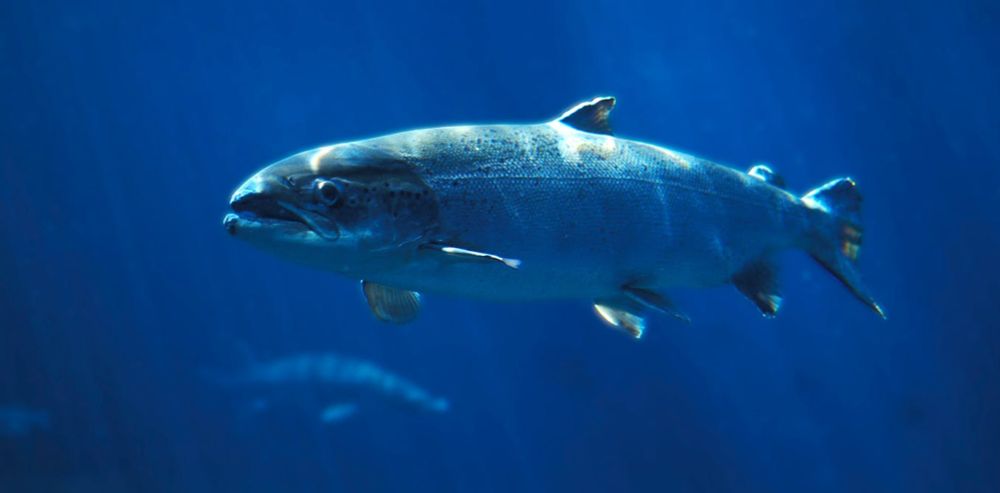
Adult Atlantic salmon in a river
Do poor growth conditions at sea result in salmon returning to rivers to spawn at a younger or older age? New study shows that that rapid growth can lead to later maturation but maturation age can be influenced by shifts in growth during the marine migration link.springer.com/article/10.1... 🐟
22.06.2025 19:53 — 👍 14 🔁 5 💬 0 📌 0
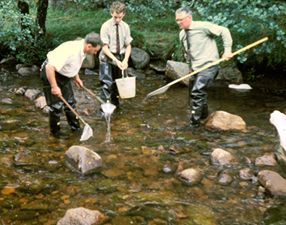
An photograph of early electrofishing in the 1960s by staff from the Freshwater Fisheries Laboratory in the Girnock Burn. Three people are standing in a river wearing waders shirts and ties. Staff variously holding nets, an early example of an anode and a bucket.
13. EF data can provide accurate, catch independent estimates of abundance in rivers, provided they are collected & analysed using appropriate methods. By sampling multiple sites, assessment is possible at any scale. When combined with data on pressures this underpins evidence based management.
13.06.2025 12:06 — 👍 2 🔁 0 💬 0 📌 0
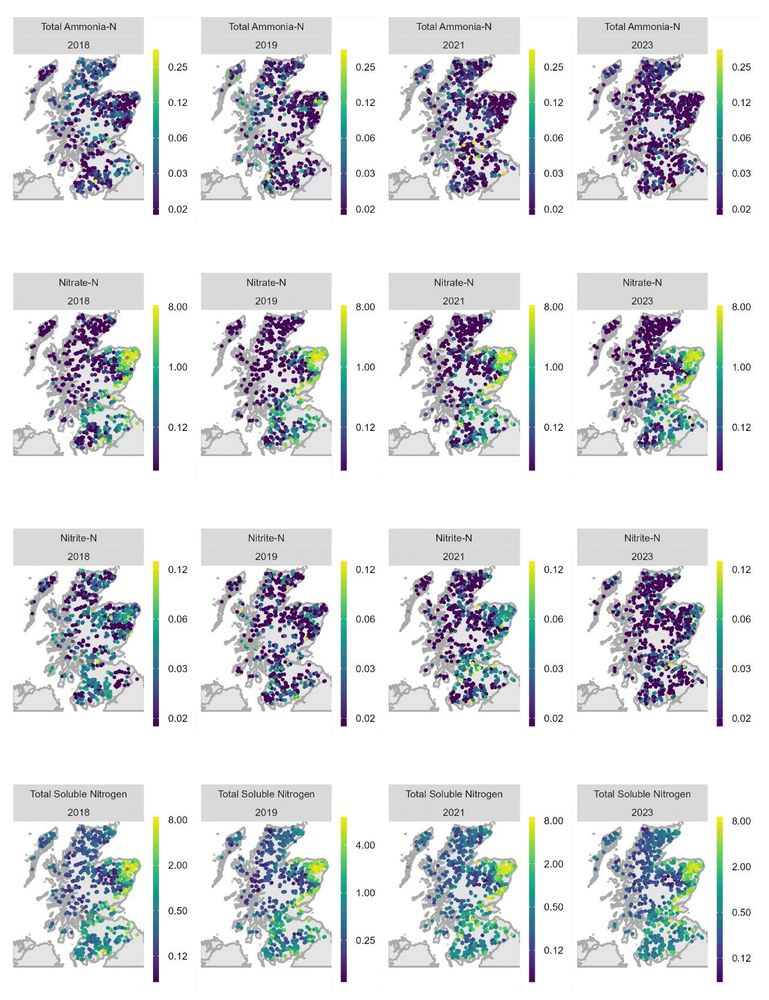
16 panel plot of maps showing site-wise concentrations of ammonia, nitrate, nitrite and total nitrogen. Spatial patterns persist across years suggesting that these data are valuable indicators of inter-site variability and can be used to target management action.
12. NEPS surveys provide an opportunity to characterise environmental pressures at the time of survey, including water quality and introgression. This information can be used to understand the critical thresholds and effect sizes and target management.
13.06.2025 12:06 — 👍 1 🔁 0 💬 1 📌 0
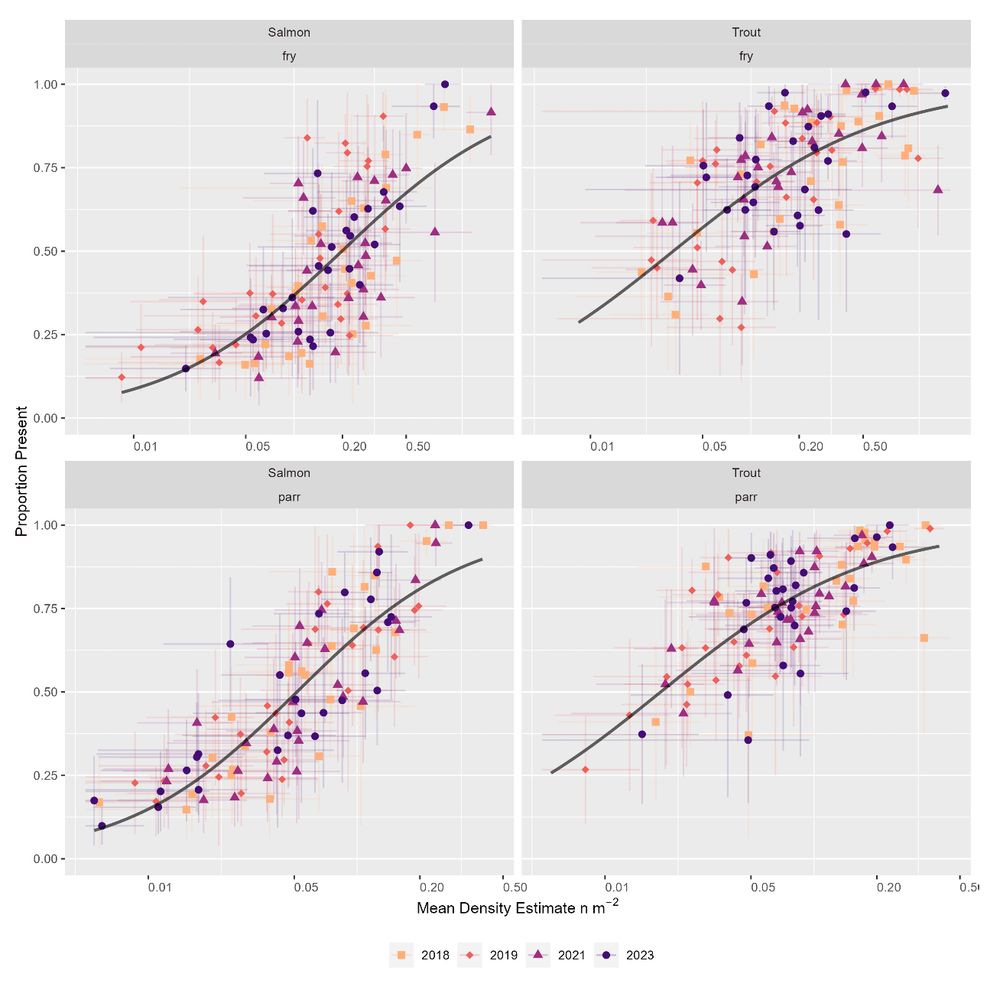
Four panel plot showing relationships between mean regional densities and occupancy (proportion of river network where fish are observed) for salmon and trout, fry and parr.
11. At low population densities, assessment becomes more challenging as the proportion of sites where fish are present decreases & relative inter-site variability in density increases. Occupancy provides another potential metric of population health if a suitable benchmark could be produced.
13.06.2025 12:06 — 👍 1 🔁 0 💬 1 📌 0
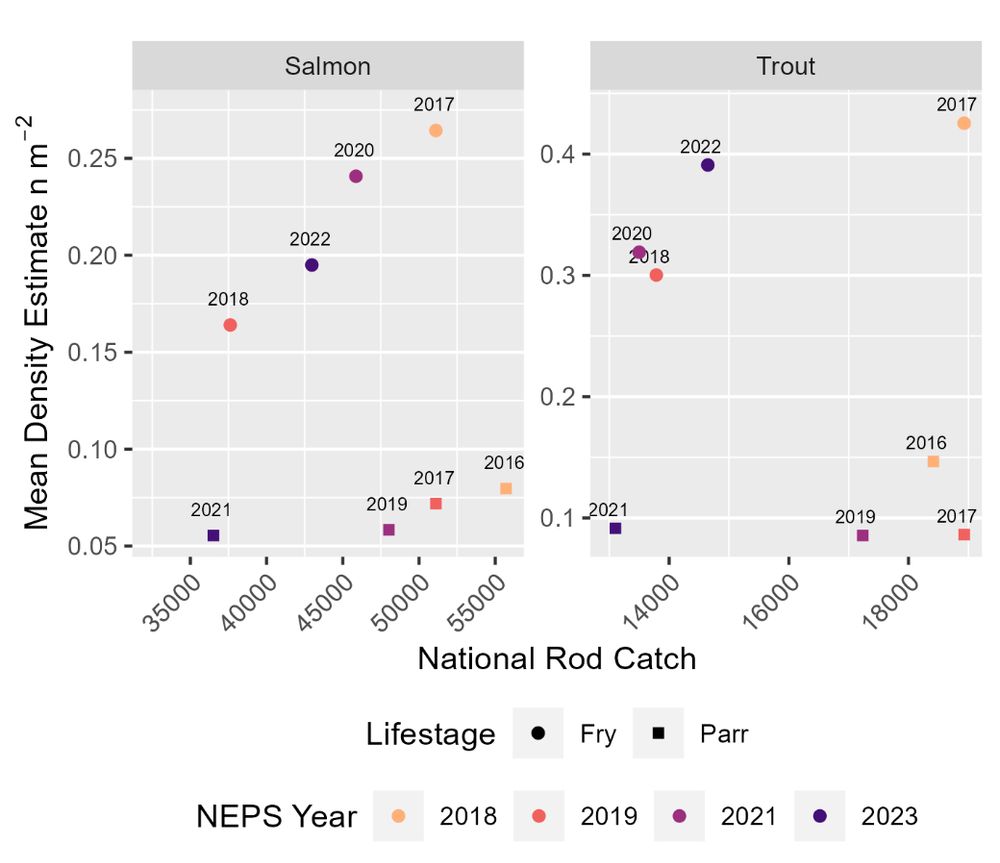
Two panel plot showing relationships between rod catches, as an indicator of adult abundance (x axis), and national estimates of mean juvenile densities (y axis) for Salmon and Trout, fry and parr. Symbols separate lifestages, colours indicate NEPS survey years. 2021 is an outlier due to the effects of covid lock downs on angling effort and thus catches.
10. At the national scale salmon fry densities varied among years with rod catch (proxy of adult abundance). This was less clear for salmon parr, due to the effects of covid lockdowns on rod catches in 2021. Trout fry densities exhibited signs of density dependence in relation to sea trout catches
13.06.2025 12:06 — 👍 1 🔁 0 💬 1 📌 0
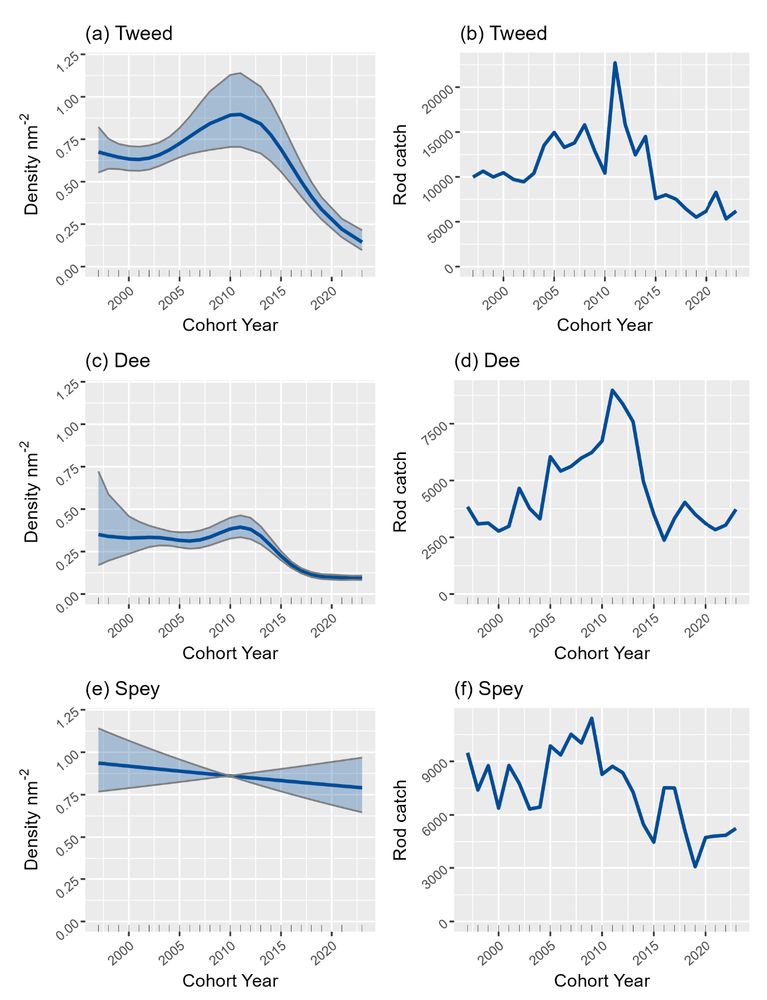
Six panel plot with 3 rows and two columns. Left column shows the modelled partial effect of year on juvenile densities. Right column shows rod catches. Three rows show data for the Tweed, Dee and Spey. There are no significant trends in juvenile abundance on the Spey despite declines in rod catch, suggesting juvenile habitats remain saturated.
9. Where habitats are saturated with juveniles (NEPS Grade 1) densities would be expected to remain fairly constant over time, independent of adult numbers due to density dependent competition (see Spey below). This was explored for a small number of catchments with longer-term multi-pass EF data.
13.06.2025 12:06 — 👍 1 🔁 0 💬 1 📌 0
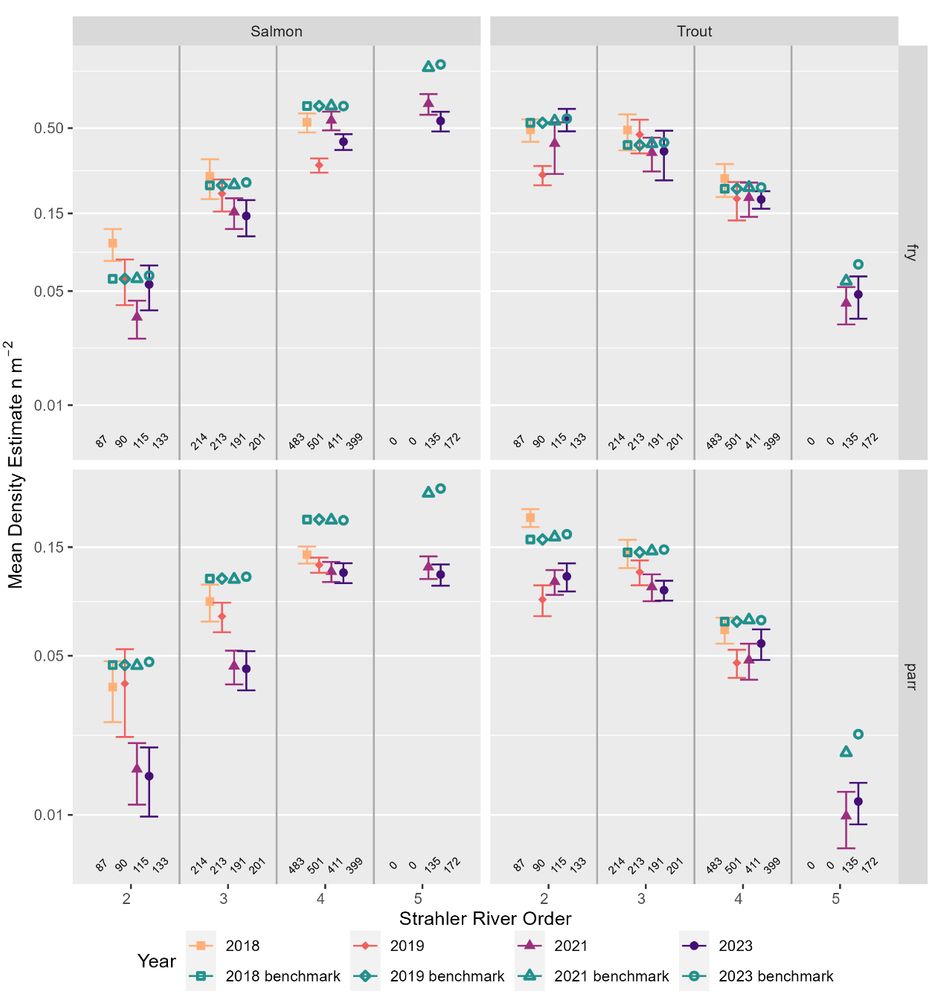
Four panel plot with Strahler river order on the x axis and mean density on the y axis. Separate plots are shown for salmon and trout, fry and parr.
8. At a national scale, Atlantic salmon densities increased with increasing Strahler river order (bigger rivers), while trout densities declined. In general, spatial patterns persisted between years shifting up or down depending on overall abundance.
13.06.2025 12:06 — 👍 1 🔁 0 💬 1 📌 0
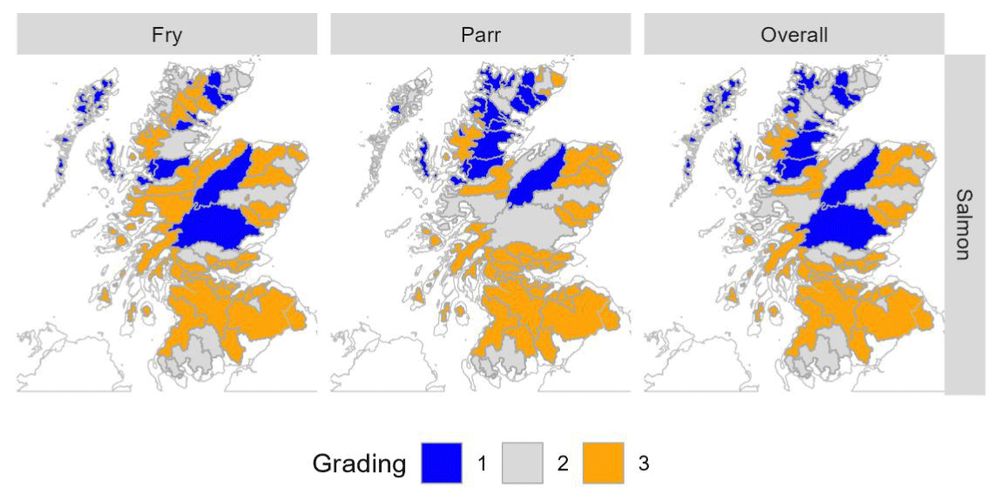
3-panel plot of maps showing regional performance in salmon stocks indicating by different shades of colour. Assessments were undertaken for fry and parr and then combined (overall).
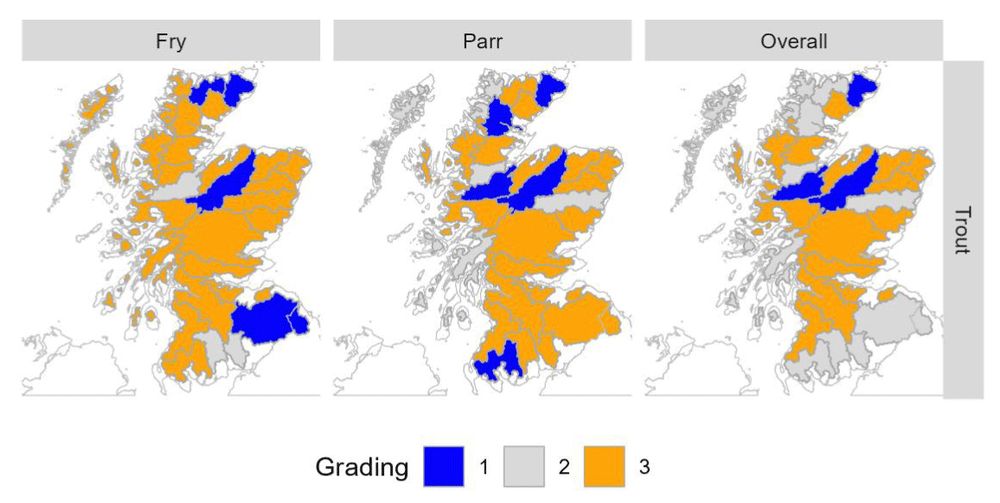
3-panel plot of maps showing regional performance in trout stocks indicating by different shades of colour. Assessments were undertaken for fry and parr and then combined (overall).
7. Within the overall pattern of poor performance there was substantial regional variability. Fish stocks were assigned a Grade of 1-3 (1 healthy, 3 unhealthy) depending on performance against benchmark & uncertainty in abundance. Separate assessments were undertaken for each species & age class.
13.06.2025 12:06 — 👍 1 🔁 0 💬 1 📌 0
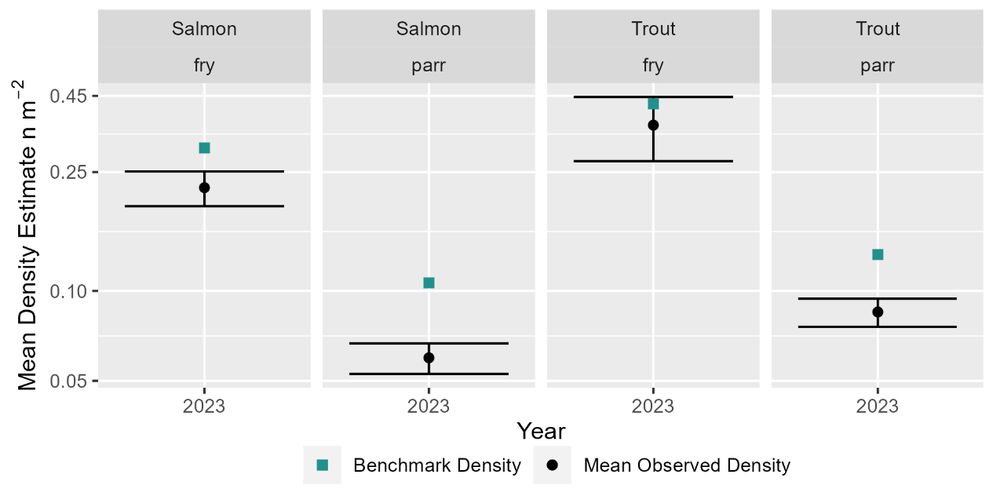
4 panel plot comparing national salmon and trout, fry and parr densities to the benchmark (densities expected if juvenile populations were fully occupying available habitat).
6. At a national scale salmon fry (0 year old) & parr (>0 year old) juvenile densities were substantially & significantly below the benchmark indicating that available habitats are no longer fully occupied. Trout fry & parr densities were also below the benchmark, but not significantly for fry.
13.06.2025 12:06 — 👍 1 🔁 0 💬 1 📌 0
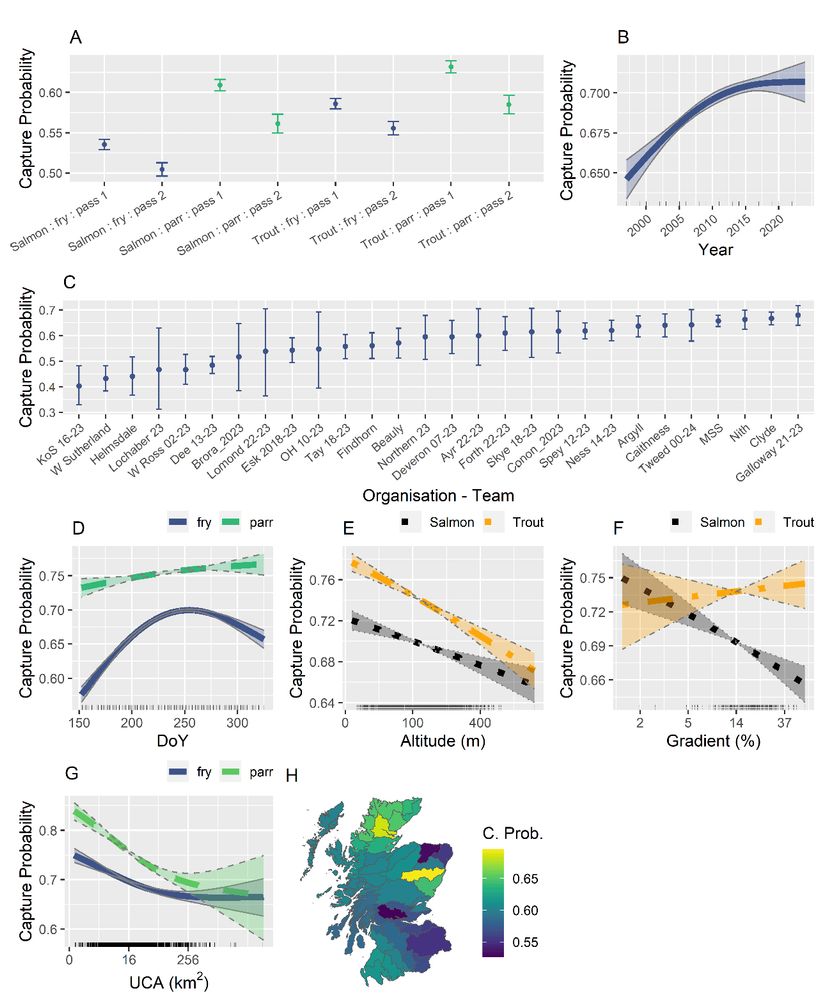
Multi-panel plot showing how capture probability varies with species, lifestage, pass, organisation, habitat, region and time.
5. The NEPS 2023 report updates existing capture probability (P) models for Scotland, illustrating that P varies with species, lifestage, pass, organisation, habitat, day of the year & region. Importantly there are also long-term trends in P emphasising the need for continued multi-pass data.
13.06.2025 12:06 — 👍 1 🔁 0 💬 1 📌 0
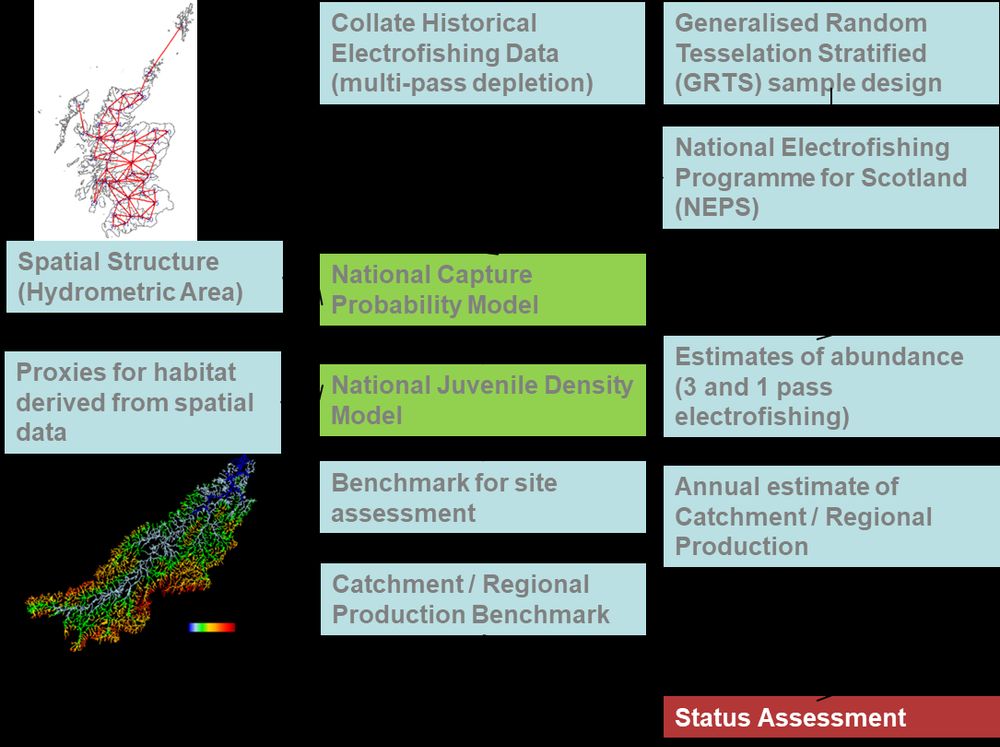
Schematic showing how spatial data, historical electrofishing data and the NEPS survey are brought together to assess the status (health) of salmon and trout.
4. NEPS consists of an ecosystem of spatial data, standardised sampling methods , statistical models (capture probability and expected densities) and a GRTS statistical survey. These are brought together to assess status & trends in Atlantic salmon and brown trout populations in Scotland's rivers.
13.06.2025 12:06 — 👍 1 🔁 0 💬 1 📌 0
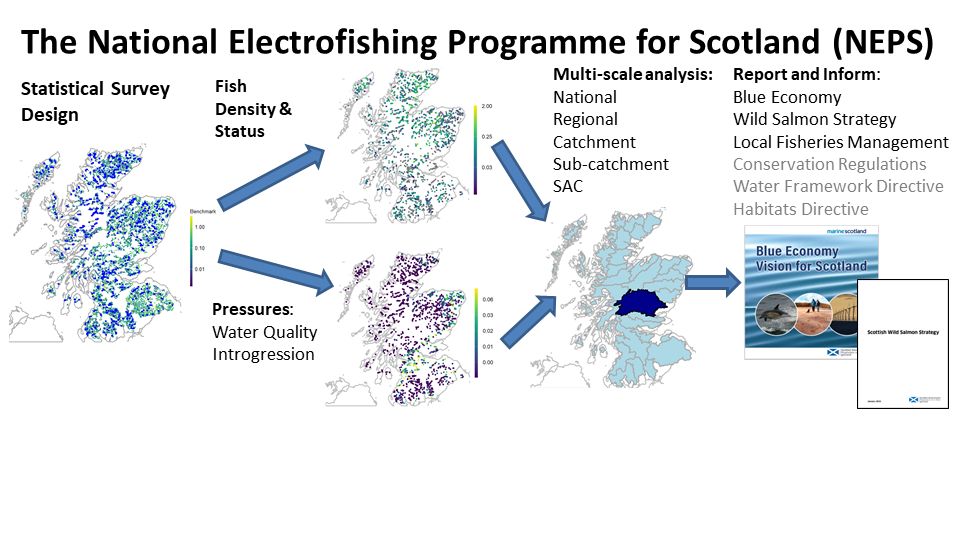
4 panel schematic showing how electrofishing data can be used to provide information on fish abundance and status at a range of spatial scales from individual sites to whole countries, informing policy and management decisions. Figure taken from NEPS 2021 report.
3. Electrofishing (EF) data are commonly collected & accurate sources of information on ecosystem health, status & trends in diadromous fish. When collected to consistent protocols, with an appropriate survey, these data can provide reliable assessments across scales from sites to whole countries.
13.06.2025 12:06 — 👍 1 🔁 0 💬 1 📌 0
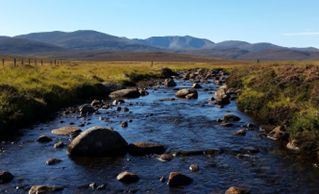
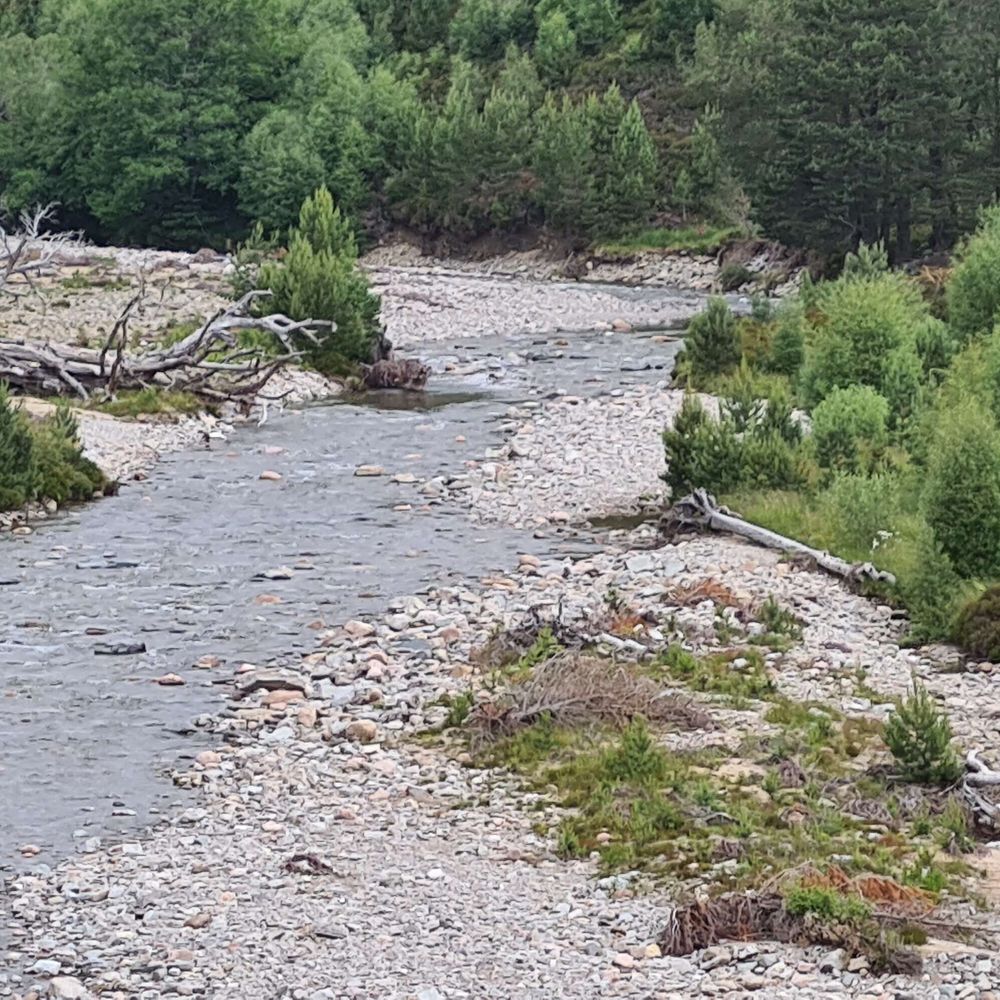
Photograph of upland salmon stream in Scotland looking up onto Loch Nagar mountain range.
2. Evidence based freshwater fisheries management requires a reliable understanding of the processes regulating fish populations, the status (health) of populations across a range of spatial scales, the environmental pressures acting on them and the efficacy of management actions.
13.06.2025 12:06 — 👍 1 🔁 0 💬 1 📌 0
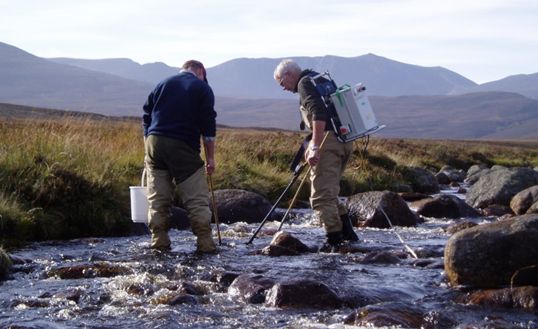
Two people sampling fish in a small upland stream in Scotland using a traditional electrofishing backpack. One person carries the equipment and holds an anode and a hand net. The second person carries a net and bucket to help capture and hold fish that are caught.
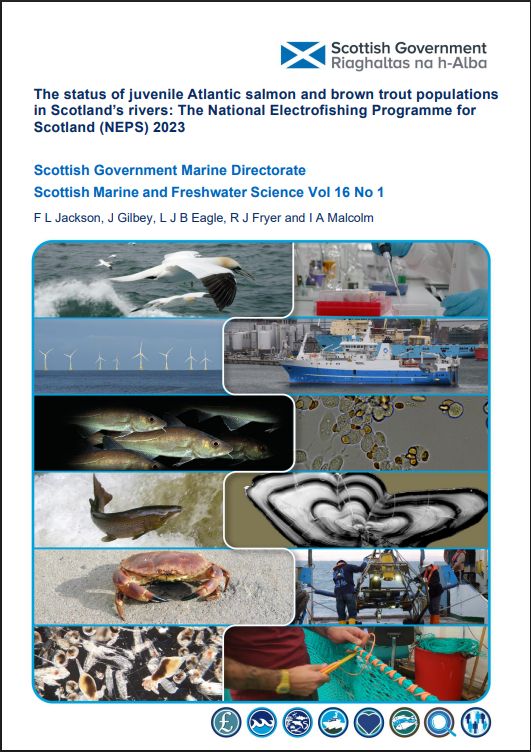
Image showing front cover of the NEPS 2023 report
1. Are you interested in assessing the status of Atlantic #salmon and brown #trout populations using electrofishing data? If so then this 🧵 is likely to be of interest to you. The latest report from the National Electrofishing Programme for Scotland #NEPS was published this week bit.ly/4jNrXH6 🧪🌎
13.06.2025 12:06 — 👍 11 🔁 2 💬 1 📌 0
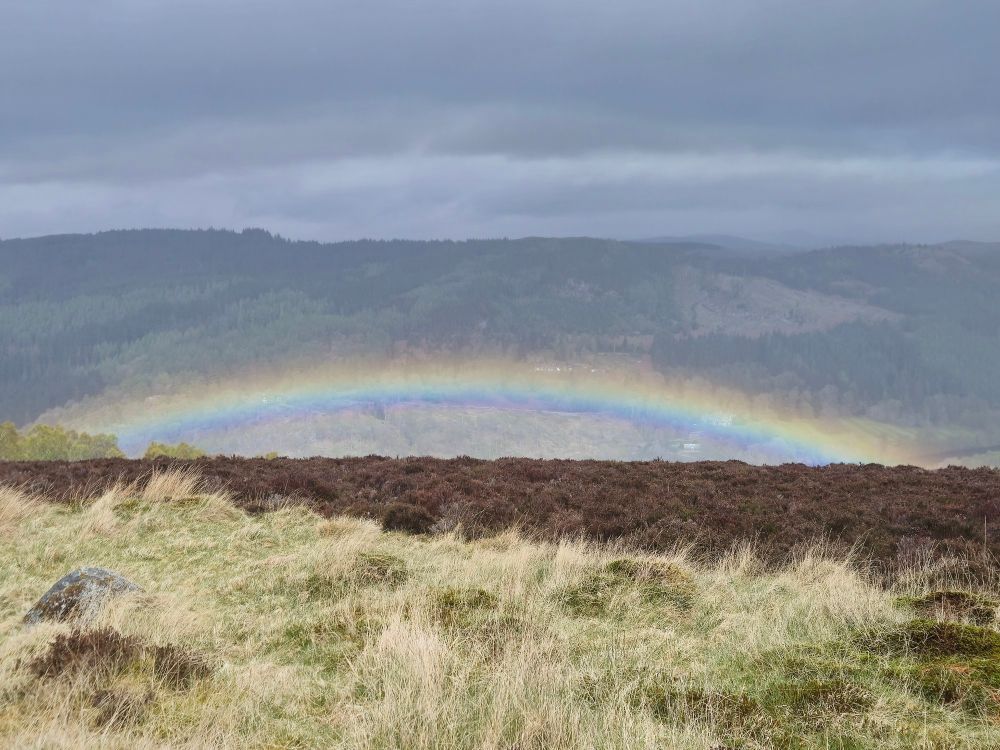
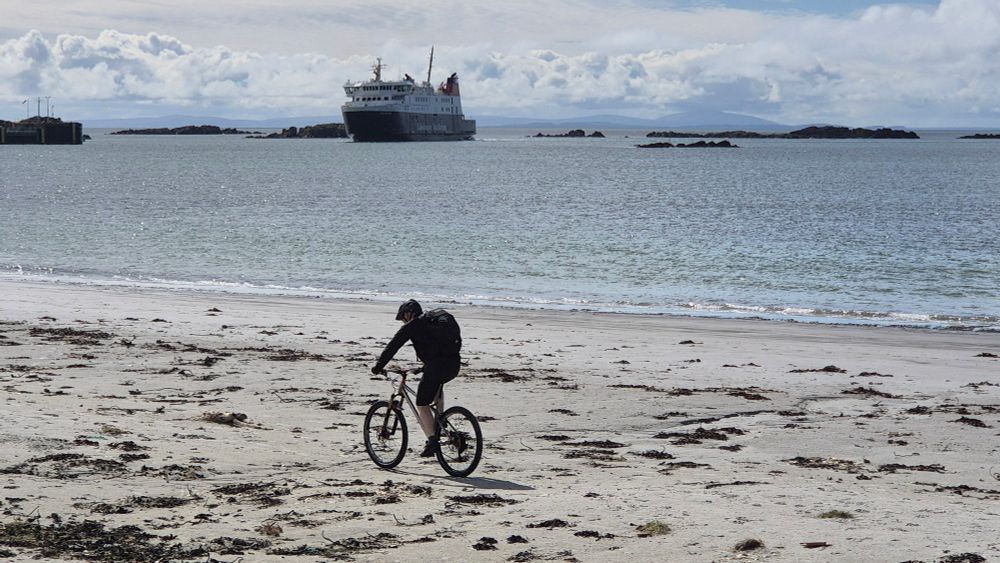
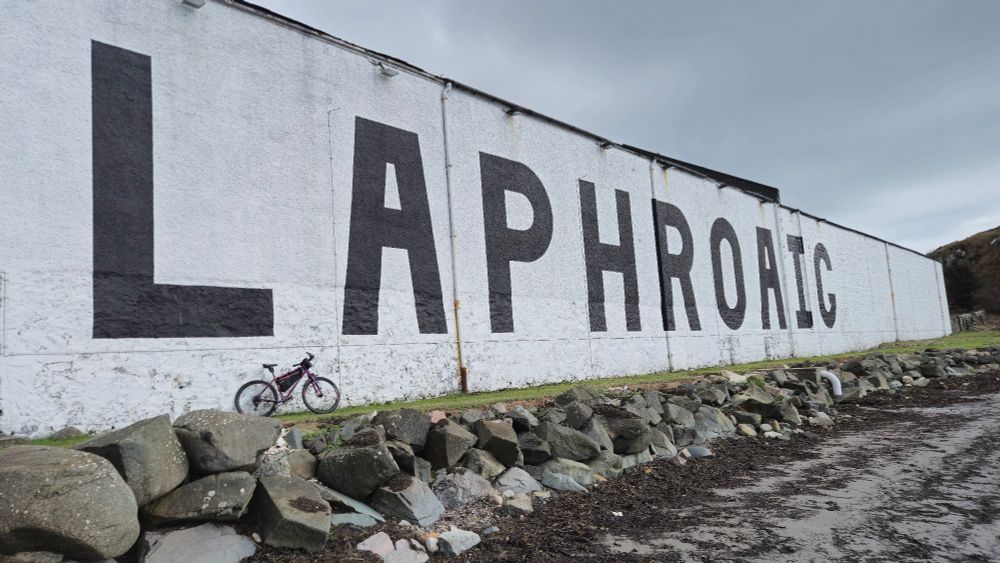
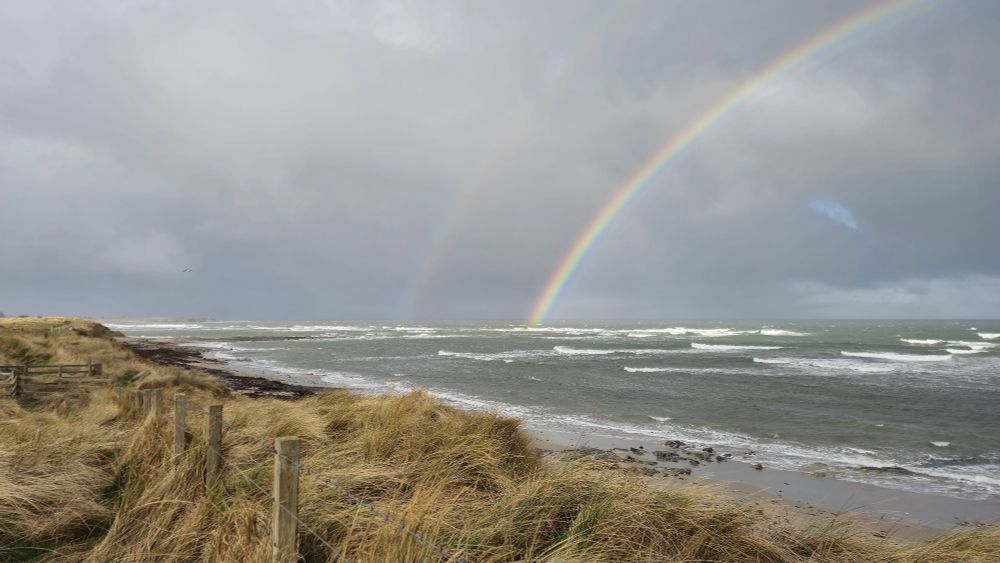
Up above Loch Tummel. Time to go hunt for that pot of gold.
27.04.2025 21:02 — 👍 3 🔁 0 💬 0 📌 0
Protection & creation of riparian woodland is one of the few management options available to mitigate river temperature increases under climate change. "riparian buffers wider than 15 m protected against water temperature increases..." agupubs.onlinelibrary.wiley.com/doi/10.1029/...
12.03.2025 09:05 — 👍 3 🔁 1 💬 0 📌 0
Your gateway to jobs that protect the planet. 🌍
Explore careers in climate, renewable energy, clean tech, sustainability & more. 🌱
🔎 Search now: https://greenercareers.co.uk
🦪Coastal scientist, earth-enthusiast, and occasional data wrangler
💡 Passionate about ecological restoration, sustainability, and being outside
📊 Turning complex data into actionable insights
👩👧 Mom balancing science, family, and growth.
Research Scientist with a passion for salmon habitat restoration and climate-adaptation strategies
WWU Master's Graduate - Freshwater Ecology 2023
Northwest Climate Adaptation Science Center Alum 2021
•fish biologist specializing in salmon ecology and restoration
•nature photographer creating ecological images to inspire preservation of wild places
•located in the Pacific Northwest, USA
•proud federal employee
https://linktr.ee/ncgleason
Arctic & boreal ecosystem ecology, nutrient cycling, and plant roots. Dog and human parent
Aquatic biologist studying Pacific salmon ecology and habitat restoration • Living in Coast Salish territory & working in Secwepemcúĺecw
Conservation science, adventuring, and coffee • Voidfather 🐈⬛ • He/him
Aquatic ecology lab focused on salmon systems at Simon Fraser University 🐟📚 Passionate about linking science to collaborative change and conservation action.
We work to create lasting protections for local waterways using community science, research, education, and advocacy. Our ambassador is the North American River Otter – an indicator of healthy waters.
Otters for Waters
https://riverotterecology.org/
Freshwater ecologist at Uni Bern and Eawag. Interested in river science, conservation and restoration planning.
Prof in Physical Geography @ Manchester, UK. Earth history, river science, #microplastics. Vice Pres R&HE @RGS_IBG Fellow @BSG_Geomorph Editor @GeogReview Author: The Ice Age VSI. A Little History of the Earth coming 14/10/25 🌍
PhD student at UHI Inverness - using eDNA and traditional approaches to investigate the impacts of Eurasian beavers on migratory fish and conservation priority mammals
Researcher | Behaviour, movement ecology, & global change | Data editor at Proceedings B
Website: http://www.jackandrewbrand.com
Science for sustainable seas.
The trusted voice of the farm-raised Scottish salmon sector - Scotland and the UK's number one food export.
Official account of #GeorgiaAFS (https://gaafs.org/)
Canada Research Chair, Civil and Resource Engineering, Dalhousie University - interested in groundwater, rivers, coasts, climate change, permafrost, fish habitat
CEO of Bluesky, steward of AT Protocol.
dec/acc 🌱 🪴 🌳
Ex-Financial Times Assistant Editor. Ex-editor Scotland on Sunday. Author of 'Made in Manchester' (2024) and bestselling 'Northerners: A History' (2022).