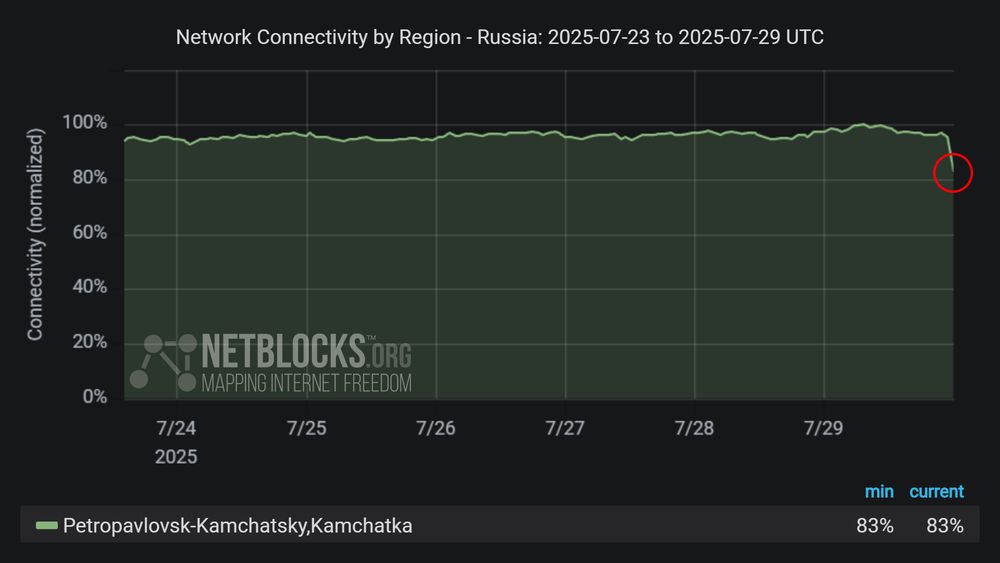
Graph from NetBlocks showing network connectivity by region in Russia from July 23, 2025, to July 29, 2025. The y-axis represents normalized connectivity, ranging from 0% to 100%, and the x-axis represents the dates. The green line representing Kamchatka Region's connectivity remains stable most of the time period, with a sharp drop on July 29. The drop in connectivity aligns with a major earthquake that hits off the east coast of Kamchatka. The minimum and current connectivity levels are indicated as 83% and 83%, respectively. The chart has a dark background with a red circle highlighting the decline at the end of the period.
⚠️ Confirmed: Internet outages have been registered in the Kamchatka Peninsula, #Russia after a 8.7 magnitude earthquake; the decline in network connectivity comes amid reports of power outages; tsunami warnings in effect across Russia, Japan, Guam, Hawaii and Alaska
30.07.2025 00:44 — 👍 19 🔁 6 💬 0 📌 0

Graph from NetBlocks showing network connectivity by provider from July 23, 2025, to July 24 2025. The y-axis represents normalized connectivity, ranging from 0% to 100%, and the x-axis represents the dates. The green line representing operator SPACEX-STARLINK (AS14593) connectivity remains stable at around 100% throughout most of the time period, with a sharp drop on July 24. Near total recovery is now visible. The chart has a dark background with a red vertical arrow labeled 'OUTAGE' indicates the period of disruption. SPACEX-STARLINK (16% / 92%)
ℹ️ Update: Connectivity has been restored on Starlink (AS14593) after an international outage affecting multiple countries; the operator has not issued an explanation; incident duration ~2h 📈
24.07.2025 22:34 — 👍 14 🔁 6 💬 0 📌 0
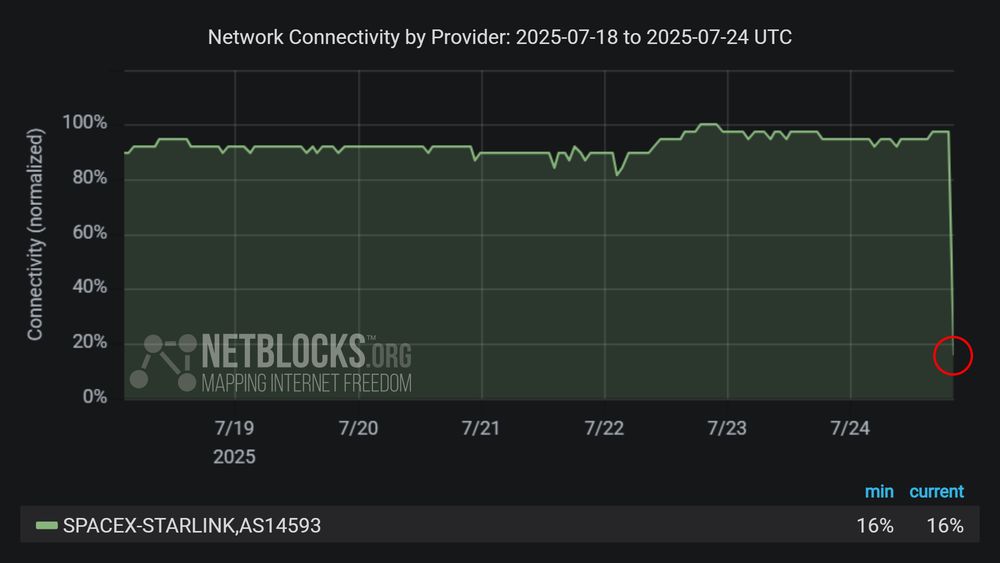
Graph from NetBlocks showing network connectivity by provider from July 18, 2025, to July 24 2025. The y-axis represents normalized connectivity, ranging from 0% to 100%, and the x-axis represents the dates. The green line representing operator SPACEX-STARLINK (AS14593) connectivity remains stable at around 100% throughout most of the time period, with a sharp drop on July 24. The chart has a dark background with a red circle highlighting the decline at the end of the period. SPACEX-STARLINK (16% / 16%)
⚠️ Confirmed: Network data show a major disruption to the Starlink satellite internet service with overall connectivity down to 16% of ordinary levels, corroborating user reports of an outage 📉 #StarlinkDown
24.07.2025 20:26 — 👍 32 🔁 16 💬 3 📌 0
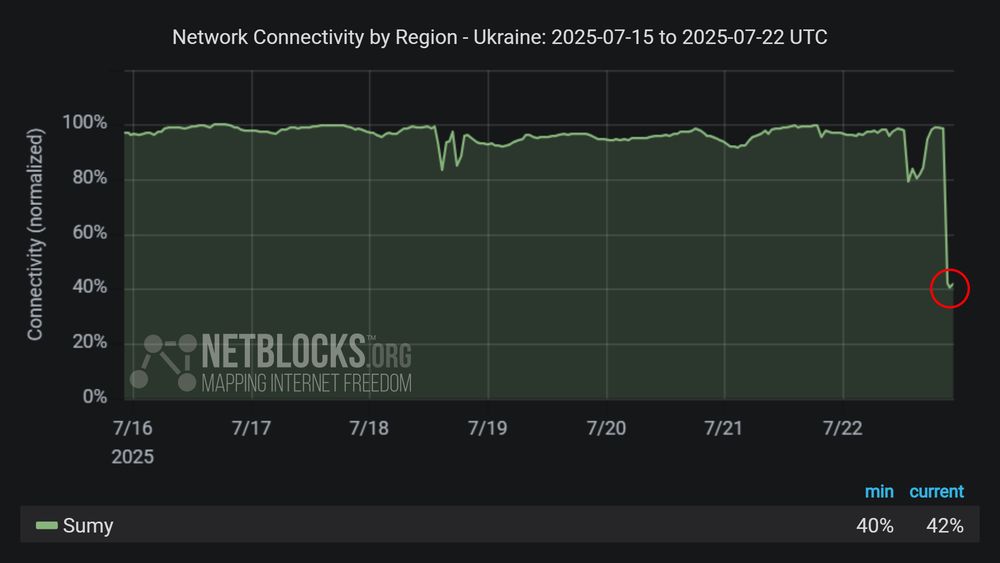
Graph from NetBlocks showing network connectivity by region in Ukraine from July 15, 2025, to July 22, 2025. The y-axis represents normalized connectivity, ranging from 0% to 100%, and the x-axis represents the dates. The green line representing Sumy Region's connectivity remains stable most of the time period, with a sharp drop on July 22. The drop in connectivity aligns with UAV attacks by Russia. The minimum and current connectivity levels are indicated as 40% and 42%, respectively. The chart has a dark background with a red circle highlighting the decline at the end of the period.
⚠️ Confirmed: Metrics show a disruption to internet connectivity in Sumy Oblast, #Ukraine, amid reports of UAV attacks by Russia on critical infrastructure; authorities say they are working to resolve the issue ⚡
22.07.2025 22:37 — 👍 10 🔁 7 💬 0 📌 0
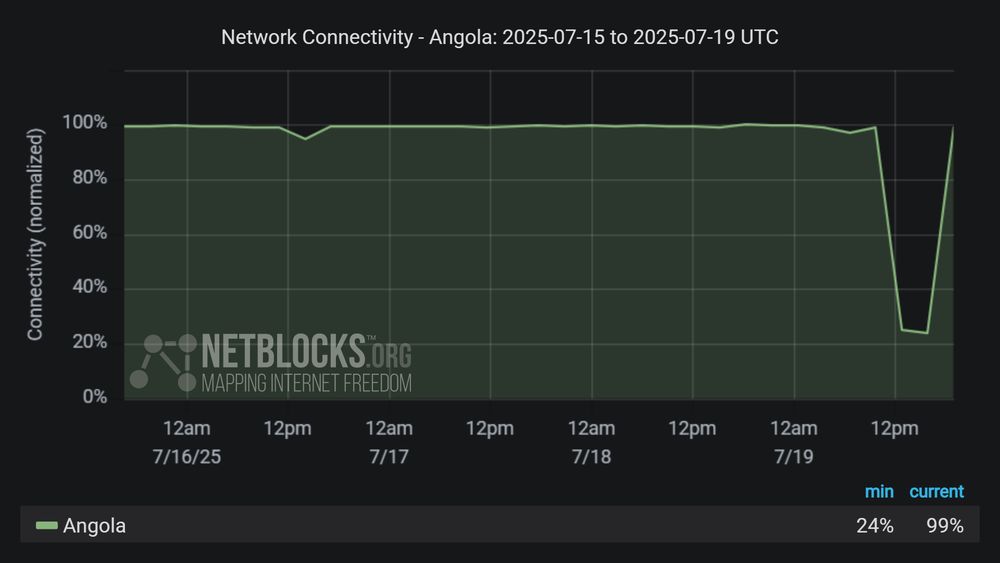
Graph from NetBlocks showing the network connectivity in Angola, from July 15, 2025, to July 19, 2025. The y-axis represents normalized connectivity, ranging from 0% to 100%, and the x-axis represents the dates. The green line representing Angola's connectivity remains stable at around 100%, with a sharp drop on July 19. The drop in connectivity aligns with an internet disruption due to a fiber optic cut. Total recovery is now visible. The minimum and current connectivity levels are indicated as 24% and 99%, respectively. The chart has a dark background.
ℹ️ Confirmed: #Angola has experienced a wide scale disruption to internet connectivity, attributed by operator Angola Cables to a fiber optic cut between the Angonap and Sangano power plants due to roadworks 📈
19.07.2025 19:23 — 👍 8 🔁 3 💬 0 📌 0
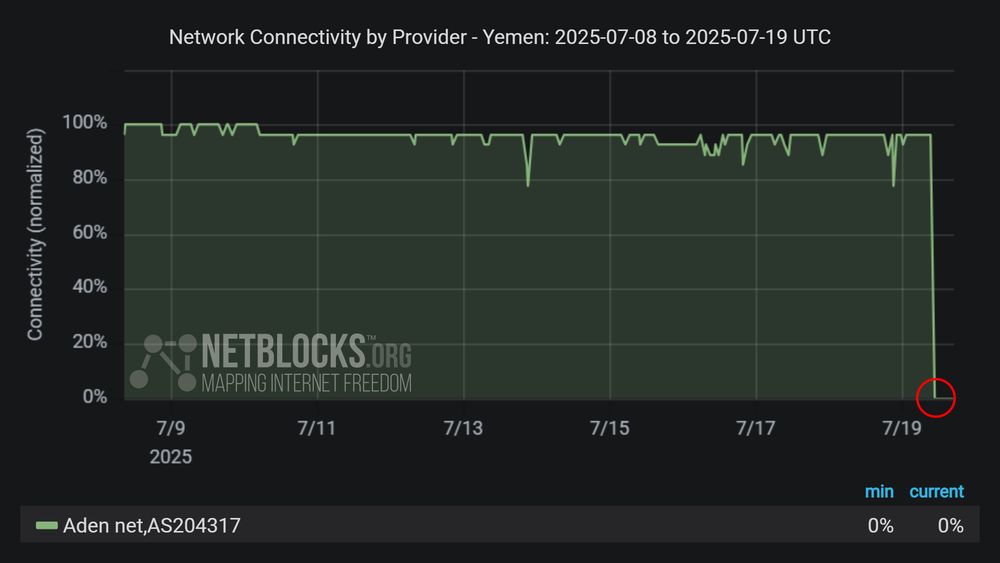
Graph from NetBlocks showing network connectivity by provider in the Yemen from July 08, 2025, to July 19, 2025. The y-axis represents normalized connectivity, ranging from 0% to 100%, and the x-axis represents the dates. The green line representing operator Aden Net's (AS204317) connectivity remains stable at around 100% throughout most of the time period, with a sharp drop on July 19. The chart has a dark background with a red circle highlighting the decline at the end of the period. Aden Net (0% / 0%)
⚠️ Confirmed: Metrics show internet provider Aden Net (AS204317) is experiencing a widespread outage in #Yemen; the operator attributes the incident to a disruption in international connectivity from Djibouti 📉
19.07.2025 18:18 — 👍 7 🔁 3 💬 0 📌 0
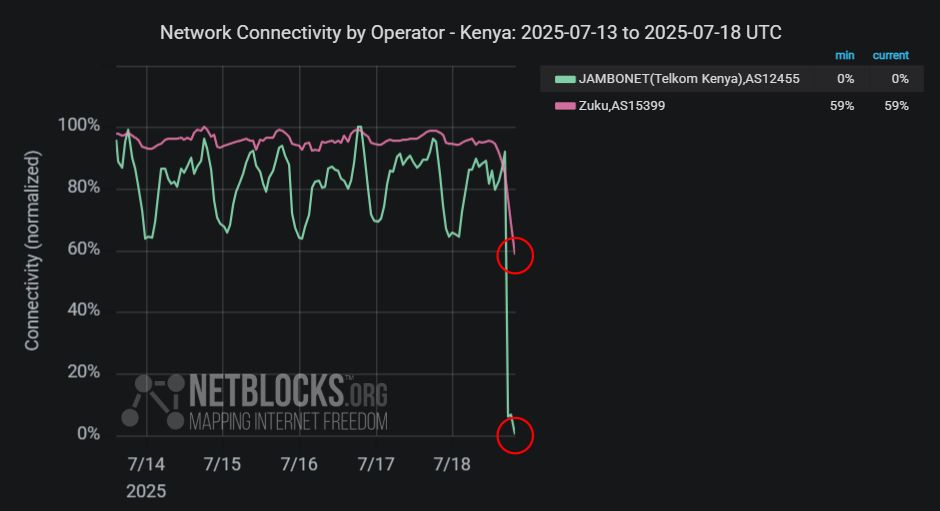
Graph from NetBlocks showing network connectivity by provider in the Kenya from July 13, 2025, to July 18, 2025. The y-axis represents normalized connectivity, ranging from 0% to 100%, and the x-axis represents the dates. The graph indicates connectivity disruptions in Kenya starting on July 18. The chart has a dark background with tow red circles highlighting the declines at the end of the period, and connectivity lines for each provider are color-coded. Jambonet (Telkom Kenya) (0% / 0%), Zuku (59% / 59%)
ℹ️ Confirmed: Metrics show internet providers Jambonet (AS12455) and Zuko (AS15399) are currently experiencing a widespread outage across #Kenya; operators have not issued an explanation 📉
18.07.2025 20:03 — 👍 6 🔁 2 💬 0 📌 0

Screenshot of a terminal window showing a failed DNS query using the dig command. The command entered is dig @1.1.1.1 +norecurse example.com. The response reads: "connection timed out; no servers could be reached", indicating that the DNS server at 1.1.1.1 did not respond.
ℹ️ Note: Hosting company Cloudflare is experiencing public DNS resolver issues; the incident affects users with custom DNS and can be resolved using another provider; the company is looking into the matter; incident not related to country-level internet disruptions or filtering
14.07.2025 22:42 — 👍 18 🔁 10 💬 0 📌 2
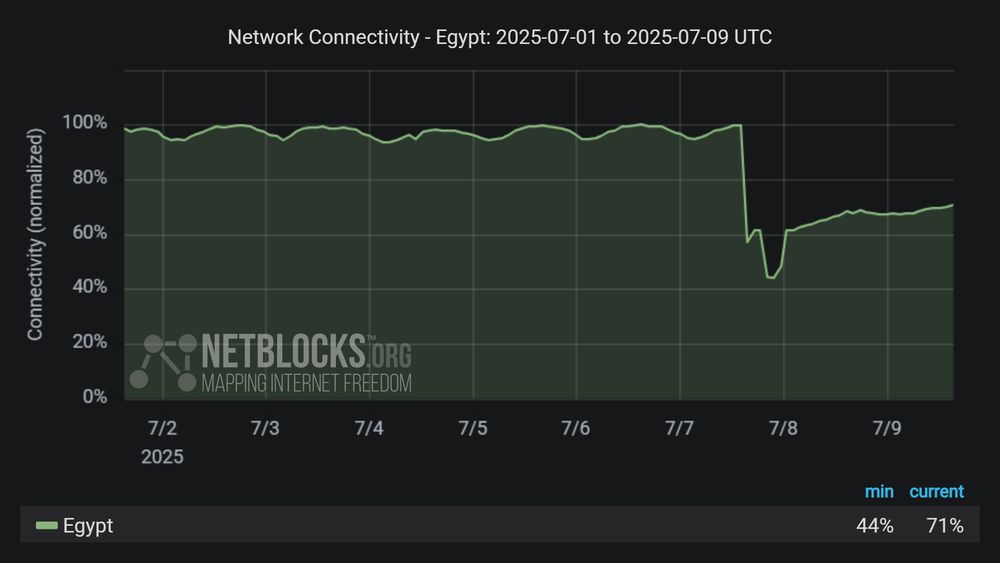
Graph from NetBlocks showing the network connectivity in Egypt, from July 1, 2025, to July 09, 2025. The y-axis represents normalized connectivity, ranging from 0% to 100%, and the x-axis represents the dates. The green line representing Egypt's connectivity remains stable at around 100%, with a sharp drop on July 7. The drop in connectivity aligns with internet disruption due to a major fire at the Ramses Exchange, Cairo. The minimum and current connectivity levels are indicated as 44% and 71%, respectively. The chart has a dark background.
ℹ️ Update: Internet connectivity in #Egypt remains degraded some 48 hours after Monday's deadly fire at the Ramses Central Exchange; diminished telecoms continue to impact the economy and limit the public's ability to communicate 📉
09.07.2025 16:30 — 👍 4 🔁 3 💬 0 📌 0
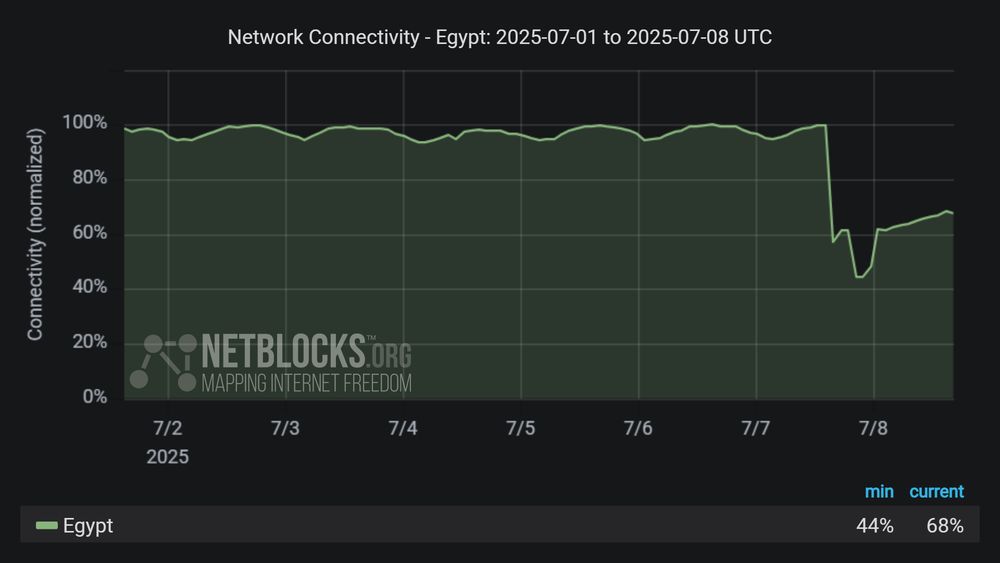
Graph from NetBlocks showing the network connectivity in Egypt, from July 1, 2025, to July 08, 2025. The y-axis represents normalized connectivity, ranging from 0% to 100%, and the x-axis represents the dates. The green line representing Egypt's connectivity remains stable at around 100%, with a sharp drop on July 7. The drop in connectivity aligns with internet disruption due to a major fire at the Ramses Exchange, Cairo. The minimum and current connectivity levels are indicated as 44% and 68%, respectively. The chart has a dark background.
ℹ️ Update: Internet and telecoms have been disrupted in #Egypt for over 24 hours after a deadly fire broke out at Ramses Central; authorities suspended trading on the Exchange amid efforts to restore connectivity 💱
08.07.2025 17:09 — 👍 10 🔁 3 💬 1 📌 0
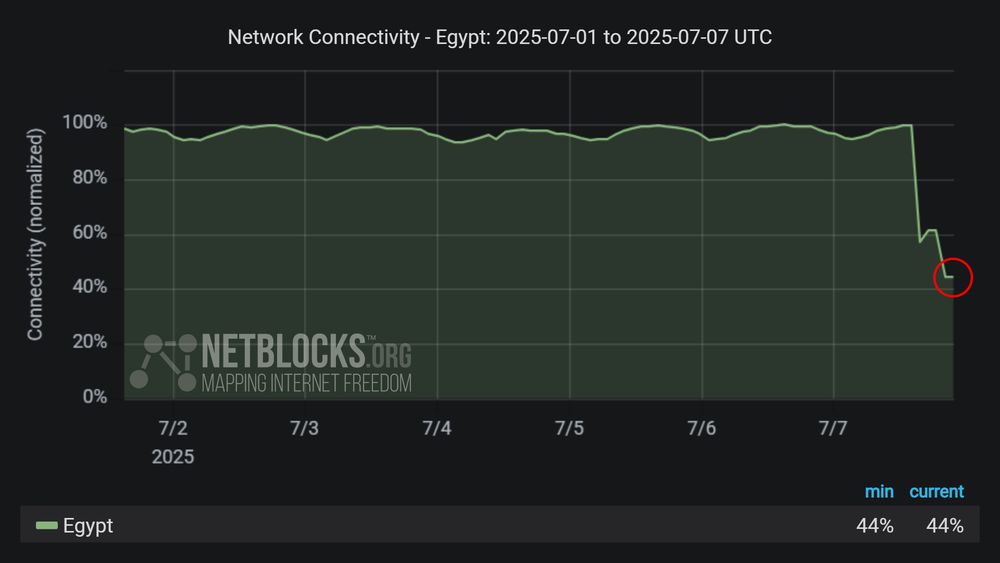
Graph from NetBlocks showing the network connectivity in Egypt, from July 1, 2025, to July 07, 2025. The y-axis represents normalized connectivity, ranging from 0% to 100%, and the x-axis represents the dates. The green line representing Egypt's connectivity remains stable at around 100%, with a sharp drop on July 7. The drop in connectivity aligns with internet disruption due to a major fire at the Ramses Exchange, Cairo. The minimum and current connectivity levels are indicated as 44% and 44%, respectively. The chart has a dark background with a red circle highlighting the decline at the end of the period.
ℹ️ Update: Internet connectivity in #Egypt remains diminished following a fire at the Ramses Central Exchange; network data show national connectivity at 44% of ordinary levels with services including banking, mobile payments and online trade affected 🏧
07.07.2025 22:24 — 👍 8 🔁 5 💬 1 📌 1
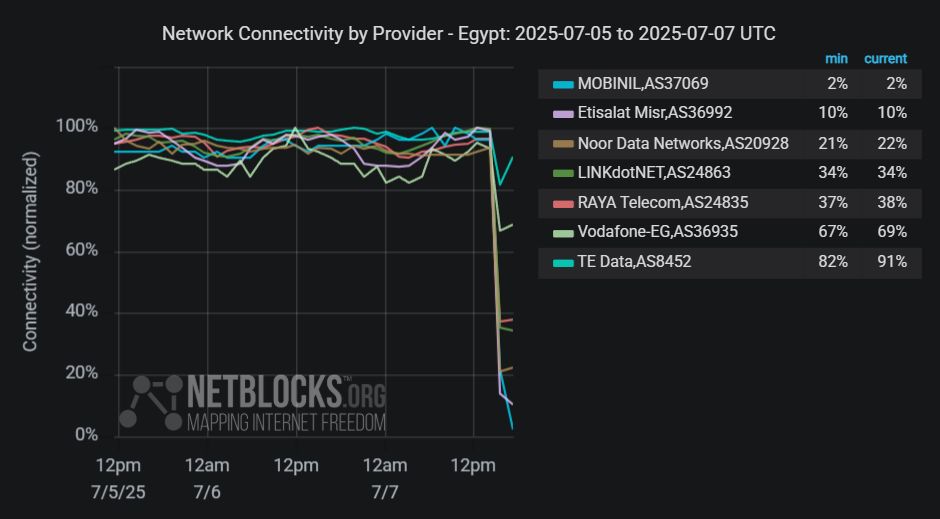
Graph from NetBlocks showing network connectivity by provider in the Egypt from July 5, 2025, to July 7, 2025. The y-axis represents normalized connectivity, ranging from 0% to 100%, and the x-axis represents the dates. The graph indicates connectivity disruptions in Egypt starting on July 7 due to a major fire at the Ramses Exchange. The chart has a dark background, and connectivity lines for each provider are color-coded. MOBINIL (2% / 2%), Etisalat Misr (10% / 10%), Noor Data Networks (21% / 22%), LINKdotNET (34% / 34%), RAYA Telecom (37% / 38%), Vodafone-EG (67% / 69%), TE Data (82% / 91%)
⚠️ Confirmed: A major internet disruption has been registered in #Egypt; network data show national connectivity at 62% of ordinary levels amid reports of a fire at Ramses Exchange, a key telecoms datacenter 🧯📉
07.07.2025 18:09 — 👍 13 🔁 4 💬 1 📌 0
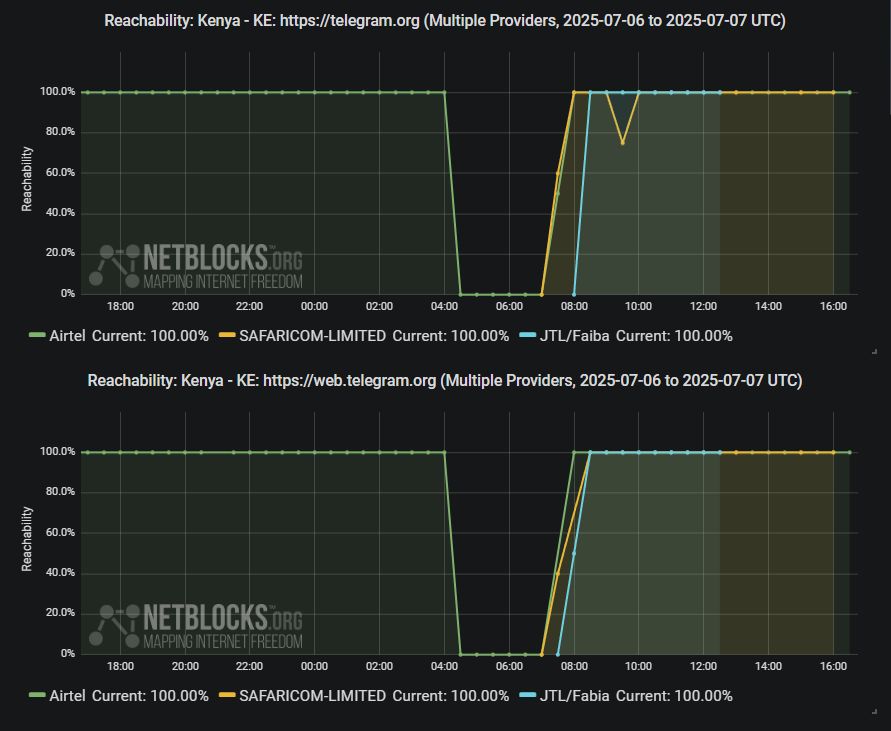
Chart from NetBlocks showing platform feature restrictions by ISP in Togo from July 6, 2025 to June 7,2025. The y-axis represents reachability, ranging from 0% to 100%, and the x-axis represents the dates. The data indicates disruptions affecting social platform Telegram across major ISPs such as Airtel, Safaricom and Faiba, with services showing no reachability on the morning of July 7. Total recovery is now visible. The disruptions align with Saba Saba protests in the region. The chart has a dark background and reachability lines for each ISP are color-coded.
ℹ️ Note: Metrics show a ~4 hour disruption to Telegram in #Kenya this morning; the incident follows a pattern of earlier restrictions and comes on the 35th anniversary of the Saba Saba protests calling for free elections #SabaSaba2025
07.07.2025 17:34 — 👍 5 🔁 4 💬 0 📌 1
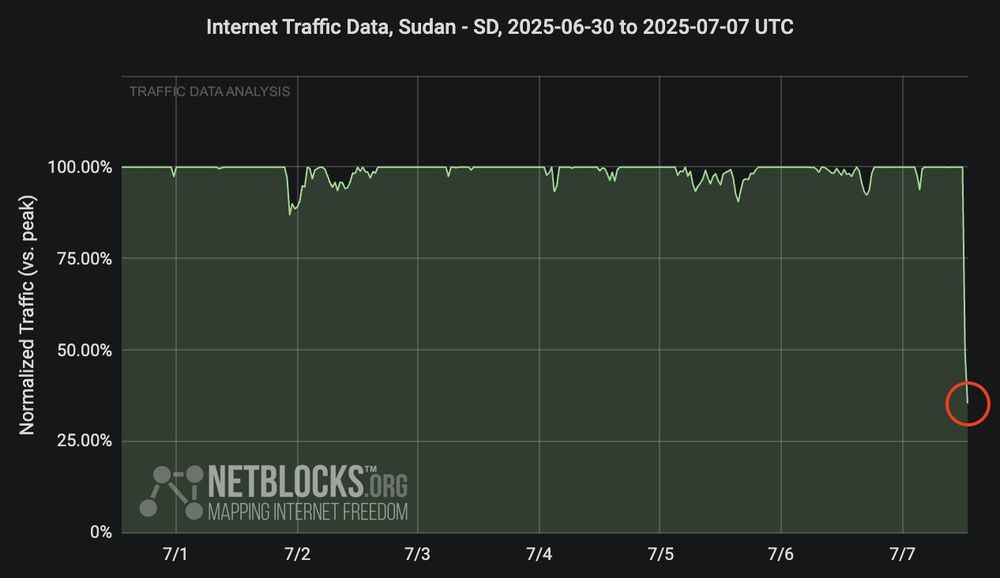
Graph from NetBlocks showing the network traffic in Sudan, from June 30, 2025, to July 7, 2025. The y-axis represents traffic, ranging from 0% to 100%, and the x-axis represents the dates. The graph indicates a major traffic disruption across Sudan on July 7. The drop in traffic aligns with internet disruptions due to national exams. The minimum and current connectivity levels are indicated as 30% and 30%, respectively. The chart has a dark background with green lines and text for traffic data, with a red circle highlighting the decline.
⚠️ Confirmed: Analysis of telemetry shows a widespread disruption to internet traffic in #Sudan with high impact to mobile networks; the incident coincides with certificate exams and is understood to be a measure to prevent exam cheating 📉
07.07.2025 15:36 — 👍 3 🔁 1 💬 0 📌 0
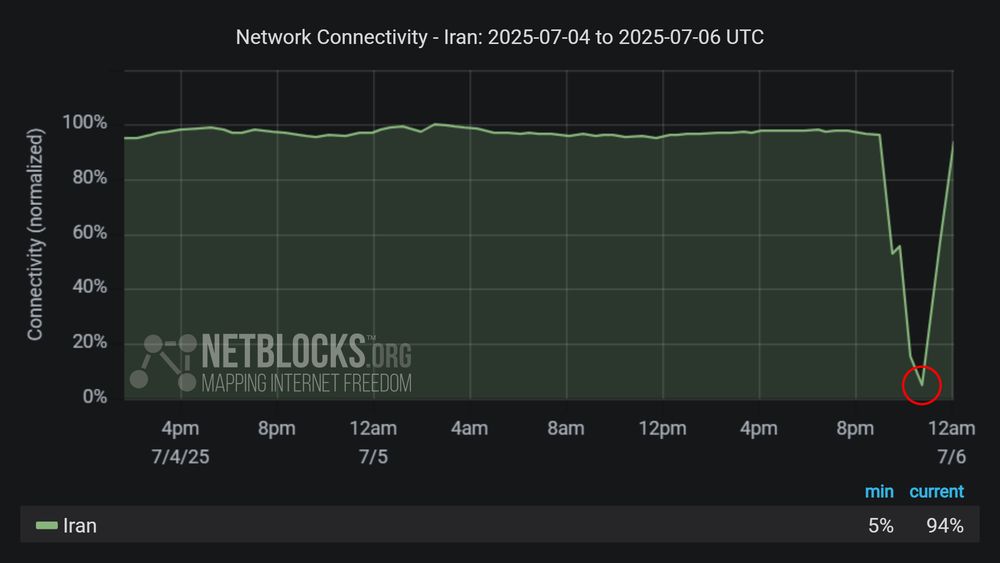
Graph from NetBlocks showing the network connectivity in Iran, from June 28, 2025, to July 06, 2025. The y-axis represents normalized connectivity, ranging from 0% to 100%, and the x-axis represents the dates. The green line representing Iran's connectivity remains stable at around 100%, with a sharp drop on July 5. Near-total recovery is now visible. The minimum and current connectivity levels are indicated as 5% and 94%, respectively. The chart has a dark background with a red circle highlighting the decline at the end of the period.
ℹ️ Update: Internet service has been largely restored in #Iran after a nation-scale disruption; authorities have not issued an explanation; incident duration ~2 hours 📈
06.07.2025 00:25 — 👍 9 🔁 2 💬 0 📌 1
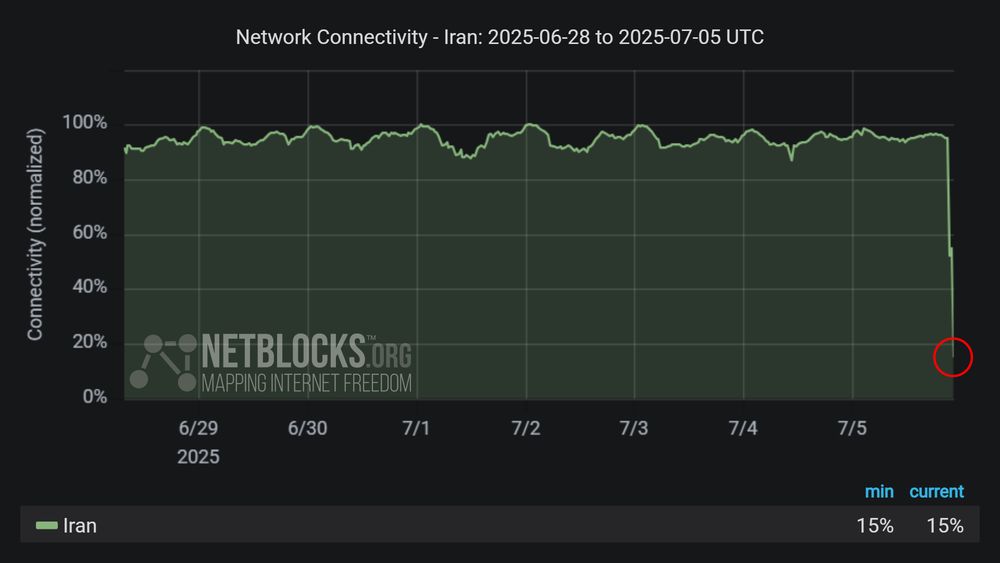
Graph from NetBlocks showing the network connectivity in Iran, from June 28, 2025, to July 05, 2025. The y-axis represents normalized connectivity, ranging from 0% to 100%, and the x-axis represents the dates. The green line representing Iran's connectivity remains stable at around 100%, with a sharp drop on July 5. The minimum and current connectivity levels are indicated as 15% and 15%, respectively. The chart has a dark background with a red circle highlighting the decline at the end of the period.
⚠️ Confirmed: Live network data show a major disruption to internet connectivity in #Iran, corroborating widespread user reports of issues reaching the global internet; the incident comes just weeks after authorities shut down telecoms during the war with Israel 📉
05.07.2025 22:24 — 👍 18 🔁 11 💬 1 📌 0
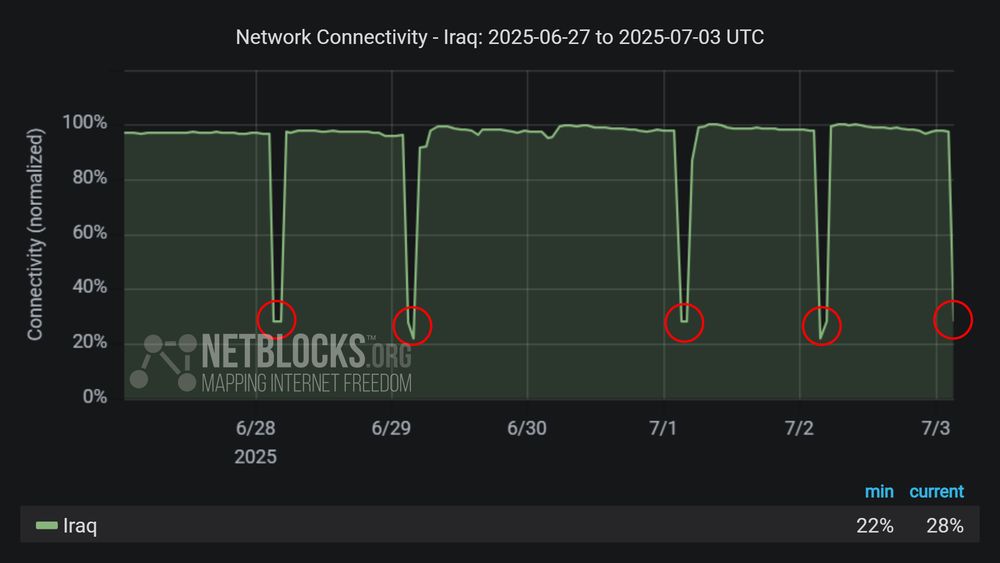
Graph from NetBlocks showing the network connectivity in Iraq, from June 27, 2025, to July 3, 2025. The y-axis represents normalized connectivity, ranging from 0% to 100%, and the x-axis represents the dates. The green line representing Iraq's connectivity remains stable at around 100% throughout most of the time period, with a sharp drop on the morning of June 28, a second sharp drop on the morning on June 29, a third sharp drop on the morning on July 1, a fourth sharp drop on the morning on July 2, and a fifth sharp drop on the morning on July 3. The drops in connectivity align with internet disruptions due to national exams. The minimum and current connectivity levels are indicated as 22% and 28%, respectively. The chart has a dark background with five red circles highlighting the declines.
⚠️ Update: Metrics show internet connectivity has again been disrupted across most of #Iraq as authorities limit communications, a measure intended to prevent exam cheating; the policy has been in place for several years with little indication as to its effectiveness
03.07.2025 03:57 — 👍 4 🔁 3 💬 0 📌 1

Screenshot of the X (formerly Twitter) social media platform showing a message that reads 'Posts aren’t loading right now' with an option to 'Try again' underneath.
ℹ️ Note: X (formerly Twitter) is currently experiencing international outages; incident not related to country-level internet disruptions or filtering #TwitterDown
02.07.2025 13:59 — 👍 15 🔁 4 💬 0 📌 1
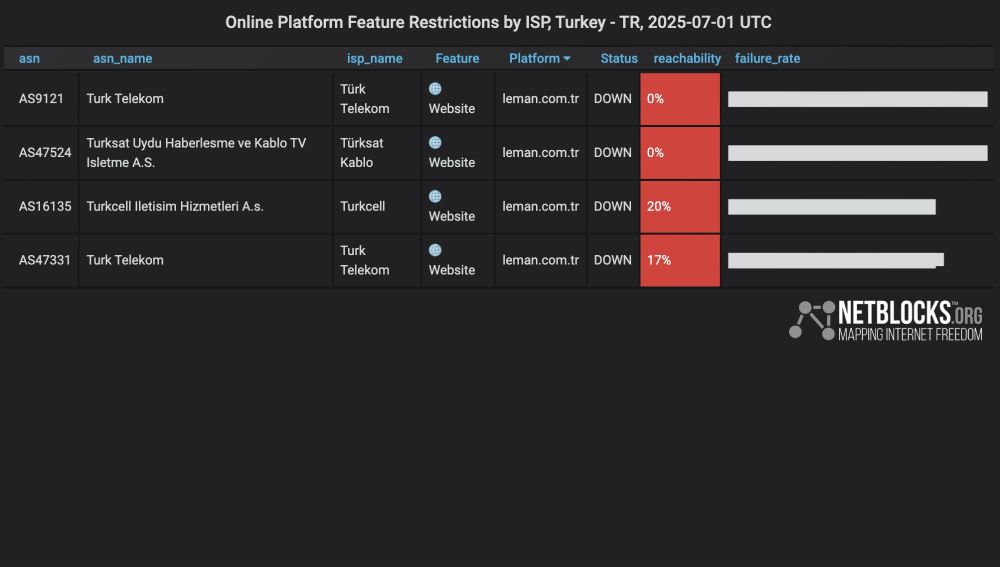
Chart from NetBlocks showing platform feature restrictions by ISP in Turkey from July 1, 2025. The data indicates internet restrictions affecting website of satirical weekly Leman. Access issues are observed across major ISPs such as Turk Telekom, Turkcell, and Turksat Kablo, with services showing varying levels of reachability, in most cases down to 0%. The restriction comes after employees of the satirical magazine published a cartoon that allegedly show the Prophet Muhammad.
⚠️ Confirmed: Metrics show the website of satirical weekly Leman has been restricted in #Turkey; the incident comes after Islamist figures in government criticise an alleged depiction of Prophets Moses and Muhammad shaking hands in the sky, leading to the cartoonists' detention
01.07.2025 12:00 — 👍 9 🔁 7 💬 0 📌 0
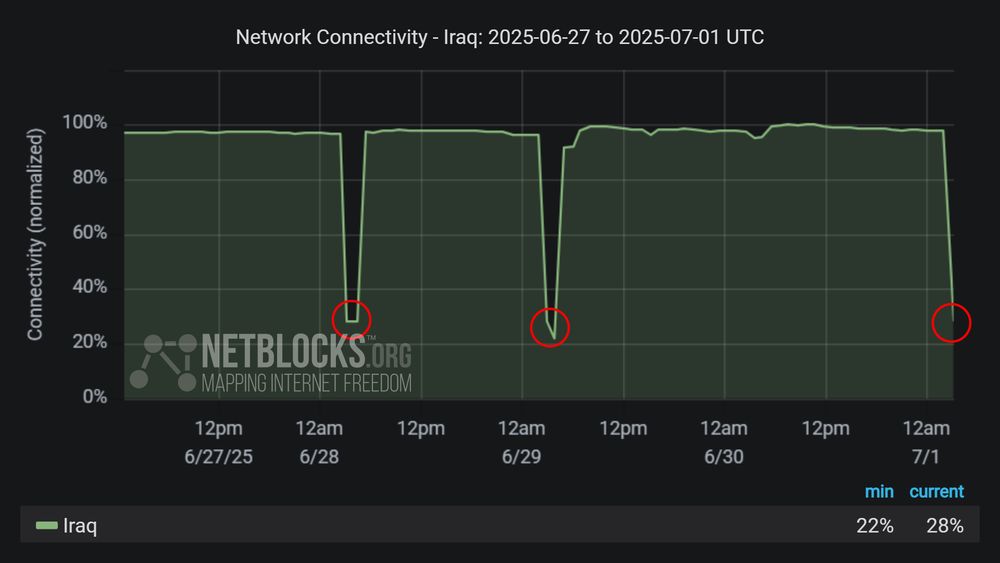
Graph from NetBlocks showing the network connectivity in Iraq, from June 27, 2025, to July 1, 2025. The y-axis represents normalized connectivity, ranging from 0% to 100%, and the x-axis represents the dates. The green line representing Iraq's connectivity remains stable at around 100% throughout most of the time period, with a sharp drop on the morning of June 28, a second sharp drop on the morning on June 29, and a third sharp drop on the morning on July 1. The drops in connectivity align with internet disruptions due to national exams. The minimum and current connectivity levels are indicated as 22% and 28%, respectively. The chart has a dark background with three red circles highlighting the declines.
⚠️ Confirmed: Live metrics show internet access has been shut down across most of #Iraq except the north this morning, the latest in a series of digital blackouts imposed by authorities in an attempt to prevent cheating in school exams 📉
01.07.2025 03:52 — 👍 8 🔁 6 💬 1 📌 0
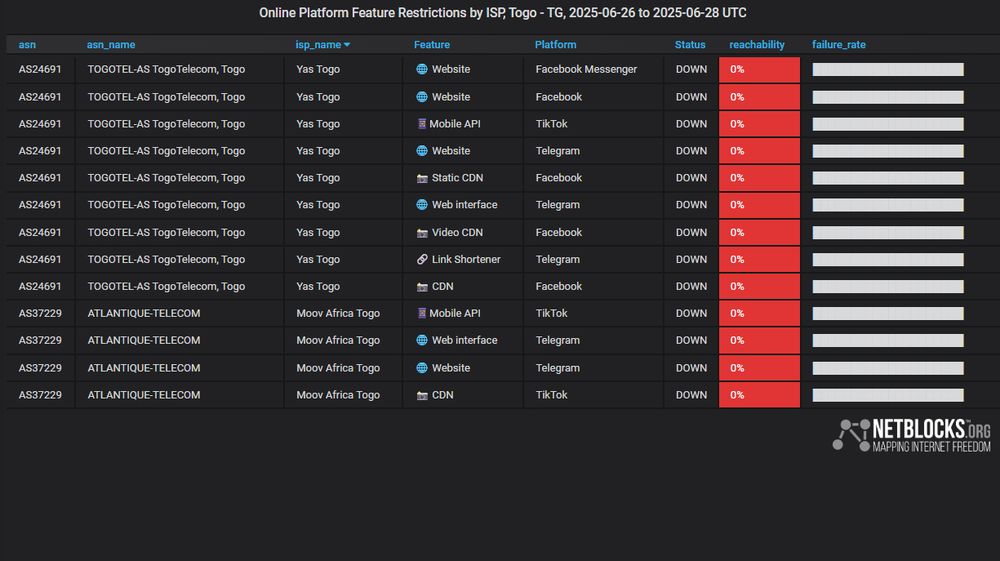
Chart from NetBlocks showing platform feature restrictions by ISP in Togo from June 26, 2025 to June 28,2025. The data indicates internet restrictions affecting social platforms TikTok, Facebook, and Telegram. Across major ISPs such as Yas Togo and Moov Africa Togo, with services showing no reachability. The restrictions aligns with escalating protests in the region.
⚠️ Update: Live metrics show social media platforms TikTok, Facebook and Telegram remain restricted in #Togo for a third day, with restrictions in place on internet providers Yas Togo and Moov Africa; the measure was imposed amid protests against the country's long-running leader
28.06.2025 20:35 — 👍 12 🔁 6 💬 0 📌 0
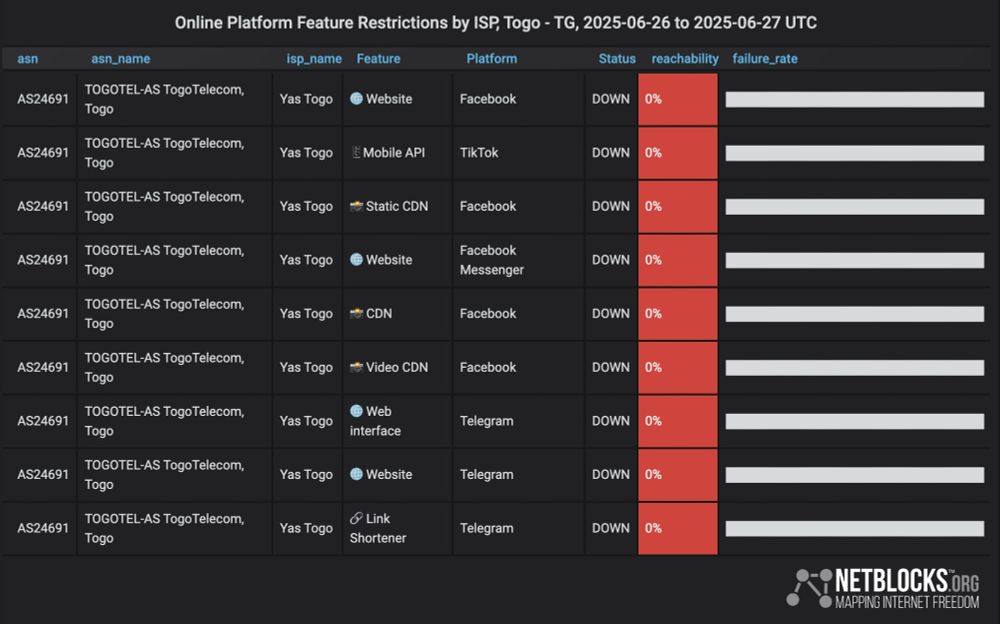
Chart from NetBlocks showing platform feature restrictions by ISP in Togo from June 26, 2025 to June 27,2025. The data indicates internet restrictions affecting social platforms TikTok, Facebook, and Telegram. Access issues are observed on the main ISP Yas Togo, with services showing no reachability. aligns with escalating protests in the region.
⚠️ Confirmed: Metrics show social platforms TikTok, Facebook, and Telegram have been restricted in #Togo on main internet provider Yas Togo, corroborating user reports; the incident comes as soldiers suppress protests calling for long-time president Gnassingbe's resignation
27.06.2025 23:10 — 👍 22 🔁 9 💬 1 📌 0
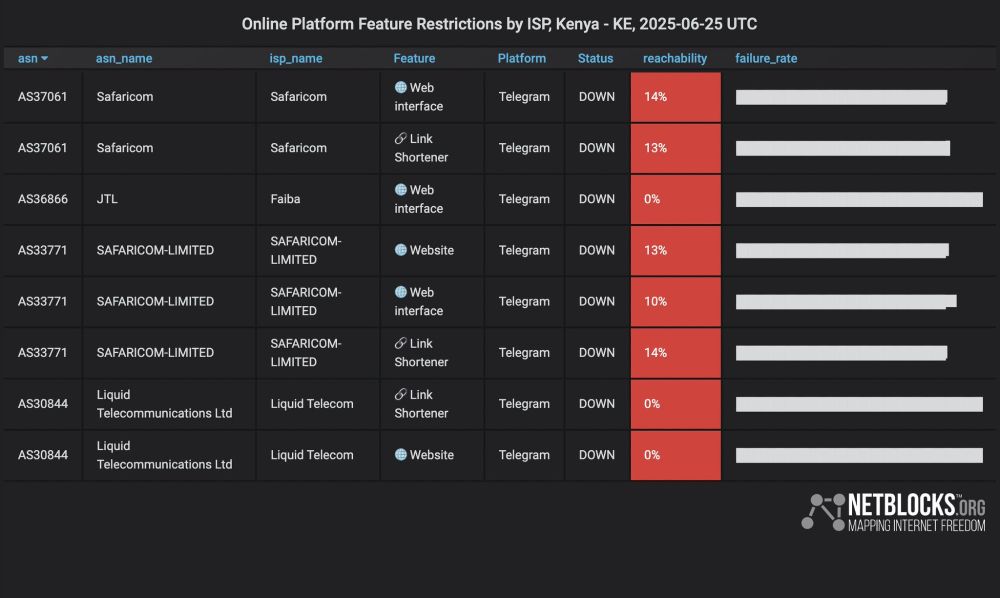
Chart from NetBlocks showing platform feature restrictions by ISP in Vietnam from June 25, 2025. The data indicates internet restrictions affecting messaging app Telegram. Access issues are observed across major ISPs such as Safaricom, FaibaJTL and Liquid Telecom, with services showing no reachability. The restriction comes on the anniversary of June 25 Protests.
⚠️ Confirmed: Live metrics show restrictions to messaging platform Telegram in #Kenya are now in effect; the measure comes as authorities issue a ban on live media coverage of the June 25 anniversary protests, amid rising concerns over the risk of a wider internet shutdown 📵
25.06.2025 12:44 — 👍 2 🔁 6 💬 0 📌 0
One year ago, #Kenya disrupted internet access while cracking down on protests, limiting media and the people's freedom of speech.
Tomorrow marks the one-year anniversary of this deadly event: Connectivity is vital and authorities should ensure unhindered access to services 🗓️
24.06.2025 19:48 — 👍 5 🔁 3 💬 0 📌 0
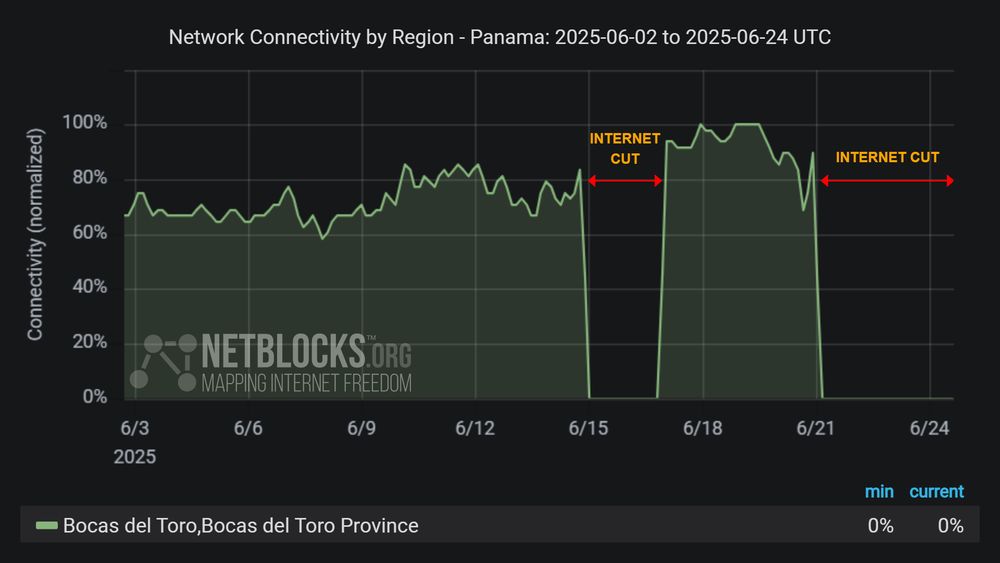
Graph from NetBlocks showing network connectivity by region in Panama from June 2, 2025, to June 24, 2025. The y-axis represents normalized connectivity, ranging from 0% to 100%, and the x-axis represents the dates. The green line representing Bocas del Toro Province's connectivity remains stable most of the time period, with a sharp drop on June 14 and a second sharp drop on June 21. The drop in connectivity aligns with escalating protests in the region. The minimum and current connectivity levels are indicated as 0% and 0%, respectively. The chart has a dark background with two red horizontal arrows labeled 'INTERNET CUT' indicates the period of disruption.
⚠️ Update: Metrics show the internet blackout in the Bocas del Toro Province of #Panama is in its third day, with emergency calls also impacted; the measure, imposed in response to banana workers' protests, continues to limit economic activity and freedom of expression
24.06.2025 17:51 — 👍 5 🔁 3 💬 0 📌 0
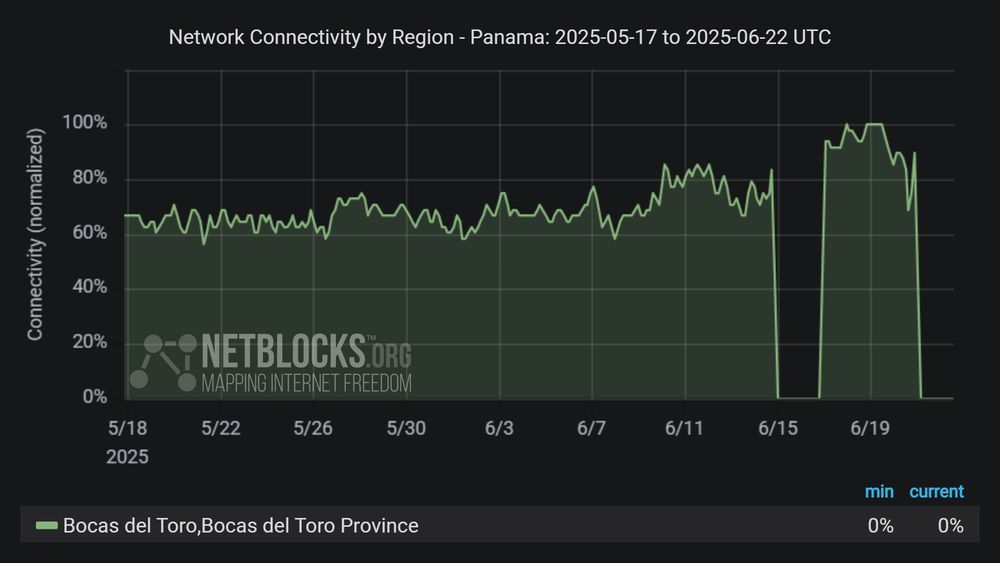
Graph from NetBlocks showing network connectivity by region in Panama from May 17, 2025, to June 22, 2025. The y-axis represents normalized connectivity, ranging from 0% to 100%, and the x-axis represents the dates. The green line representing Bocas del Toro Province's connectivity remains stable most of the time period, with a sharp drop on June 14 and a second sharp drop on June 21. The drop in connectivity aligns with escalating protests in the region. Near-total recovery is now visible. The minimum and current connectivity levels are indicated as 0% and 0%, respectively.
⚠️ Confirmed: Metrics show a government-issued internet shutdown in effect in the main banana-producing region of #Panama, Bocas del Toro province, as authorities restrict freedom of movement to allow warrantless arrests targeting protests and strikes by the banana workers' union
22.06.2025 16:28 — 👍 24 🔁 18 💬 2 📌 1
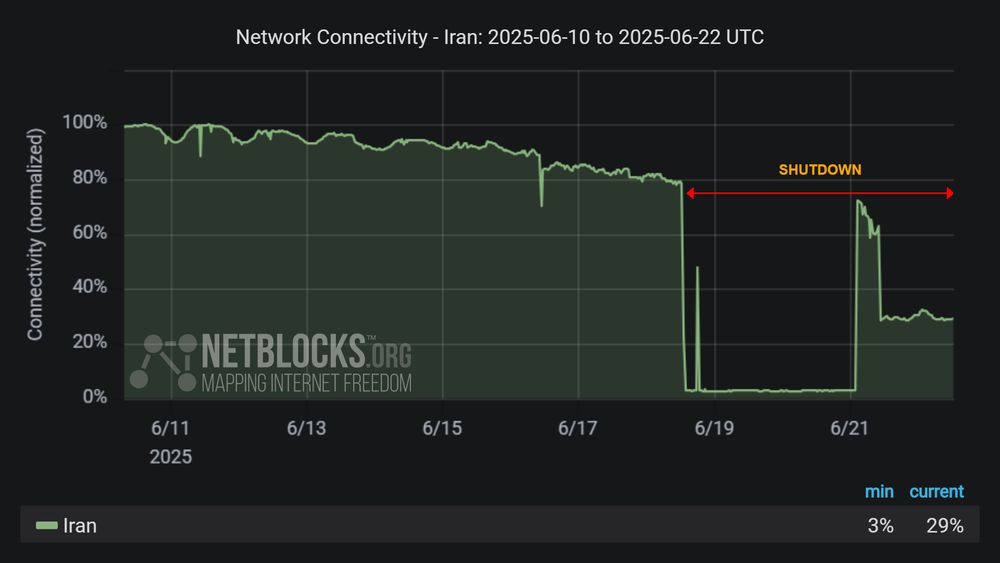
Graph from NetBlocks showing the network connectivity in Iran, from June 10, 2025, to June 22, 2025. The y-axis represents normalized connectivity, ranging from 0% to 100%, and the x-axis represents the dates. The green line representing Iran's connectivity remains stable at around 100% until June 13 when the decline begins with a sharp drop on June 18 and a second drop on the morning of June 21, after a partial recovery on the early morning of June 21, The drop in connectivity aligns with escalating conflict by Israel. The minimum and current connectivity levels are indicated as 3% and 29%, respectively. The chart has a dark background with red horizontal arrows labeled 'SHUTDOWN' indicates the period of disruption.
⚠️ Update: #Iran's internet shutdown is entering its fourth day, with the country remaining largely offline despite a slight restoration in connectivity; at 72 hours, diminished telecoms continue to impact the public's ability to stay informed and in touch with loved ones ⏱️
22.06.2025 13:20 — 👍 11 🔁 11 💬 1 📌 2
Screenshot of the Truth Social social media platform showing a message that reads 'Network failed Please try again.'
ℹ️ Note: Social media platform Truth Social is experiencing international outages for many users after US President Donald Trump announces strikes on three nuclear sites in Iran; incident not related to country-level internet disruptions or filtering #TruthSocialDown
22.06.2025 00:47 — 👍 10 🔁 8 💬 0 📌 2
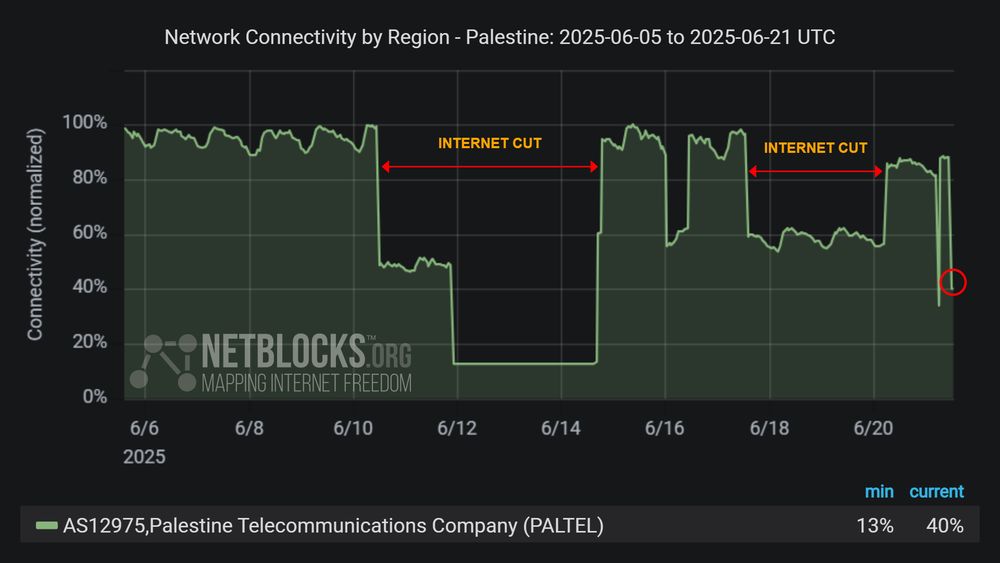
Graph from NetBlocks showing network connectivity by region in Palestine from June 5, 2025, to June 21, 2025. The y-axis represents normalized connectivity, ranging from 0% to 100%, and the x-axis represents the dates. The green line representing operator Paltel's (AS12975) connectivity remains stable at around 100% throughout most of the time period, with a sharp drop on June 10, a second sharp drop on the night of June 11, caused by a cut in one of the main routes due to ongoing aggression, a third drop on the early morning of June 16 after a total recovery on the night of June 14, a fourth drop on June 17 after a total recovery on the night of June 16, and a fifth drop on June 21 after a partial recovery on the morning of June 20. The minimum and current connectivity levels are indicated as 13% and 40%, respectively. The chart has a dark background with two red horizontal arrows labeled 'INTERNET CUT' indicates the period of disruption and a red circle highlighting the decline at the end of the period.
⚠️ Confirmed: Metrics show the #Gaza Strip is again in the midst of a telecoms blackout with high impact to central and northern governorates, the fourth such incident this month; operator Paltel anticipates a permanent blackout if further international routes are targeted 📉
21.06.2025 14:16 — 👍 7 🔁 6 💬 0 📌 0
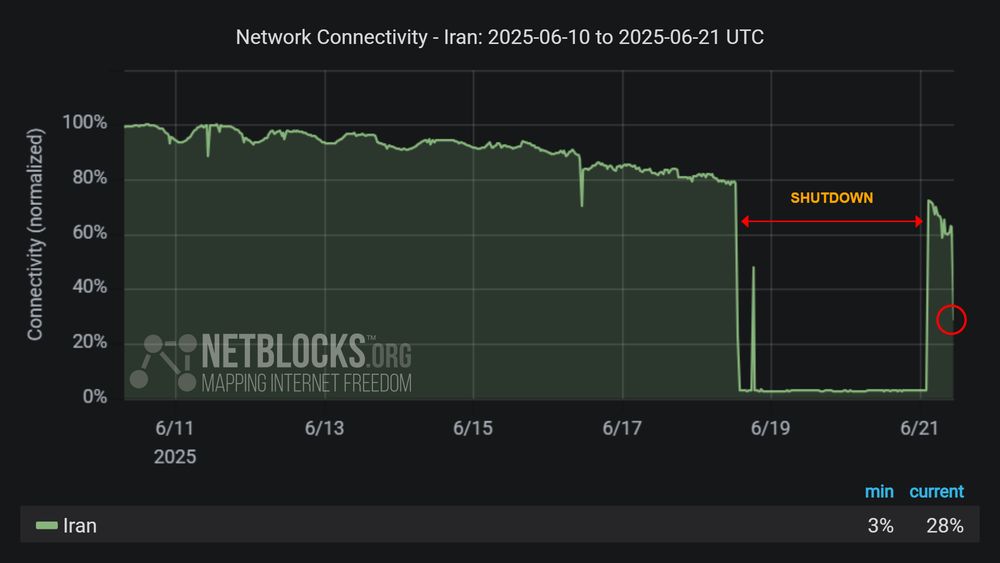
Graph from NetBlocks showing the network connectivity in Iran, from June 10, 2025, to June 20, 2025. The y-axis represents normalized connectivity, ranging from 0% to 100%, and the x-axis represents the dates. The green line representing Iran's connectivity remains stable at around 100% until June 13 when the decline begins with a sharp drop on June 18 and a second drop on the morning of June 21, after a partial recovery on the early morning of June 21, The drop in connectivity aligns with escalating conflict by Israel. The minimum and current connectivity levels are indicated as 3% and 60%, respectively. The chart has a dark background with red horizontal arrows labeled 'SHUTDOWN' indicates the period of disruption and a red circle highlighting the decline at the end of the period.
⚠️ Update: Internet connectivity has again collapsed in #Iran following a brief period when residents could exchange messages with the outside world; Iran's nation-scale internet shutdown remains in effect, limiting access to information as the conflict with Israel continues
21.06.2025 11:37 — 👍 25 🔁 16 💬 1 📌 5