Eucalypt Australia are pleased to present Professor Patrick Baker with the Bjarne K Dahl Medal for 2026 in recognition of his significant and sustained contribution to the science of eucalypts in the fields of forest ecology and silviculture.
#NationalEucalyptDay2026 #OurEucalyptHome
22.02.2026 03:52 —
👍 14
🔁 4
💬 0
📌 0
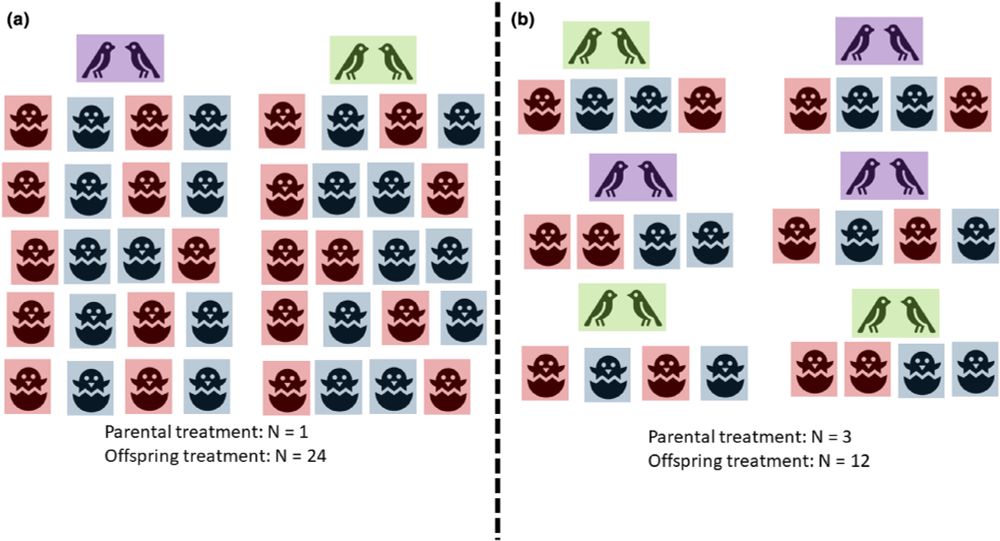
Principles of experimental design for ecology and evolution
Here I argue that we do not discuss experimental design, often until it is too late. This editorial seeks to begin a conversation about how and where to replicate appropriately.
The principles of experimental design in ecology and evolution has 20k downloads, but unfortunately I still have to reject ~20% of papers without review because they lack replication at the right level. More discussion among mentors and mentees please.
onlinelibrary.wiley.com/doi/full/10....
07.02.2026 04:57 —
👍 35
🔁 14
💬 1
📌 0

New paper out in Biological Invasions! We show that “genetic rescue” can unintentionally boost invasive fallow deer in Australia. Genomic data & simulations reveal how escaped genotypes from farms may increase pop growth & spread → key implications for management. link.springer.com/article/10.1...
15.01.2026 00:35 —
👍 23
🔁 12
💬 1
📌 0

Water sparing versus sharing: Depolarising wetland management with novel environment-agriculture policy
Land sparing centres on agricultural intensification to increase yields and free land for conservation, while land sharing integrates farming and biod…
Published today in Biological Conservation, we introduce water into the land sparing versus sharing debate, develop novel water sharing policy options for conserving threatened species in the Murray-Darling, and ask people what they think about such amendments.
www.sciencedirect.com/science/arti...
14.01.2026 06:08 —
👍 13
🔁 7
💬 1
📌 0

Crabeater seals. Source: https://www.asoc.org/learn/crabeater-seal/
Biorxiv preprint: “We report the first confirmed highly pathogenic avian influenza H5N1 virus infection in an Antarctic ice-dependent seal, the crabeater seal, and document mortality of these seals across the northern Weddell Sea during November-December 2024.” www.biorxiv.org/content/10.6...
05.01.2026 21:55 —
👍 13
🔁 7
💬 3
📌 1

Side-by-side comparison of two multi-panel bubble charts faceted by world region. The left column shows the default facet labels placed above each panel (“Africa”, “Americas”, “Asia”, “Europe”, “Oceania”). The right column shows the same charts, but the facet labels are moved inside each panel at the top-left using a negative margin. In the center, there is a title reading “Want to place your facet labels inside each panel?” with an arrow pointing right, followed by a short ggplot2 theme code snippet demonstrating how to move strip text inside the panel.
I ignored the strip.clip argument in #ggplot2 for way too long 😲
Combined with a small negative margin tweak, you can place facet labels inside each panel. A tiny trick that makes small multiples feel so much cleaner.
🔵 no manual coordinates
🔵 inherits theme styling
🔵 scales nicely when resizing
12.12.2025 12:51 —
👍 239
🔁 40
💬 7
📌 4

Jay M. Savage, witness to disappearing frogs and builder of tropical science
In the late 1980s, something began to go wrong in places that were supposed to be safe. Protected cloud forests, buffered from chainsaws and bulldozers, started losing animals that had persisted…
In the late 1980s, Jay M. Savage showed that amphibian losses in cloud forests signaled a global pattern, not isolated anomalies.
His career blended field science, institution-building, mentorship, treating extinction as evidence — noticed by those who return often enough to see absence.
29.12.2025 00:10 —
👍 40
🔁 18
💬 0
📌 0

HEY! YOU! ggdibbler 0.6.1 is finally up on CRAN!
harriet-mason.github.io/ggdibbler/in...
You can now pass random variables to any aesthetic in any ggplot geom/stat. If you can express it as a distribution, ggdibbler can plot it. It also works with ggplot extensions, like gganimate. #rstats
06.12.2025 15:16 —
👍 115
🔁 37
💬 2
📌 1

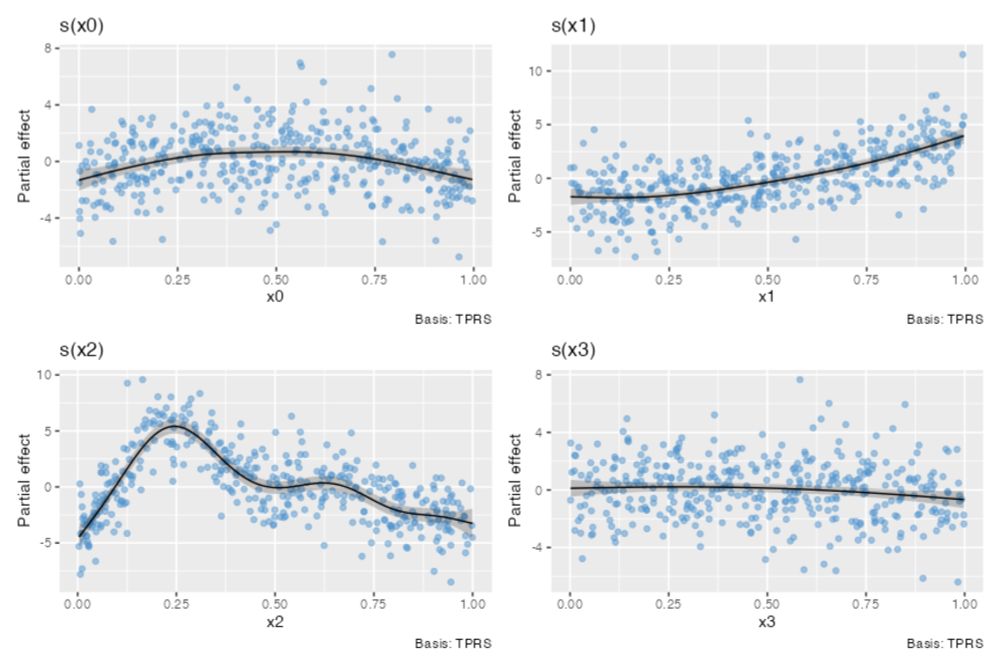
Model is:
b3 <- scasm(
y ~ s(x0, bs = "bs", k= k) + s(x1, bs = "sc", xt = "m+", k = k) +
s(x2, bs = "bs", k = k) + s(x3, bs = "bs", k = k),
family=poisson, bs=200
)
The second smooth `s(x1) is a shape constrained smooth with a positive monotonicity constraint (xt = "m+").
The `bs = 200` arguments uses 200 boostrap samples, which generates bootstrap distributions for each coefficient in the model. These bootstrap samples respect the shape constraints, while the usual +/- 2 SE credible intervals may not.
The uncertainty in the partial effects is shown by two credible interval bands; a dark blue central band is a 68% Bayesian credible interval, while the lighter blue outer interval is a 95% Bayesian credible interval.
The background of each panel is light grey with white grid lines, in a similar style to ggplot2's default theme.
A new release of the mgcv #RStats 📦 is out on CRAN and Simon Wood (U Edinburgh) has added some significant new features despite the small bump in version number:
🌟 scasm() for estimating GAMs with shape constrained smooths. Can be used with any family & smoothness selection is via the EFS method
12.11.2025 11:28 —
👍 97
🔁 24
💬 3
📌 5

GitHub - hadley/genzplyr: dplyr but make it bussin fr fr no cap
dplyr but make it bussin fr fr no cap. Contribute to hadley/genzplyr development by creating an account on GitHub.
Do you teach #rstats? Do your students complain about how lame and old-fashioned dplyr is? Don't worry: I have the solution for you: github.com/hadley/genzp....
genzplyr is dplyr, but bussin fr fr no cap.
06.11.2025 23:25 —
👍 460
🔁 167
💬 42
📌 55
any other Aussies annoyed at the new BoM website? they've made it look like the app, which is good for mobile but terrible information density on desktop, and now it takes extra clicks to get to the forecast rather than today's weather.
RETVRN to compact monospace text weather forecasts!!
23.10.2025 03:11 —
👍 7
🔁 1
💬 2
📌 0

Welcome to the world Aevipertidus gracilis - the gracile one from a lost age. 14-19 Mya ancient #NewZealand appears to have had a bowerbird. Check out this amazing research mahi led by Elizabeth Steell (www.tandfonline.com/doi/full/10....). Artwork by Sasha Votyakova/Te Papa CC-BY-SA. 1/9 🧵
22.10.2025 20:43 —
👍 28
🔁 13
💬 1
📌 1
Google developer #1: "That's it. Our search engine is simple, efficient, and reliable. It's perfect. We're done."
Google developer #2, presumably: "But wouldn't it be *more* perfect if the first search result was always a robot who mansplained your search results to you incorrectly?"
01.09.2025 01:58 —
👍 5566
🔁 802
💬 142
📌 44
🚀 gratia 0.11.1 is out!
Compatibility with ggplot2 4.0.0 + usability improvements + bug fixes.
#Rstats #mgcv #gam #statistics
25.08.2025 12:25 —
👍 28
🔁 2
💬 1
📌 1

Conceptual overview of the deepSSF neural network used to predict animal movement.
📖Published📖
Forrest et al. present deepSSF, an approach to fit and predict animal movement data using deep learning 🐃 🌍 🧪 Read the full article here 👇
buff.ly/BWQ3Oni
22.08.2025 11:02 —
👍 15
🔁 8
💬 1
📌 0
An R package for working with generalized additive models
Graceful 'ggplot'-based graphics and utility functions for working with generalized additive models (GAMs) fitted using the 'mgcv' package.
🚀 gratia 0.11.0 is out!
Now has a paper in JOSS — please cite 📄 doi.org/10.21105/jos...
Experimental parallel processing ⚡
New assemble() for building plots 🎨
Better support for complex families + new diagnostics 🧪
Lots of bug fixes + polish ✨
👉 gavinsimpson.github.io/gratia/
#Rstats
18.08.2025 18:32 —
👍 185
🔁 63
💬 3
📌 1

Article on BBC news.
Title: AI designs antibiotics for gonorrhoea and MRSA superbugs
Description: Two new potential drugs have been designed by AI to kill drug-resistant bacteria, in a major Massachusetts Institute of Technology study.
I really dislike how science has started calling almost any fancy computational technique AI. 🧪
The framing of this entire article makes it sound like a benevolent AI independently made these drugs.
That is *pure fantasy*.
Instead: a team of scientists made a machine learning model for a study.
15.08.2025 06:14 —
👍 2274
🔁 702
💬 57
📌 55

I wish to speak with whomever is responsible for the frankly bizarre distribution of the Slender-billed Gull (C. genei). What nonsense is this?!
14.08.2025 06:26 —
👍 34
🔁 3
💬 2
📌 0
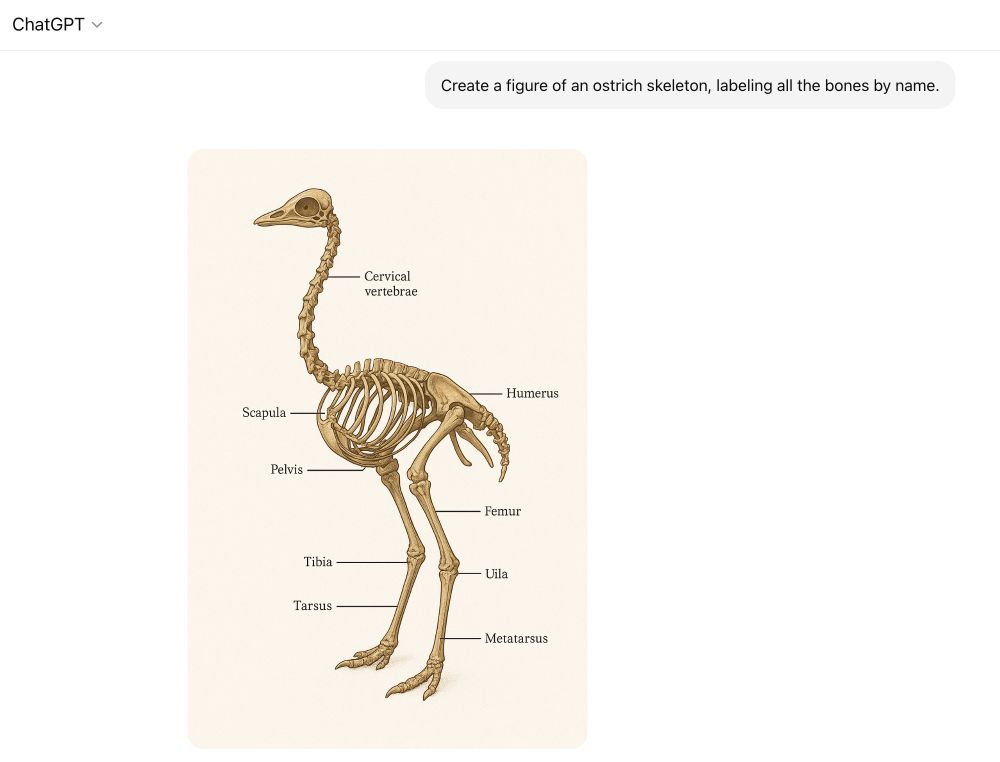
Grade F level diagram of an ostrich skeleton. The pelvis is labelled as a humerus, and sternum appears to be labeled as the pelvis.
The team of Ph.D. level experts in ChatGPT apparently doesn't include any anatomists.
13.08.2025 22:06 —
👍 271
🔁 59
💬 29
📌 14

We’re wildly excited to welcome Rob Davis (@pezoporus.bsky.social) as the new Editor-in-Chief of #PacificConsBio!
Rob leads the #WildlifeLab at Edith Cowan University, where his team studies #birds, #reptiles, & #mammals to better understand the impacts of #fire, #feralpredators & #habitatloss
08.08.2025 00:30 —
👍 15
🔁 5
💬 1
📌 1

Data-driven research prioritisation example—sampling design for the bare-nosed wombat (Vombatus ursinus) in New South Wales, Australia, based on observation and specimen data from GBIF. (A) Value of Information (VOI) map showing expected information gain from additional sampling (darker blue = higher gain), calculated using a binomial model of annual observations in each 50 km grid, with expected information gain calculated using Kullback–Leibler divergence between current and updated probability distributions after simulated sampling. (B) Need for Information (NFI) map based on habitat loss percentiles (darker green = greater habitat loss), derived from the Habitat Condition Assessment System. (C) Cost of Information (COI) map using the Australian Bureau of Statistics' remoteness classification system (darker purple = metropolitan areas with higher accessibility and lower expected sampling costs). (D) Consensus diagram—VOI-NFI quadrant analysis revealing priority sampling locations (upper right quadrant) where both information value and ecological need are high. In Panel A, grid cells (50 km) with insufficient data appear in grey (fewer than 2 total observations per grid). See Data S1 for details on methodology, data sources, and implementation.
Our new Ecology Letters paper shows how natural history collections can use Bayesian decision theory & VOI to transform sampling and resourcing. Moving beyond taxonomy-focused collecting to strategic approaches, maximising impact for climate science, genomics & conservation
doi.org/10.1111/ele.70188
04.08.2025 01:53 —
👍 7
🔁 3
💬 1
📌 0
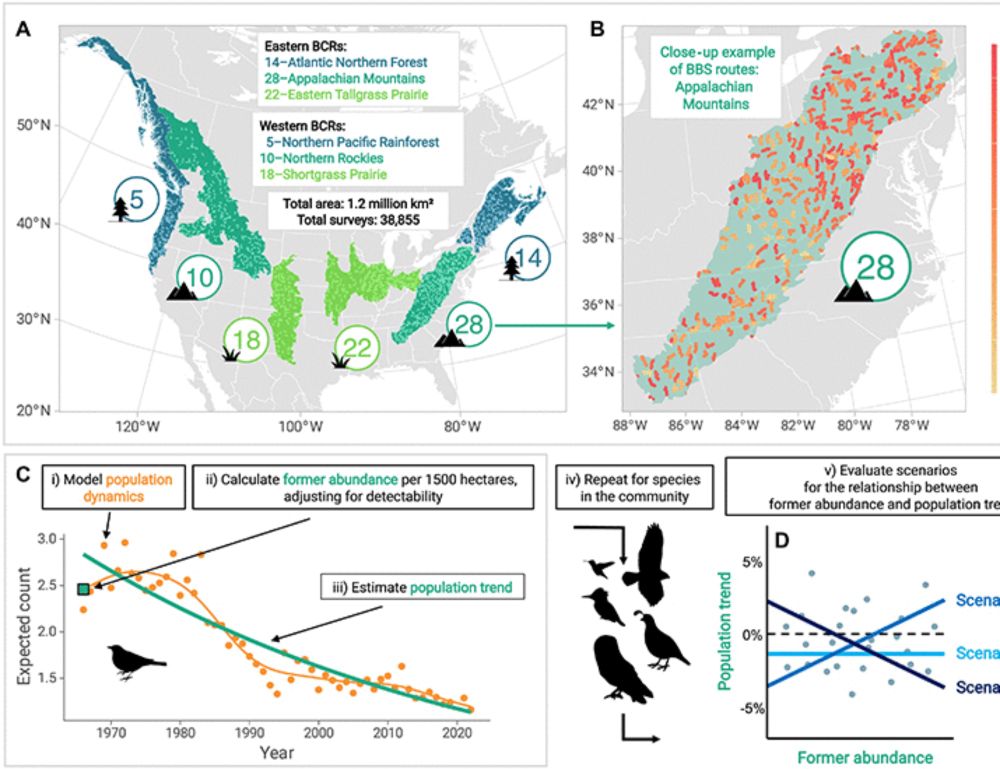
North American bird declines are driven by reductions in common species
Declines in North American birds are driven not by rare species vanishing but by sharp losses among formerly common species.
🚨 First PhD chapter is out! My work thus far, with @andy2dobson.bsky.social
We found that formerly common species have declined the fastest, on average.
📄 North American bird declines are driven by reductions in common species | Science Advances www.science.org/doi/10.1126/...
31.07.2025 03:18 —
👍 165
🔁 88
💬 3
📌 3
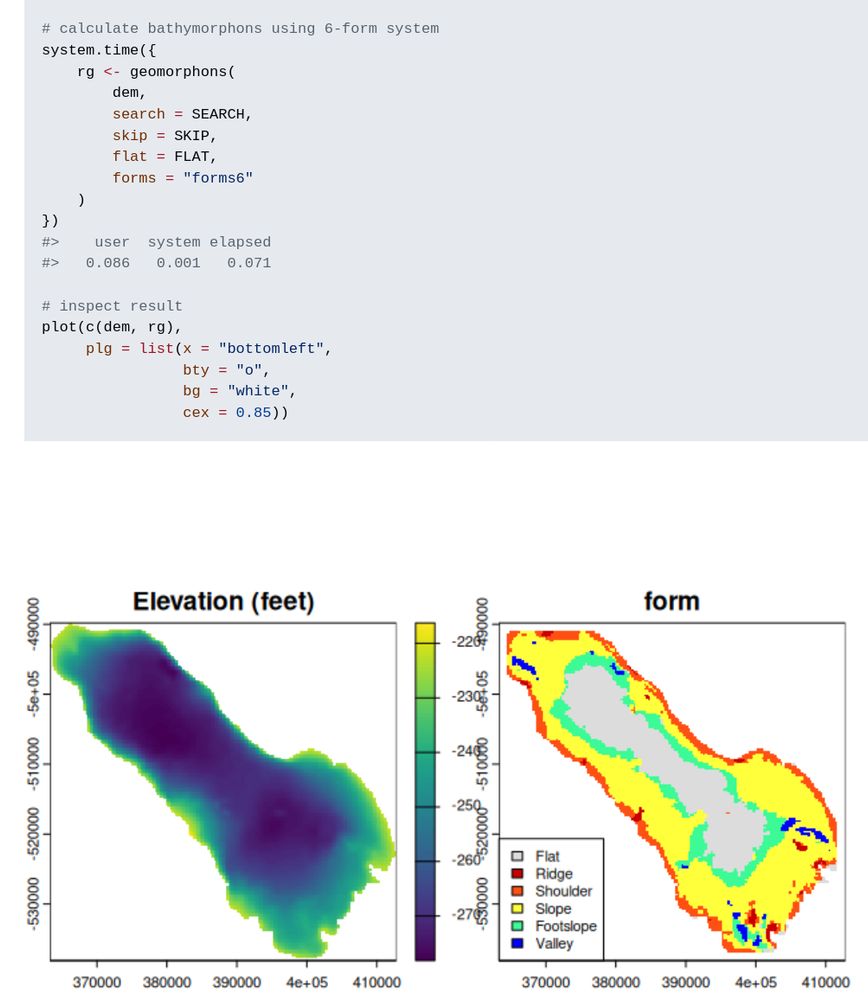
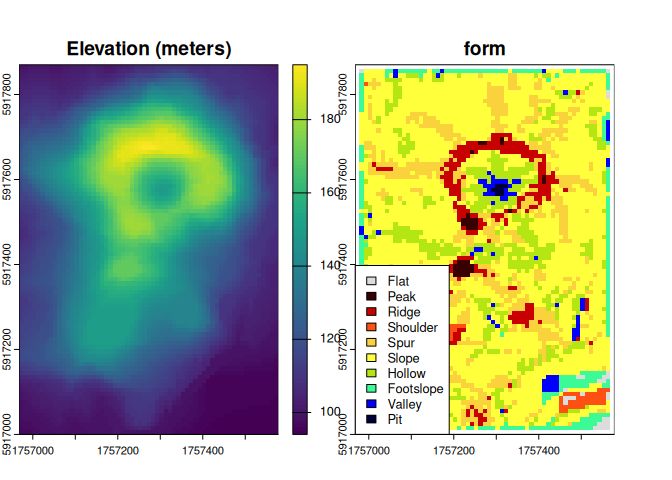
New R package: rgeomorphon 📦 by Andrew Brown
Classifies terrain forms using a parallel C++ implementation of the geomorphon algorithm.
🔗 github.com/brownag/rgeo...
#RStats #GIS #TerrainAnalysis #RemoteSensing #RSpatial
30.07.2025 14:02 —
👍 18
🔁 7
💬 0
📌 0
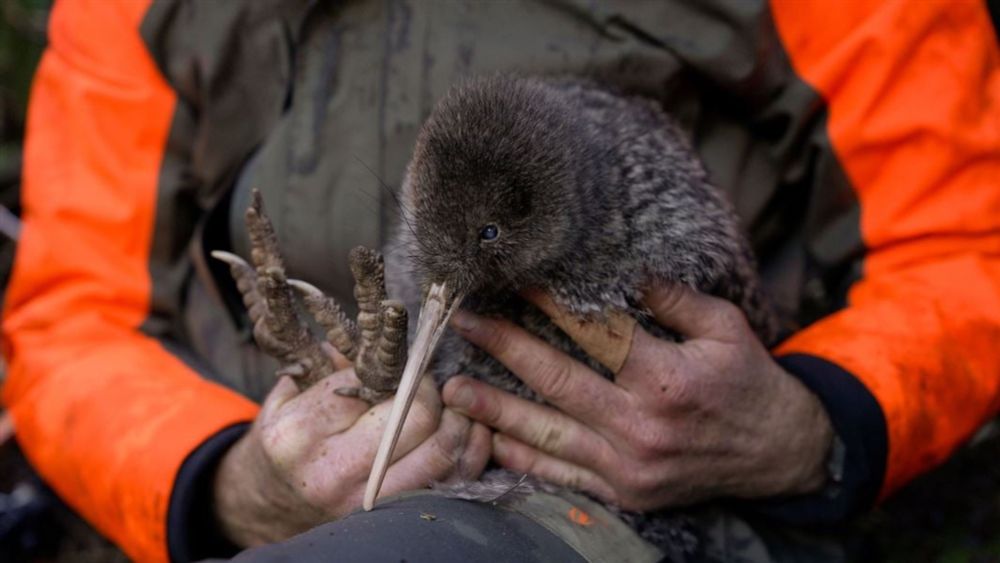
Shock kiwi rediscovery delights conservation world
Kiwi pukupuku/little spotted kiwi have been rediscovered in the wild on mainland Aotearoa for the first time in 50 years, shocking and delighting conservationists.
Huge news! Having spent a while studying #kiwi pukupuku, this got me very excited. Finding a remnant mainland population of LSK is probably more significant than finding more #kakapo. Huge respect to those involved and particularly the hunter who found them.
www.doc.govt.nz/news/media-r...
25.07.2025 06:29 —
👍 316
🔁 84
💬 5
📌 5