Congratulations to @gcdatavis.bsky.social master’s student Hyojin Yoo, who was named an elections data visualization developer at The Associated Press! www.ap.org/the-definiti...
05.11.2025 16:23 — 👍 5 🔁 2 💬 0 📌 0
@gcdatavis.bsky.social
The M.S. Program in Data Analysis and Visualization @The Graduate Center, CUNY | Data Analysis | Data Study | Data Visualization | Data Ethics
Congratulations to @gcdatavis.bsky.social master’s student Hyojin Yoo, who was named an elections data visualization developer at The Associated Press! www.ap.org/the-definiti...
05.11.2025 16:23 — 👍 5 🔁 2 💬 0 📌 0Check the link: gc.cuny.edu/data-analysis-and-visualization/admissions-and-aid for more information on admissions. We look forward to reading your applications!🙂
#cuny #gradschool #datavisualization #dataanalysis #application

📣Just a reminder! Applications to join our M.S. Program in Data Analysis and Visualization for Spring 2026 enrollment are due tomorrow, Saturday, November 1st.
31.10.2025 18:09 — 👍 2 🔁 0 💬 1 📌 1Happening today!! See you all soon ☺️
06.10.2025 13:46 — 👍 0 🔁 0 💬 0 📌 0
The Program Director and advisors will be on-hand to take your questions about all aspects of the program, as well as the application process.
Please RSVP using the QR code above or through the link below! We look forward to meeting you all soon🙂

#dataanalysis #datavisualization #gradschool #openhouse
The M.S. in Data Analysis and Visualization Program Open House is only a week away!
Prospective students interested in our program are welcome to join us via Zoom on Monday, October 6th from 6-7 PM.


🚀 Book in progress: Spatial Data Visualization with tmap
A guide to creating thematic maps in R with the tmap package.
Covers everything from loading data to interactive and animated maps, with reproducible code.
Read online: tmap.geocompx.org
#rstats #rspatial #geocompx #gischat #maps

A screenshot of the table of contents, reading: Preface Introduction: A History of Visualization and Power Chapter 1 Data: The Society for Effecting the Abolition of the Slave Trade and Responsible Visualization Design Before there are data, there are people. How can the lives behind the data guide our visualization work? Chapter 2 Image: William Playfair and the Politics of the “Simple View” Visualization has never been neutral or objective. How can we learn to recognize the human decisions that shape each design? Chapter 3 People: Shanawdithit and our Place in the Colonial Frame Maps, like all visualizations, tell stories. How can we learn to see the lines of power that they draw? Chapter 4 Knowledge: Elizabeth Palmer Peabody and the Idea of Epistemology Visualization can produce knowledge in many ways. What ideas do we gain when we expand our view of the past? Chapter 5 Change: Lula Iola Mack, W.E.B. Du Bois, and the Path to Liberatory Data Visualization Visualization can bear powerful witness to oppression. How can we use charts to make change in the world? Chapter 6 Labor: Data by Design and What We Learn from Visualization Work By Margy Adams and Tanvi Sharma, with Shiyao Li, Jay Varner, and Lauren Klein Any visualization project is the work of many hands. How can we surface the significance of this labor? Epilogue Acknowledgements Notes
A few days ago, amidst everything else, I pressed send on the book I've been working on (and off) for over a decade. It's still a long way from finished, but the final phase has begun. Watch for DATA BY DESIGN: FROM THE HISTORY OF VISUALIZATION TO THE FUTURE WE NEED in print and online in Fall 2026!
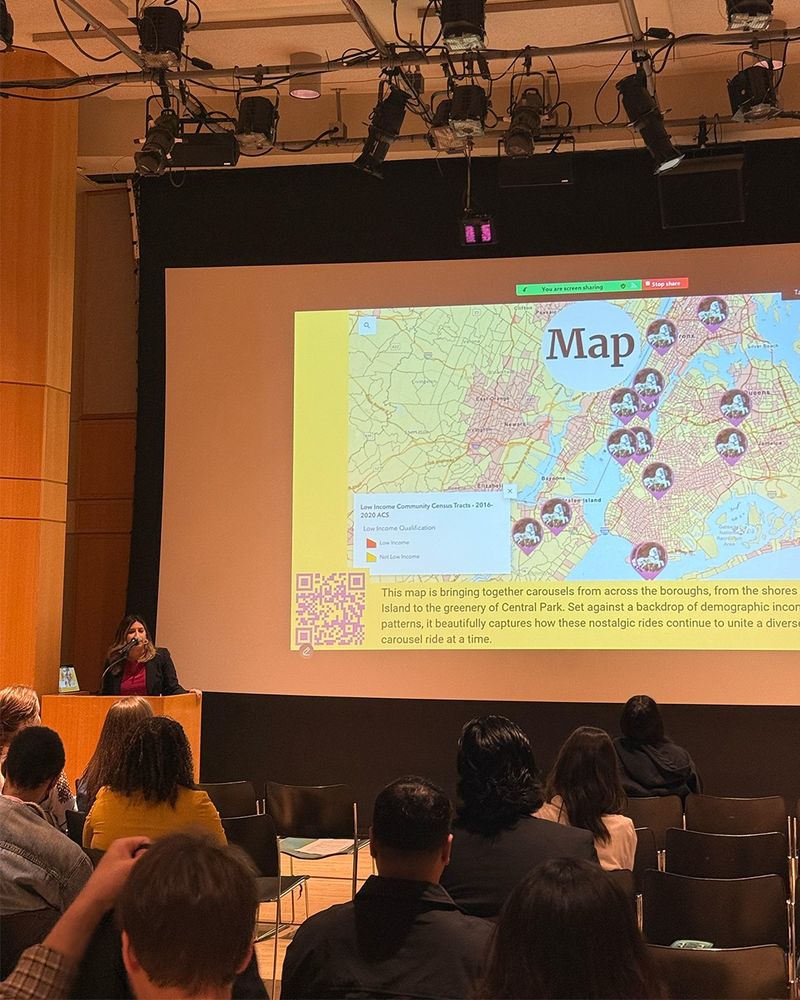
15.09.2025 13:43 — 👍 100 🔁 17 💬 7 📌 1This interactive digital exhibit visualizes carousel locations throughout New York City and features practical information such as fee structures, neighborhood demographics, and more. Check out this wonderful project here: www.carouselsofnyc.com and find out more about the story of carousels in NYC.
20.08.2025 21:35 — 👍 0 🔁 1 💬 0 📌 0Last semester, Kelly Karst, Julissa Russo, Carla Ordonez, and Leonard Santos worked with Professor Bret Maney from our class Digital Humanities: Methods and Practices to develop this wonderful project, and successfully presented it at the CUNY Graduate Center Digital Showcase.
20.08.2025 21:35 — 👍 0 🔁 1 💬 1 📌 0


#digitalproject#digitalhumanities#datavisualization
Carousels of NYC🎠
What’s your first memory of carousels?
Carousels evoke joy and nostalgia, drawing people across diverse backgrounds, yet their placement is often restricted to wealthier neighborhoods, limiting accessibility for many communities.
100 years of July temperature anomalies over land areas through 2025...
Data from NOAAGlobalTemp v6.0.0: www.ncei.noaa.gov/products/lan...
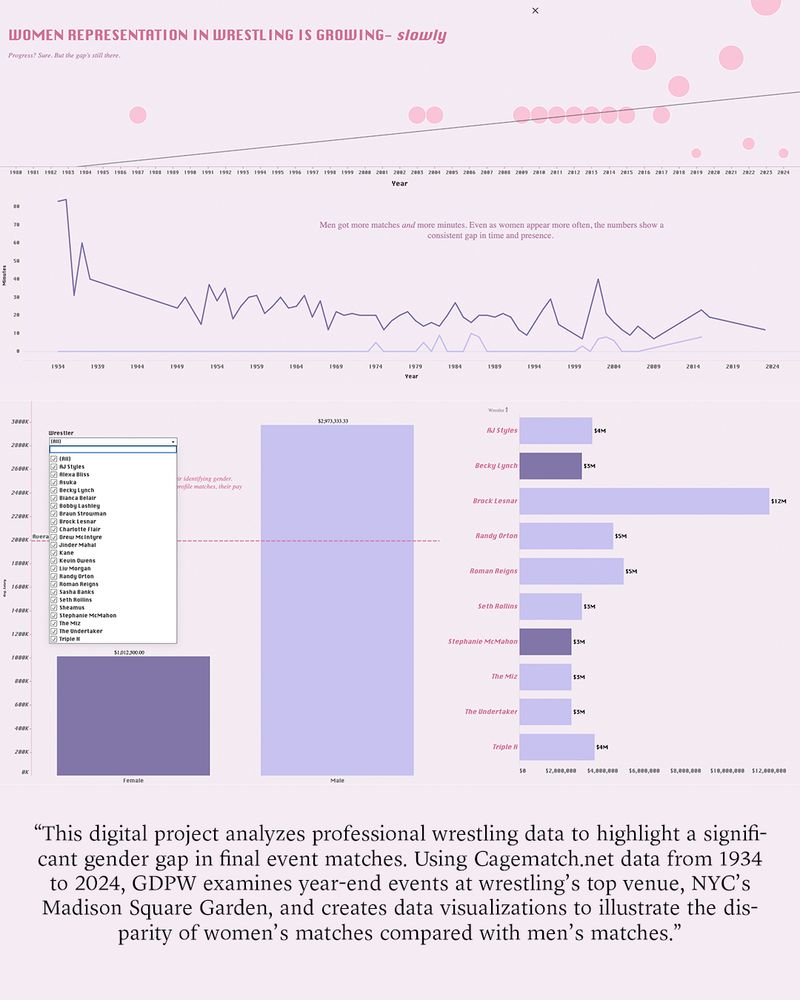
created data visualizations to illustrate the disparity of women’s matches compared with men’s matches. Check out this wonderful project here: gdprowres.com and see how rare women’s matches still are!
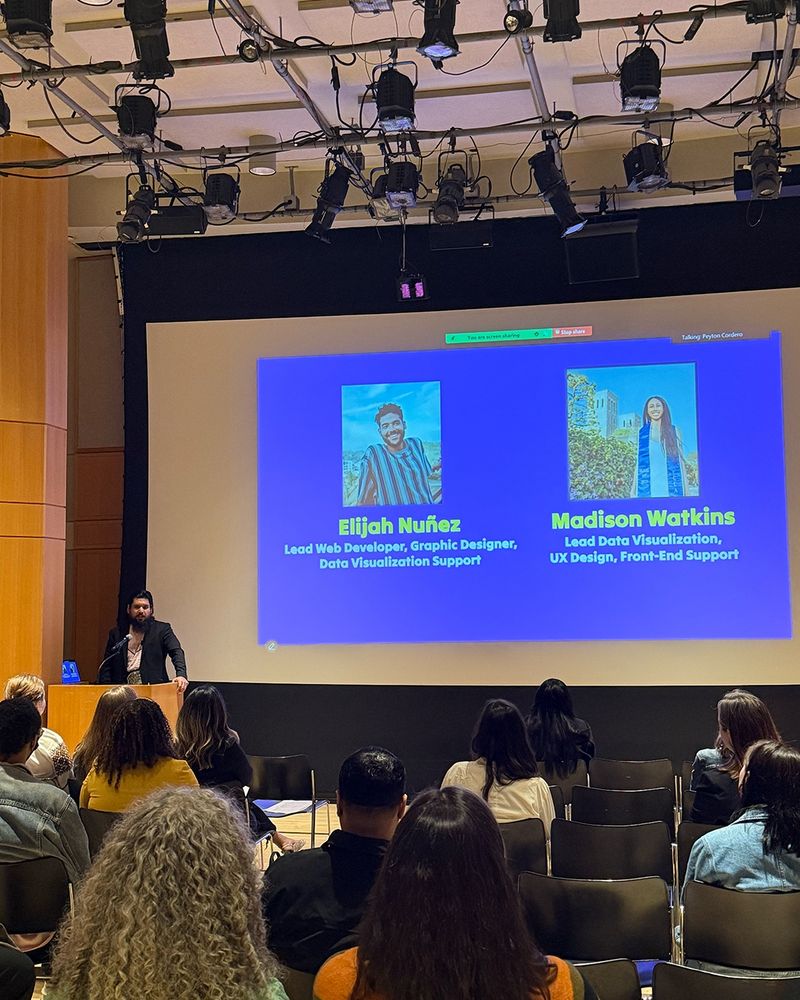
13.08.2025 21:02 — 👍 0 🔁 1 💬 0 📌 0Women’s matches have been held since wrestling’s earliest days, but they have been and still are significantly underrepresented. Last semester, Martin Bueno, Cathy Melamed, Madison Watkins, and Elijah Nunez, working with Professor Bret Maney from our class Digital Humanities: Methods and Practices,
13.08.2025 21:02 — 👍 0 🔁 1 💬 1 📌 0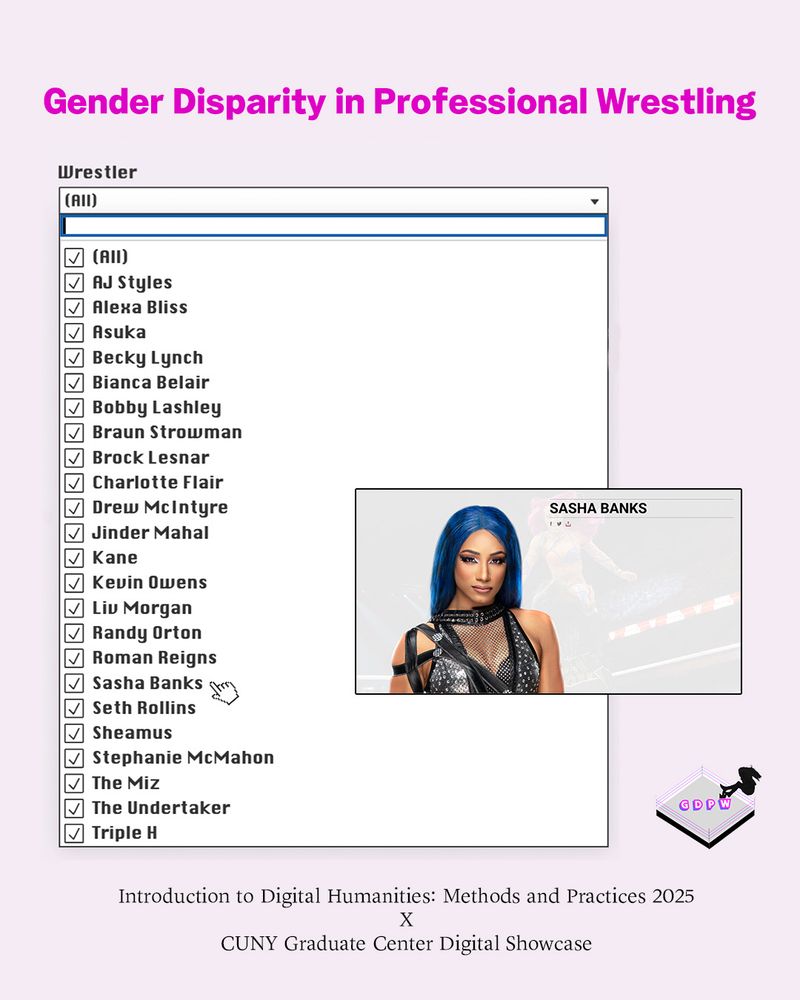
#digitalproject#digitalhumanities
Gender Disparity in Professional Wrestling (GDPW) 🤼♀️
What are some of the greatest women's professional wrestling matches you've ever seen?
Professional wrestling has thrilled audiences for over a century, evolving from radio broadcasts to TV and digital streaming.
Check out this wonderful project here: womenofbandura.github.io/women-of-ban... and see how the WOB is educating new generations of bandura players in the U.S.!
06.08.2025 21:19 — 👍 1 🔁 1 💬 0 📌 0Last semester, @womenofbandura.bsky.social team from our class Digital Humanities: Methods and Practices developed this digital archive project. Created in collaboration with WBENA, the project highlights the contribution of women, who were traditionally excluded from playing the bandura.
06.08.2025 21:19 — 👍 1 🔁 1 💬 1 📌 0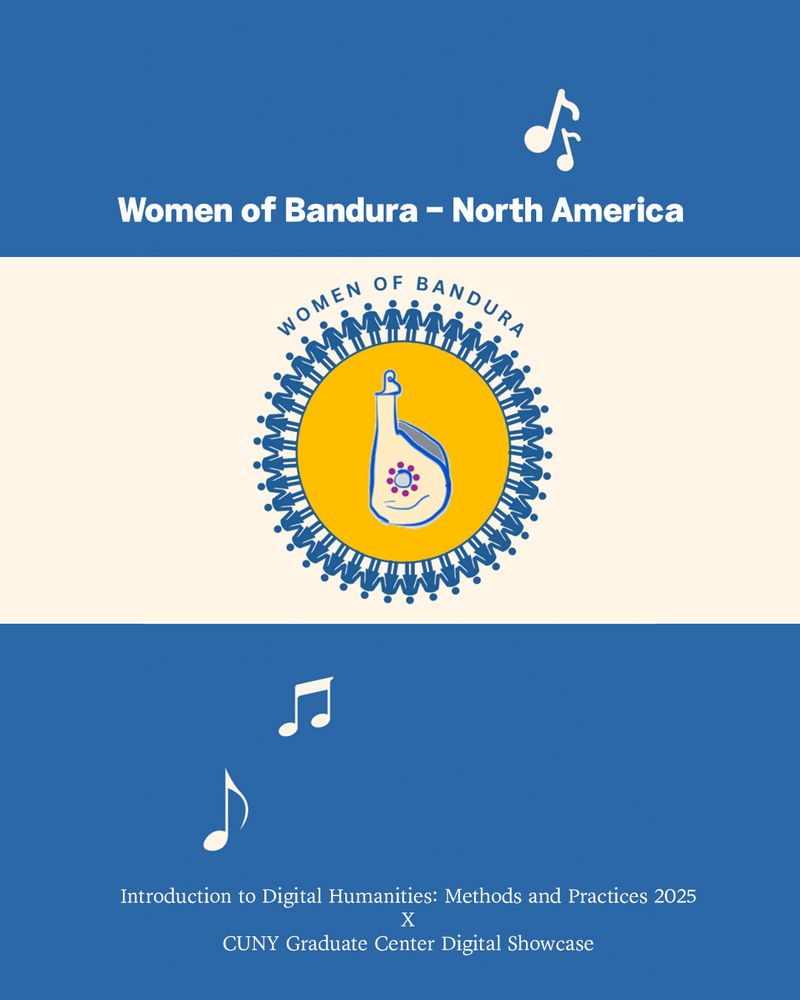

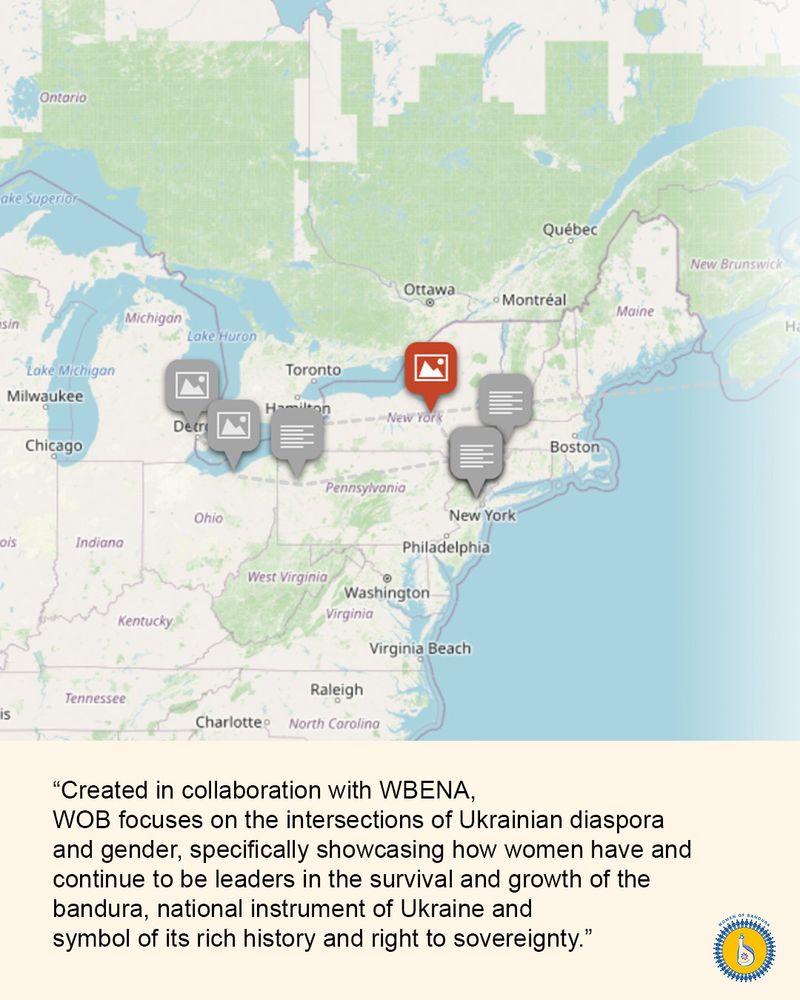
Women of Bandura🎵
What is the name of the instrument that has been synonymous with Ukrainian identity? Hints are in the image!
Women have and continue to play a vital role in advancing the rich history represented by the instrument that has been synonymous with Ukrainian identity.
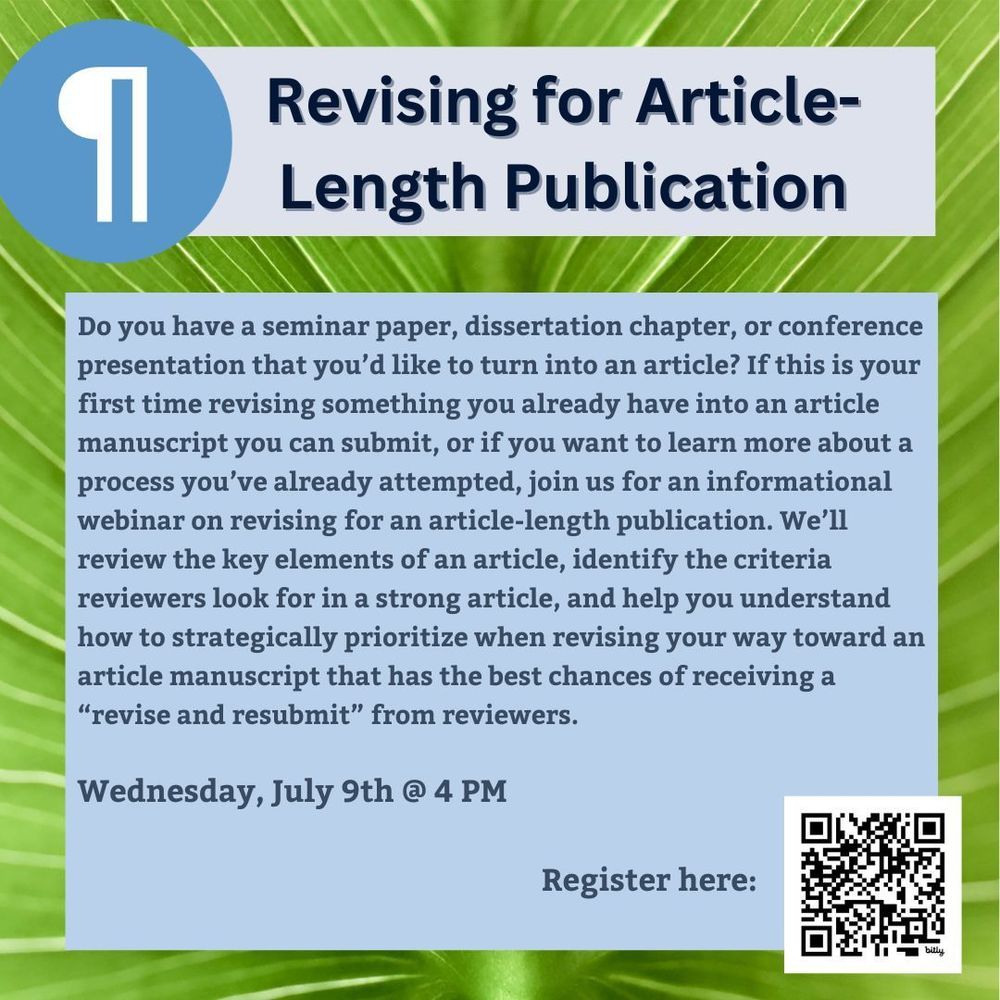
Do you have a seminar paper, dissertation chapter, or conference presentation that you’d like to turn into an article? If this is your first time revising something you already have into an article manuscript you can submit, or if you want to learn more about a process you’ve already attempted, join us for an informational webinar on revising for an article-length publication. We’ll review the key elements of an article, identify the criteria reviewers look for in a strong article, and help you understand how to strategically prioritize when revising your way toward an article manuscript that has the best chances of receiving a “revise and resubmit” from reviewers.
Academic writers often revise existing work to produce articles, a task that means asking challenging questions about structure and content. Join us next week for a workshop @thegraduatecenter.bsky.social that will help get you started! Use the QR code below or go to our website: buff.ly/AU3u8Re
02.07.2025 13:10 — 👍 3 🔁 3 💬 0 📌 0
🚀 Encounters in the Milky Way is based on authentic data from the European Space Agency’s Gaia mission, which mapped ~2 billion stars in our galaxy. Book your tickets to explore the cosmos today: bit.ly/44KMGrc
09.06.2025 15:37 — 👍 9 🔁 3 💬 0 📌 0
I wrote a piece on data visualization specifically with Observable JavaScript if of interest www.infoworld.com/article/2336...
30.06.2025 02:03 — 👍 7 🔁 2 💬 1 📌 0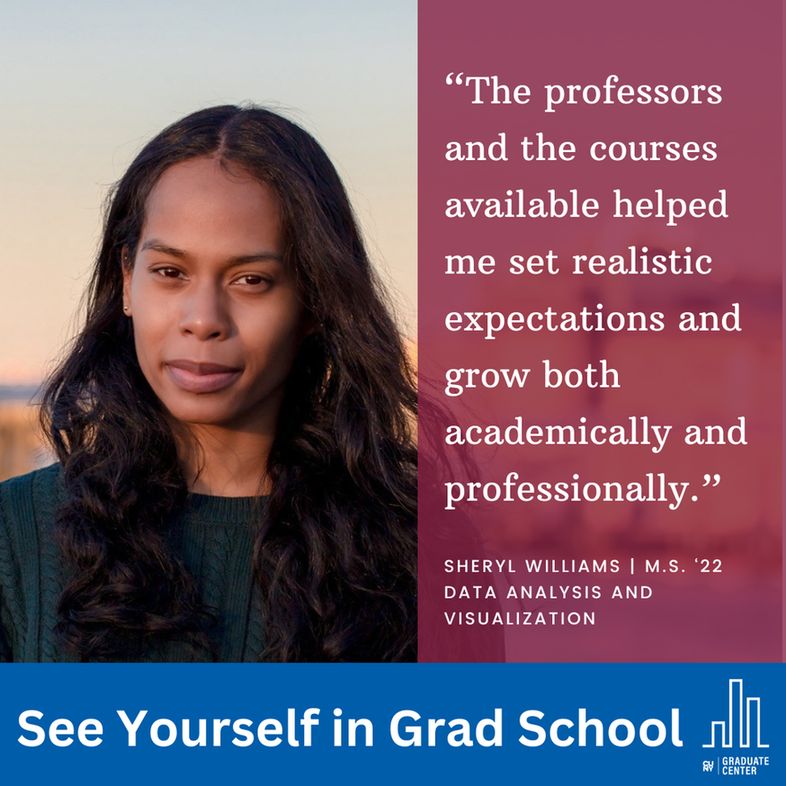
“The professors and the courses available helped me set realistic expectations and grow both academically and professionally.” Sheryl Williams | M.S. ‘22 Data Analysis and Visualization
In the Data Analysis and Visualization master’s program, Sheryl Williams learned how to present complex data in an accessible, visually compelling manner, boosting her career. See what a master’s degree in Data Analysis and Visualization can do for you www.gc.cuny.edu/data-analysi...
25.05.2025 12:12 — 👍 2 🔁 2 💬 0 📌 0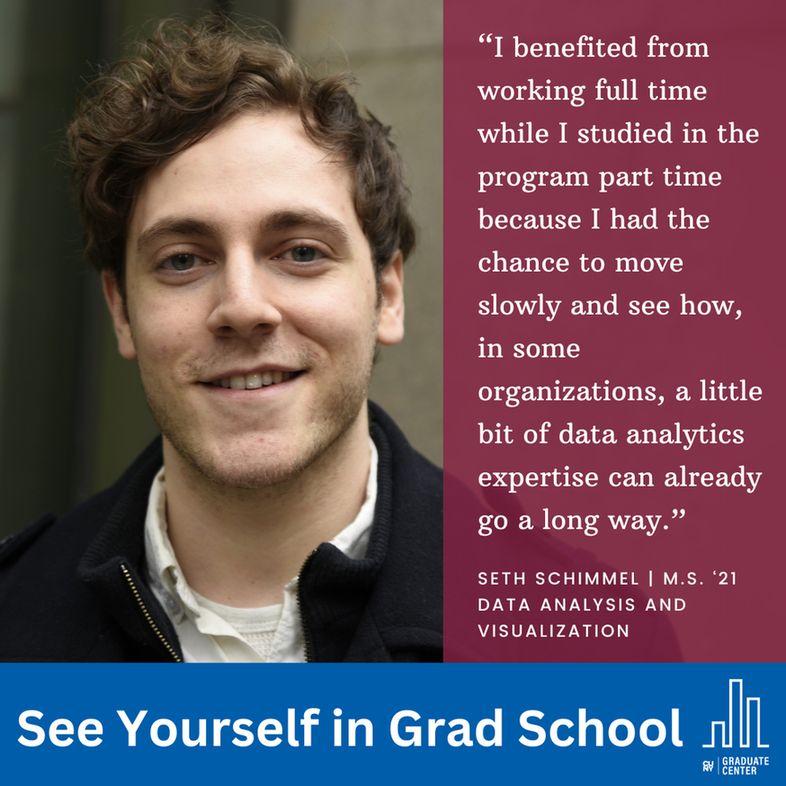
“I benefited from working full time while I studied in the program part time because I had the chance to move slowly and see how, in some organizations, a little bit of data analytics expertise can already go a long way.” Seth Schimmel | M.S. ‘21 Data Analysis and Visualization
As a student in the Data Analysis and Visualization master’s program, Seth Schimmel learned how to communicate effectively with data. This helped him get hired as a data support associate. See what a master’s degree in Data Analysis and Visualization can do for you www.gc.cuny.edu/data-analysi...
18.05.2025 12:02 — 👍 4 🔁 2 💬 0 📌 0
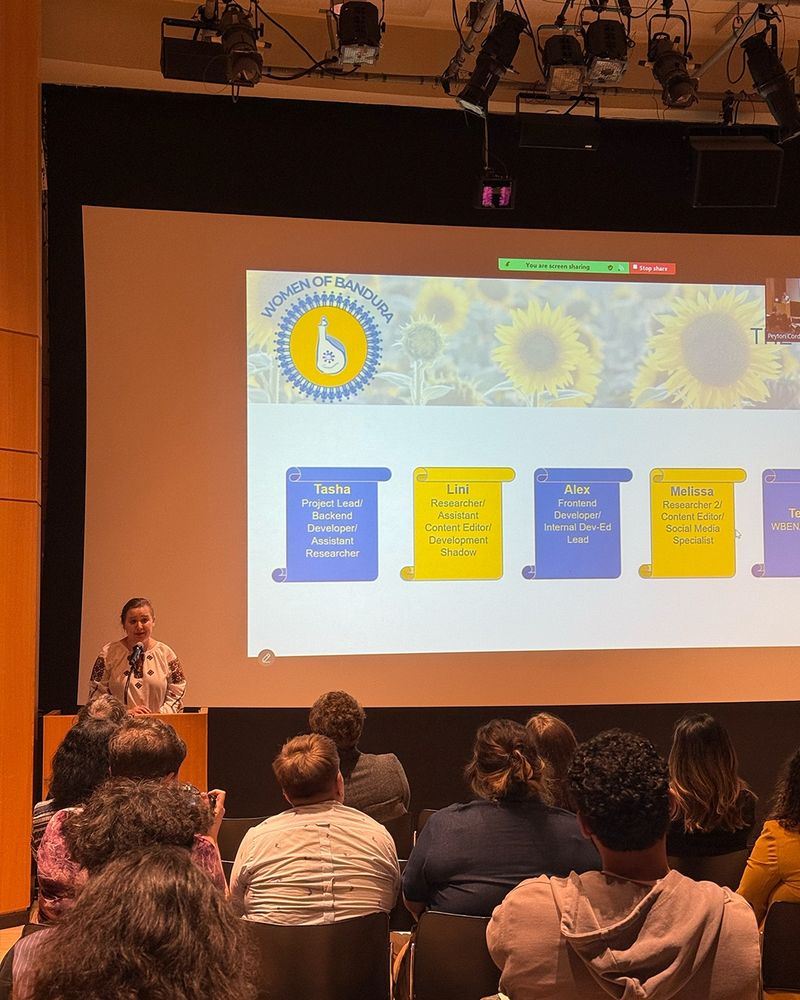
Women of Bandura Launch Photo of Alex, Melissa, Tasha, and Lini smiling after GC Digital Showcase Screen grab of WOB homepage
Earlier this week the team presented the first iteration of Women of Bandura at the CUNY GC Digital Showcase @gc-dh.bsky.social. Please check out the site and stay tuned for future updates! womenofbandura.github.io/women-of-ban...
16.05.2025 01:37 — 👍 5 🔁 2 💬 0 📌 0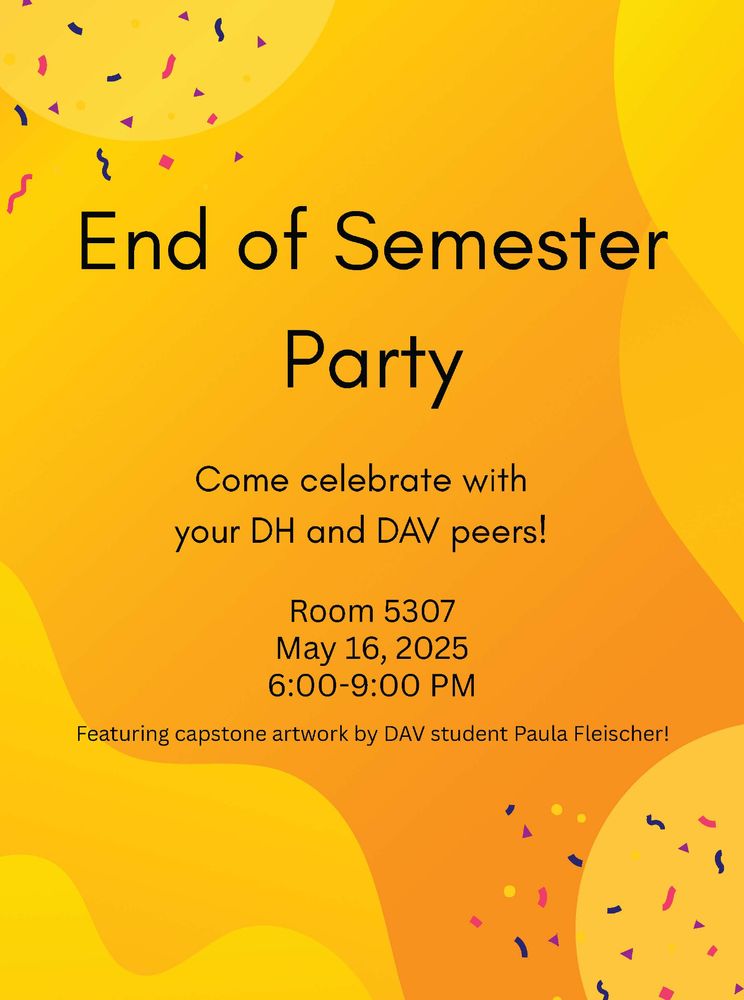
📊💽✏️We will gather to celebrate the scholarly and creative energy we have been full of this semester! Thank you to our community of students, faculty, alumni, and friends for making this semester amazing. Can't wait to see you all at 6:00PM-9:00PM in Room 5307 tomorrow🥳 @gcdatavis.bsky.social
16.05.2025 01:20 — 👍 0 🔁 1 💬 0 📌 0Thank you to everyone who joined us this Tuesday, thank you @cunygcdi.bsky.social, and please stay tuned to our future posts sharing each team’s wonderful digital projects😊
15.05.2025 15:31 — 👍 0 🔁 0 💬 0 📌 0

Three amazing teams from our M.A. in Digital Humanities Program @gc-dh.bsky.social and M.S. in Data Analysis and Visualization Program successfully presented at the GC Digital Showcase at Martin E. Segal Theatre Center!
15.05.2025 15:31 — 👍 4 🔁 2 💬 1 📌 0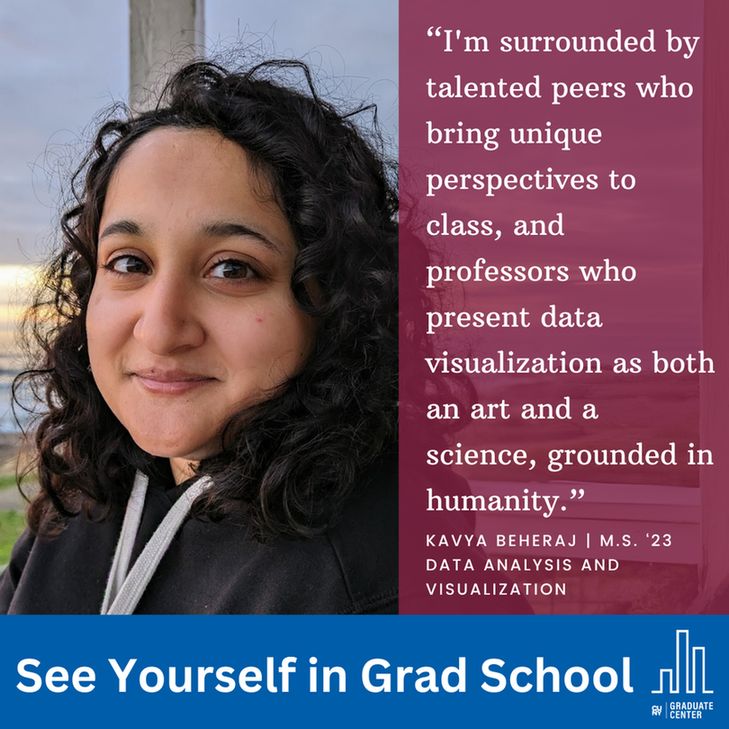
“I'm surrounded by talented peers who bring unique perspectives to class, and professors who present data visualization as both an art and a science, grounded in humanity.” Kavya Beheraj | M.S. ‘23 Data Analysis and Visualization
Kavya Beheraj joined the Data Analysis and Visualization program as a part-time student. That experience helped her land a job as a Visual Journalist at Axios. See what a master’s degree in Data Analysis and Visualization can do for you www.gc.cuny.edu/data-analysi...
11.05.2025 12:41 — 👍 3 🔁 1 💬 0 📌 0Come join us to check out wonderful digital projects from our students!
12.05.2025 20:46 — 👍 0 🔁 0 💬 0 📌 0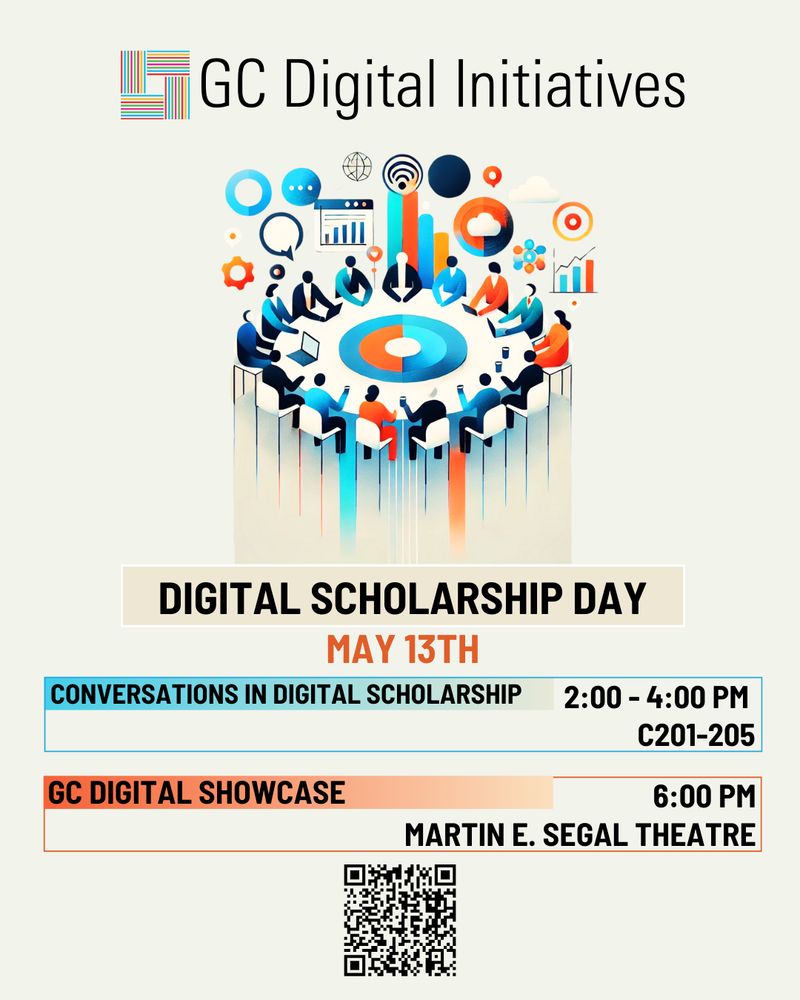
Mark your calendars for Digital Scholarship Day! On May 13th at 2pm, the DFs we will engage with participants in the "Conversations in Digital Scholarship", then at 6pm the GC community is invited to the GC Digital Showcase! GC community please register at gc-cuny-edu.zoom.us/meeting/regi...
09.05.2025 14:55 — 👍 0 🔁 2 💬 1 📌 0