
One of the toughest losses of 2024 that still doesn't make sense was losing Jarlath a year ago today. Our research projects, UVM, the geospatial community, and Vermont as a whole just aren't the same without him. Appreciated reading this in memoriam piece by 7D www.sevendaysvt.com/arts-culture...
06.01.2025 19:52 —
👍 6
🔁 1
💬 0
📌 0

Reproducible Data Science in R: Flexible functions using tidy evaluation. Improve your functions with helpful dataframe evaluation patterns! waterdata.usgs.gov/blog/rds-fun... #rstats
17.12.2024 16:38 —
👍 33
🔁 9
💬 0
📌 1
Enjoyed the talk!
11.12.2024 01:05 —
👍 2
🔁 0
💬 0
📌 0


Thanks everyone for a lovely discussion yesterday at the orals #Hydrometeorological #extremes 🌊💧☀️🔥 today we continue with the posters ALL DAY ⭐️ Come chat with our amazing presenters in Hall B-C #AGU24 @gabrielevillarini.bsky.social, Laurie Hunning and I are also around 😊
10.12.2024 14:25 —
👍 6
🔁 1
💬 0
📌 0

Alright, got the siphon setup to keep the 🎄tree watered so think I’m now finally ready to head to DC for #AGU24! Looking forward to first AGU in person in 6 years! Presenting on USGS work on ML for streamflow drought prediction tomorrow morning — come say hi!
08.12.2024 18:48 —
👍 7
🔁 1
💬 0
📌 0

A tile map of the U.S. showing streamgages by flow levels through the month of November 2024. For each state, an area chart shows the proportion of streamgages in wet, normal, or dry conditions. Streamflow conditions are quantified using percentiles comparing the past month’s flow levels to the historic record for each streamgage. During the month of November, much of the Eastern U.S. saw dry conditions for states such as Delaware, Rhode Island, Connecticut, and New Jersey. Concurrently, Missouri, Oklahoma, and Kansas saw wet conditions.
November #streamflow conditions across the U.S. 💧
Dry conditions persisted for much of the Eastern U.S. while parts of the Central U.S. saw wet conditions.
#DataViz made with #rstats #dataRetrieval
github.com/DOI-USGS/flo...
05.12.2024 17:58 —
👍 8
🔁 2
💬 1
📌 0
Streamflow drought can have multiple meanings which makes communication challenging — this simple website is a great reference and explainer for understanding how we define streamflow drought
04.12.2024 16:57 —
👍 1
🔁 0
💬 0
📌 0

A map of Vermont with streamgage locations color coded by their current streamflow category (how current conditions compare to historical conditions)
hyswap can also be used to calculate streamflow conditions data that can easily be viewed in interactive maps. Check out our sample notebooks: doi-usgs.github.io/hyswap/examp...
22.11.2024 18:43 —
👍 1
🔁 0
💬 1
📌 0

Example graphic showing streamflow magnitudes from 2024 compared to historical percentile values.
We have lots of examples including jupyter notebooks for calculating streamflow percentiles and generating figures such as streamflow duration hydrographs doi-usgs.github.io/hyswap/examp...
22.11.2024 18:43 —
👍 0
🔁 0
💬 1
📌 0

hyswsp hex with a line chart design
Introducing hyswap: A python package for understanding local- to national-scale stream flow data with historic context waterdata.usgs.gov/blog/introdu... #python #WaterData
22.11.2024 17:48 —
👍 6
🔁 1
💬 0
📌 0
Always enjoy having you play Burlington, VT!
21.11.2024 17:24 —
👍 1
🔁 0
💬 0
📌 0
Maybe now it‘s a good time to tell you agIn that I am searching for Phds (2 positions, fully funded, 4 years, Austria)
18.11.2024 21:42 —
👍 12
🔁 8
💬 0
📌 0
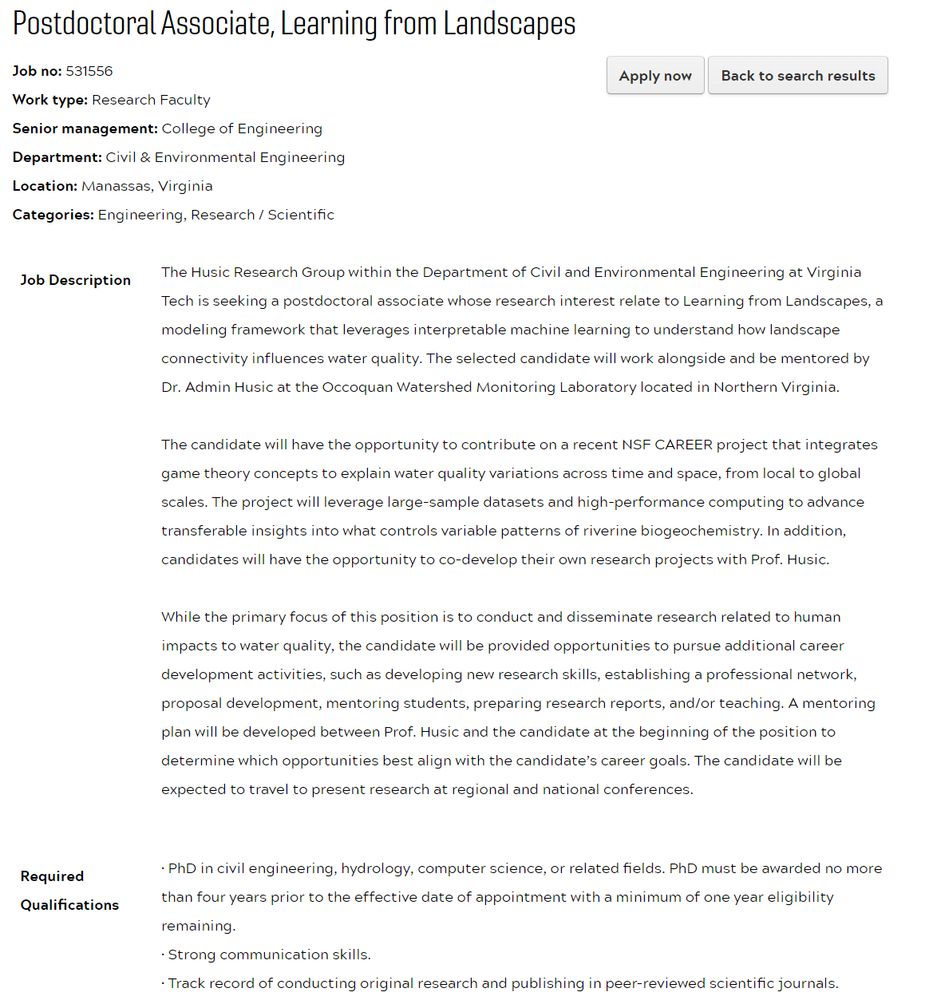
I have an opening for a 2-year postdoc fellowship at #VTCEE on large-sample hydrology, water quality, and eXplainable AI to start next year. The position is in NoVA, close to DC with many opportunities for work and play. Please share broadly! Listing here careers.pageuppeople.com/968/cw/en-us...
19.11.2024 20:14 —
👍 11
🔁 9
💬 0
📌 2

Become a Fellow | Robert & Patricia Switzer Foundation
MS or PhD students doing applied environmental research in any discipline and studying at a Univ. in California or New England — consider applying for a Switzer Fellowship! It’s a great network to be part of — Applications open now & due 1/6/2025 www.switzernetwork.org/fellowship/b...
18.11.2024 16:00 —
👍 2
🔁 1
💬 0
📌 0
Would be happy to be added to this list too! Thanks for putting it together!
18.11.2024 14:13 —
👍 2
🔁 0
💬 1
📌 0
Take a look at USGS Vizlab’s latest work and explore some of our interactive #DataViz as it relates to #WaterInsecurity, #SocialVulnerability and #EJ
#OpenSource code here: github.com/DOI-USGS/vul...
15.11.2024 20:18 —
👍 4
🔁 1
💬 0
📌 0


