I’m open to contract work & postdoc roles in ecology & conservation biology! Recently laid off in the Feb. 14 federal cuts. I specialize in quantitative ecology, modeling, GIS & decision support tools. Let’s connect! #Ecology #ConservationBiology #Postdoc #ScienceCollaboration
11.03.2025 13:19 —
👍 6
🔁 6
💬 0
📌 0
Thank you Stephen! Pardon my ignorance but what's an IRT? Thanks!
08.11.2024 17:36 —
👍 1
🔁 0
💬 1
📌 0
Thank you so much for your help, Stephen!
08.11.2024 00:26 —
👍 1
🔁 0
💬 0
📌 0
x.com
Help! Please see this Twitter/X thread. I need help validating a decision support tool I've created: x.com/AdrianEcolog...
08.11.2024 00:21 —
👍 1
🔁 0
💬 1
📌 1
Which C++ compiler do you all use for R Stan? #rstats #r #stan #brms
18.11.2023 00:01 —
👍 1
🔁 0
💬 1
📌 0
I did not, but I will try that out! Thank you Lars.
17.11.2023 19:27 —
👍 1
🔁 0
💬 1
📌 0
Thanks for your reply, Alex! I left it as a continuous variable, but when I did treat it as a categorical factor, the effect diminishes. I'm quite perplexed to be honest.
17.11.2023 18:06 —
👍 1
🔁 0
💬 2
📌 0
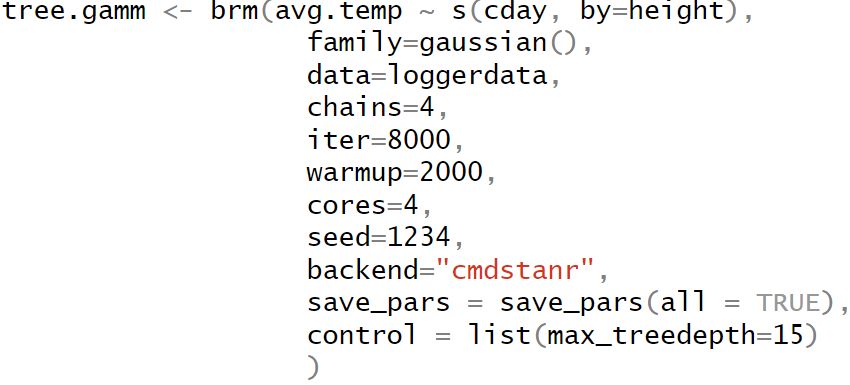
The code for the model is attached.
I would like to have the same figure I just produced, but have them represent the temperature changes at each individual height (which it seems to be doing). I'm just confused by why the conditional_effects() function is changing the values of the heights.
17.11.2023 17:48 —
👍 0
🔁 0
💬 1
📌 0
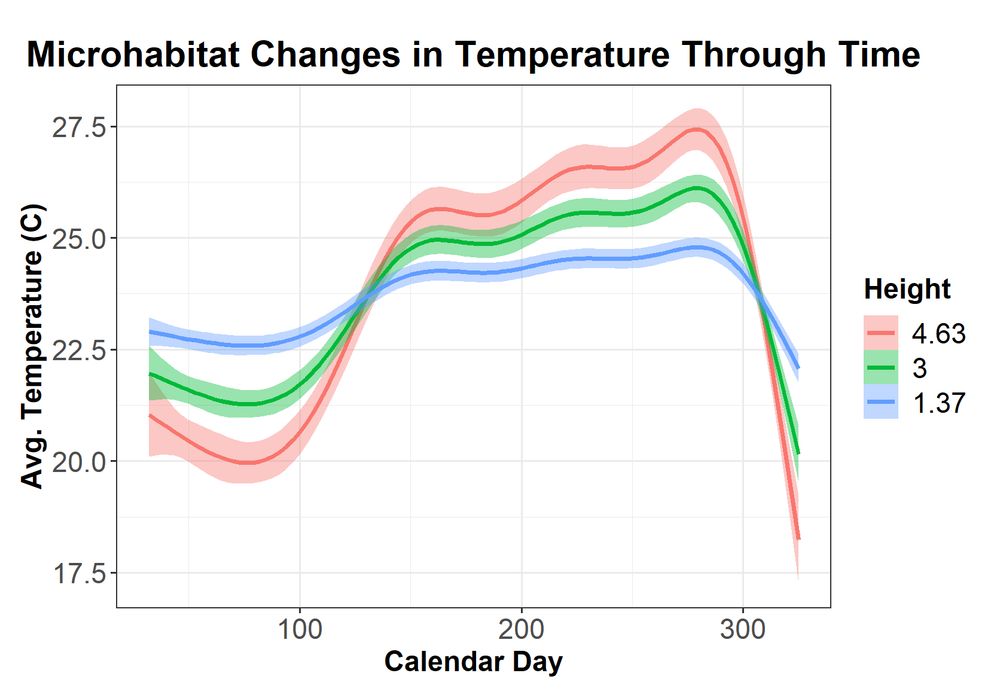
Hey #rstats & #brms community! I'm modeling change in avg temp at three heights (1m, 3m, & 5m) on cypress trees using a GAM (one spline per height). I ran the code just fine, but when I extract the conditional_effects and plot it, the heights are modified in the output. Help?
17.11.2023 17:47 —
👍 4
🔁 1
💬 1
📌 0