

#TidyTuesday Selección de imágenes de Astronomy Picture of the Day relacionadas con Argentina.
Script: vhgauto.github.io/tidytuesday/...
#Rstats #dataviz #datavisualization
#TidyTuesday Selección de imágenes de Astronomy Picture of the Day relacionadas con Argentina.
Script: vhgauto.github.io/tidytuesday/...
#Rstats #dataviz #datavisualization
#TidyTuesday Lenguajes de África, ordenados por cantidad de personas que los hablan.
Script: vhgauto.github.io/tidytuesday/...
#Rstats #dataviz #datavisualization
Logo for the #TidyTuesday Project. The words TidyTuesday, A weekly data project from the Data Science Learning Community (dslc.io) overlaying a black paint splash.
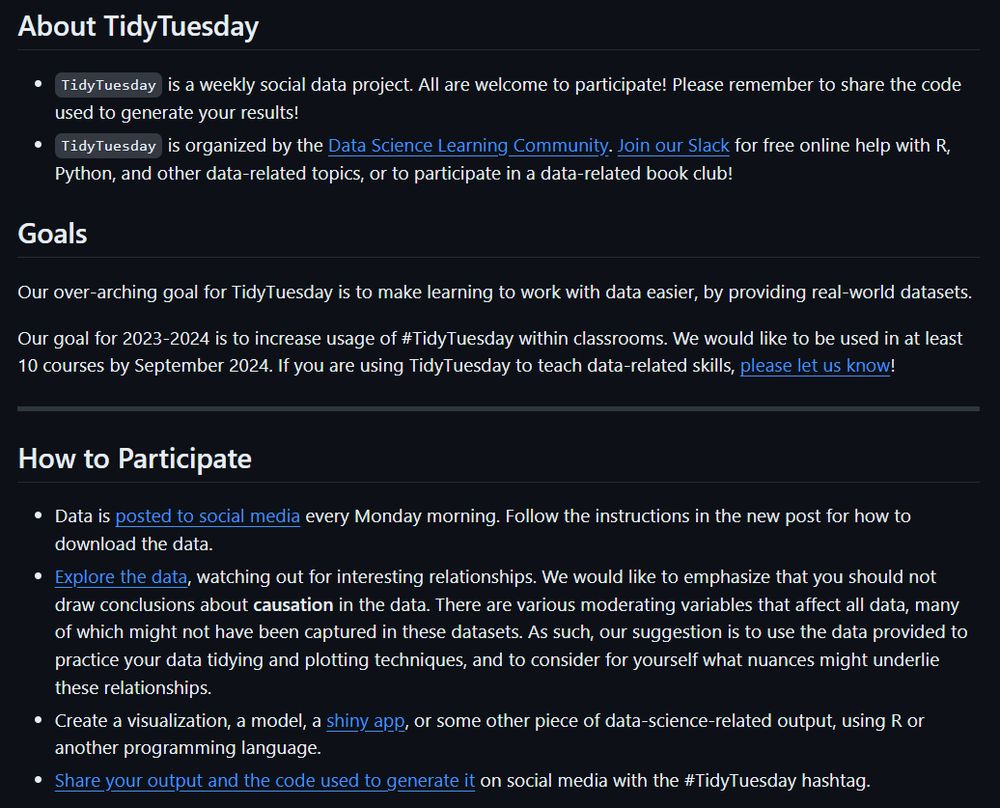
TidyTuesday is a weekly social data project. All are welcome to participate! Please remember to share the code used to generate your results! TidyTuesday is organized by the Data Science Learning Community. Join our Slack for free online help with R and other data-related topics, or to participate in a data-related book club! How to Participate Data is posted to social media every Monday morning. Follow the instructions in the new post for how to download the data. Explore the data, watching out for interesting relationships. We would like to emphasize that you should not draw conclusions about causation in the data. Create a visualization, a model, a shiny app, or some other piece of data-science-related output, using R or another programming language. Share your output and the code used to generate it on social media with the #TidyTuesday hashtag.

A table of event counts by day. Each row is a sport, each column represents a date. The body of the table counts the number of events for each sport on a given day.
@dslc.io welcomes you to week 6 of #TidyTuesday! We're exploring This week we're getting ready for the 2026 Winter Olympics!!
📁 https://tidytues.day/2026/2026-02-10
🗞️ https://www.olympics.com/en/milano-cortina-2026/schedule
#RStats #PyData #JuliaLang #DataViz #tidyverse #r4ds

Grilla con 28 imágenes de autores, con nombre completo, año de nacimiento y muerte, y títulos navideños.
#TidyTuesday Autores literarios con textos navideños.
Script: vhgauto.github.io/tidytuesday/...
#Rstats #dataviz #datavisualization

Mapa de Argentina a la izquierda de la figura, con una columna dividida en 5 categorías: extinto, moribundo, sin riesgo, sustitución y amenazado. Cada categoría contiene los lenguajes asociados.
#TidyTuesday Clasificación de lenguajes en Argentina.
Script: vhgauto.github.io/tidytuesday/...
#RStats #dataviz #datavisualization
Finished the first draft of the "too many" section of my book Feature Engineering A-Z! This section covers the methods you would want to use if you have problems with too many predictors, including feature selection and dimensionality reduction
feaz-book.com/too-many #rstats #pydata

The latest release of #Positron has a TOTAL REVAMP of the integration to GitHub Copilot, which solves a ton of auth problems!
In this screencast, I walk through how to set up Positron Assistant 🤖 to use GitHub Copilot as a model provider:
youtu.be/T8dCQ6iIFXo

Cheeseburgers are not natural.
My Graph is up on Reddit www.reddit.com/r/dataisbeau...

Mapa de polígonos de Benavídez, Tigre, Buenos Aires, en tonos de grises, indicando en celeste 8 rotondas. El mapa cuenta con escala, brújula al Norte y miniatura de la posición en Buenos Aires.
#TidyTuesday Rotondas presentes en Benavidez, Partido de Tigre, Provincia de Buenos Aires.
Script: vhgauto.github.io/tidytuesday/...
#Rstats #dataviz #datavisualisation

Figura de puntos, con eje horizontal en escala logarítmica de precios (USD) y en el eje vertical las marcas de autos en orden creciente de precio. Se indica con la forma de la viñeta si se trata de un motor a combustible fósil, híbrido o eléctrico. Bugatti y Lotus tienen los autos más caros.
#TidyTuesday Fabricantes de vehículos, precios y tipo de motor.
Script: vhgauto.github.io/tidytuesday/...
#Rstats #dataviz #datavisualization
Logo for the #TidyTuesday Project. The words TidyTuesday, A weekly data project from the Data Science Learning Community (dslc.io) overlaying a black paint splash.
TidyTuesday is a weekly social data project. All are welcome to participate! Please remember to share the code used to generate your results! TidyTuesday is organized by the Data Science Learning Community. Join our Slack for free online help with R and other data-related topics, or to participate in a data-related book club! How to Participate Data is posted to social media every Monday morning. Follow the instructions in the new post for how to download the data. Explore the data, watching out for interesting relationships. We would like to emphasize that you should not draw conclusions about causation in the data. Create a visualization, a model, a shiny app, or some other piece of data-science-related output, using R or another programming language. Share your output and the code used to generate it on social media with the #TidyTuesday hashtag.

A color drawing of the Spirit of Christmas Present from A Christmas Carol by Charles Dickens. A man in a green robe sits on top of a pile of varoius foods, and holds a torch above his head. Scrooge stands beside him, dwarfed by the spirt.
@dslc.io welcomes you to week 52 of #TidyTuesday! We're exploring Christmas Novels!
📂 https://tidytues.day/2025/2025-12-30
📰 https://github.com/ropensci/gutenbergr/issues/95
#RStats #PyData #JuliaLang #DataViz #tidyverse #r4ds

Figura de dispersión con años en el eje horizontal y la duración (minutos) de la quema del Böögg en el festival Sechseläuten. El panel muestra de fondo un Böögg prendido fuego.
#TidyTuesday Duración de la quema del Böögg en el festival Sechseläuten.
Scripts: vhgauto.github.io/tidytuesday/...
#Rstats #dataviz #datavisualization

Mapa del mundo, con escala de colores que indican el rango de puntaje del índice de desempeño estadístico por país. Argentina está en el rango de los 70, con 90 como máximo.
#TidyTuesday Índice de desempeño estadístico por país (2023).
Script: vhgauto.github.io/tidytuesday/...
#Rstats #dataviz #datavisualization

Figura con 22 paneles, uno por cada historia de herlock Holmes, indicando las 5 palabras más frecuentes. La palabra "Watson" se destaca del resto. Las palabras tienen tamaño creciente respecto de su frecuencia.
#TidyTuesday Palabras más frecuentes en "The Adventure of the..." de Sherlock Holmes.
Script: vhgauto.github.io/tidytuesday/...
#Rstats #dataviz #datavisualization #sherlock

Figura de columnas, con años en el eje horizontal y cantidad de casos de tuberculosis cada 100000 habitantes argentinos en el eje vertical. Cada columna está compuesta de puntos por cada unidad de casos de tuberculosis, y son emojis de pulmones. De fonde se muestra una calavera.
#TidyTuesday Casos de casos de tuberculosis en Argentina cada 100000 habitantes.
Scripts: vhgauto.github.io/tidytuesday/...
#Rstats #Datavisualization #dataviz

Figura de dispersión en dos paneles superpuestos. Se muestran los valores de plomo en agua y se indica con líneas verticales el límite ambiental y el cuartil 90. En el panel superior, considerando todas las mediciones, el cuartil 90 supera el límite ambiental. En el panel inferior, al eliminarse dos observaciones, el cuartil 90 es menor al límite ambiental.
#TidyTuesday Efecto de la eliminación de dos observaciones en las mediciones de plomo en agua, en la ciudad de Flint (EE.UU.)
Script: vhgauto.github.io/tidytuesday/...
#Rstats #datavisualization #dataviz

Figura de barras mostrando la proporción anual de hombres, mujeres y personas no binarias ganadoras de premios literarios británicos.
#TidyTuesday Proporción anual de ganadores de premios literarios británicos.
Script: vhgauto.github.io/tidytuesday/...
#Rstats #datavisualizations #dataviz

picture of cross stitch hoop, with recipes hex sticker in it. pictures a cupcake with its hands raised
I did a craft! cross stitched our little recipes cupcake
17.11.2025 18:35 — 👍 39 🔁 1 💬 2 📌 0
Mapa de Reino Unido mostrando las ubicaciones de estaciones meteorológicas, con escala de color correspondiente a las horas de Sol mensuales.
#TidyTuesday Estaciones meteorológicas de Reino Unido y cantidad de horas de Sol.
Script: vhgauto.github.io/tidytuesday/...
#Rstats #Datavisualization #dataviz

Example of using `filter_out()` on the `penguins` dataset, showing how it is much easier than `filter()`, especially with `NA`s
We are looking for #rstats community feedback on 3 new dplyr functions!
We're aiming to expand the `filter()` family:
- `filter()` to keep rows
- `filter_out()` to drop rows
- `when_any()` and `when_all()` as modifiers
Read more and leave feedback here:
github.com/tidyverse/ti...

Figura de puntos y línea mostrando el progreso de la cantidad de personas obesas (+18 años) argentinas. Inicia en 5,7 millones en 2002 hasta 11,6 millones en 2022.
#TidyTuesday Obesidad en adultos argentinos.
Scripts: vhgauto.github.io/tidytuesday/...
#Rstats #Datavisualization #dataviz

Mapa de las ciudades de los equipos de la EuroLeague Basketball, indicando la posición de la ciudad y el nombre del equipo.
#TidyTuesday Mapa de las ciudades de los equipos de la EuroLeague Basketball.
Script: vhgauto.github.io/tidytuesday/...
#Rstats #dataviz #Datavisualization #EuroLeague

nothing fancy for this week #tidytuesday.
was playing with new ways to display axis.
code at: barreiro-r.github.io/tidytuesday/...
#ggplot2 #rstats #dataviz

Figura de calor, con años en el eje horizontal, entre 2002 y 2024; y meses en el eje vertical, marzo, abril, agosto, septiembre y octubre. La mayor cantidad de observaciones de grullas ocurrió en abril de 2019, con aproximadamente 250 mil registros.
#TidyTuesday Cantidad de grullas observadas en el Lago Hornborgasjön, Suecia.
Script: vhgauto.github.io/tidytuesday/...
#Rstats #Datavisualization #dataviz

Figura de barras, con diseño cuadriculado, mostrando los países con mayor cantidad de Grandes Maestros, siendo Alemania, EEUU, India, Rusia, Ucrania, Francia, Serbia, España, Israel, Polonia, Hungría y China.
#TidyTuesday Cantidad de Grandes Maestros en el ajedrez, a septiembre de 2025.
Script: vhgauto.github.io/tidytuesday/...
#Rstats #dataviz #datavisualization

Diagrama de cajas y bigotes. Se muestran tres paneles para carbohidratos, lípidos y proteínas. Los países seleccionados: Argentina, Japón, Grecia, España e Italia.
#TidyTuesday Contenido nutricional en la cocina de una selección de países.
Scripts: vhgauto.github.io/tidytuesday/...
#RStats #dataviz #datavisualization

Over the next few months, we will be hosting a Workflow Demo Series to cover everything you'll need to know as you explore Positron firsthand.
📆 First session: Getting Started with Positron: Quick Tour and Community Q&A on September 24th! Register here - events.zoom.us/ev/Ajss5j9Ve...

Figura de líneas, con los años en el eje horizontal y la cantidad de países que se pueden visitar con el pasaporte del país considerado. Son 9 paneles, correspondientes a Argentina, Bolivia, Brasil, Chile, Colombia, Ecuador, Paraguay, Uruguay y Venezuela.
#TidyTuesday Cantidad de países que se pueden visitar por los titulares de pasaportes de estos países sudamericanos.
Script: vhgauto.github.io/tidytuesday/...
#Rstats #dataviz #Datavisualization
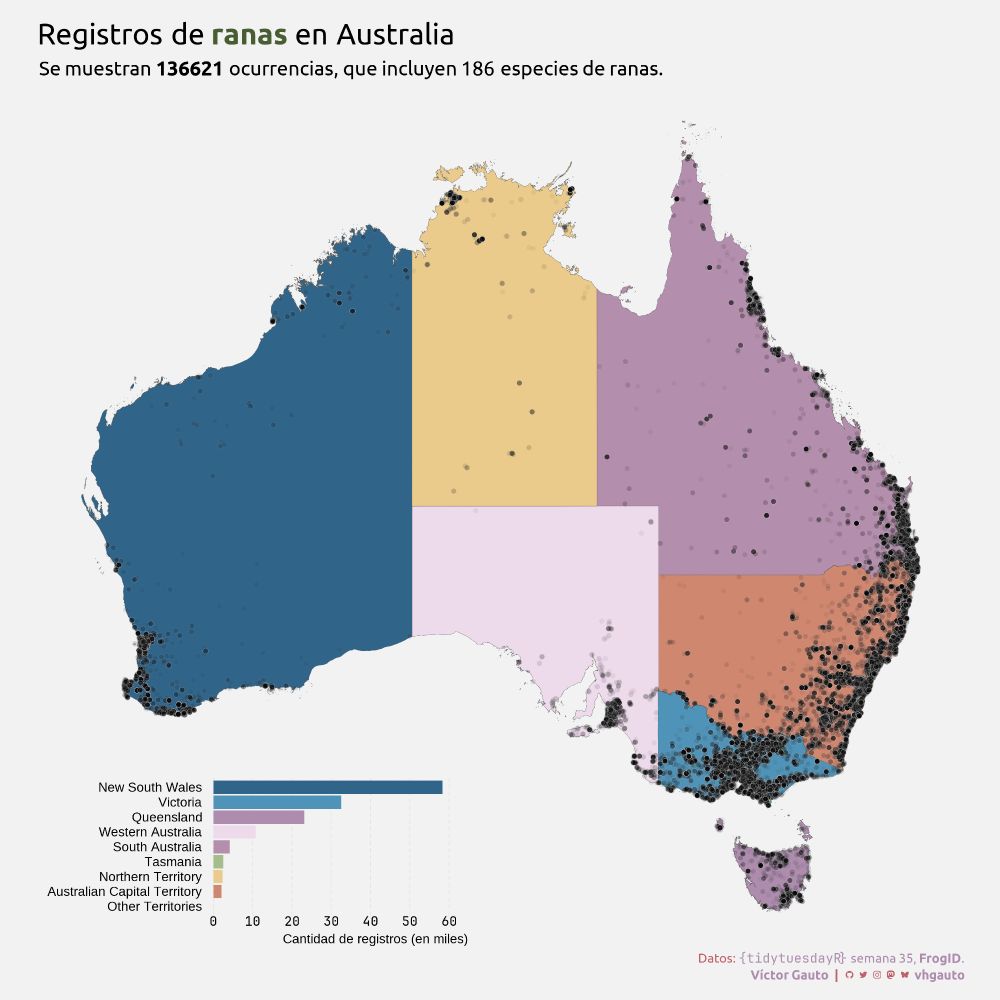
Mapa de Australia mostrando las posiciones de 136621 registros de ranas, con el conteo por cada estado en forma de figura de barras horizontales.
#TidyTuesday Ranas en Australia
Script: vhgauto.github.io/tidytuesday/...
#dataviz #datavisualization #RStats

Frog calling patterns (as recorded by app users) for this week's #tidytuesday
Highly recommend curating data if you haven't already - I thought it would be tricky but it was straightforward! Just follow these steps dslc-io.github.io/tidytuesdayR...
Code: jessjep.github.io/blog/posts/t...
#frogID
