How Israel’s multi-ton truck bombs ripped through Gaza City
In the weeks before the ceasefire, Israel deployed a new weapon: Armoured Personnel Carriers repurposed as explosive-laden bombs.
New! Documenting the impact of Israel's devastating new weapon: Armoured Personnel Carriers packed with tons of explosives, detonated remotely, that levelled buildings across Gaza in the weeks before the ceasefire on October 10.
See full story here: reut.rs/4qpbsEQ
31.12.2025 13:32 — 👍 1 🔁 0 💬 0 📌 0

We show how heavy rainfall from typhoon Ragasa led to a lake bursting in Taiwan. The lake started forming in July and grew in size before bursting. See full story for a 3d view of the area, satellite images from before and after disaster, and maps + charts tracing the typhoon.
Link: reut.rs/4nGbcRf
26.09.2025 11:32 — 👍 2 🔁 1 💬 0 📌 0

Exceptional plane crash survival stories show there’s no ‘safe seat’
A look at dozens of exceptional survival stories in civil aviation history shows survival often depends on a complex mix of factors.
Presenting some of the most astonishing, extraordinary stories of air crash survivals, and a look at data that shows there's no 'safe seat' when only a few survive.
Full story: reut.rs/3HLniIU
For @graphics.reuters.com
22.08.2025 10:37 — 👍 2 🔁 0 💬 0 📌 0
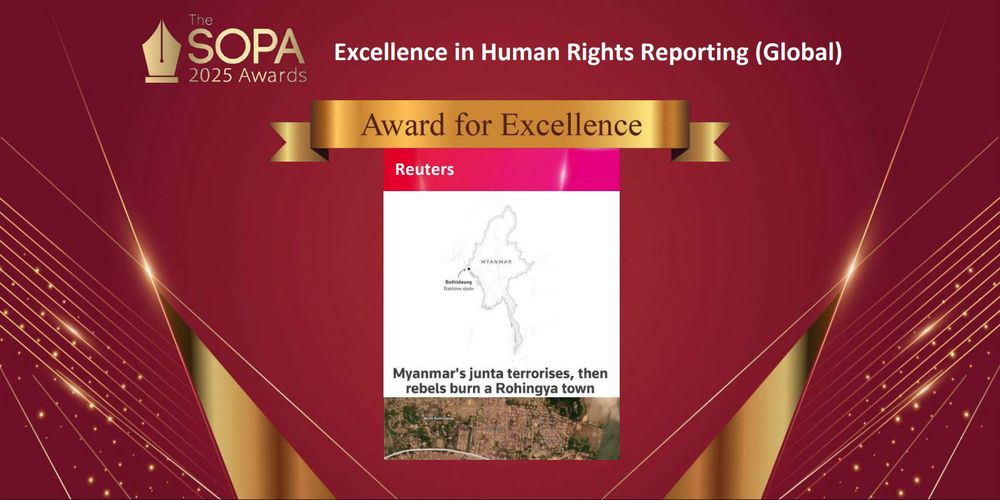

Reuters’ coverage of the humanitarian crisis in Myanmar has recently been awarded the SOPA Award for Excellence in Human Rights Reporting.
I'm honoured to have been part of the team, contributing satellite imagery analysis and graphics for one of the three stories in the series.
08.07.2025 10:00 — 👍 2 🔁 0 💬 0 📌 0
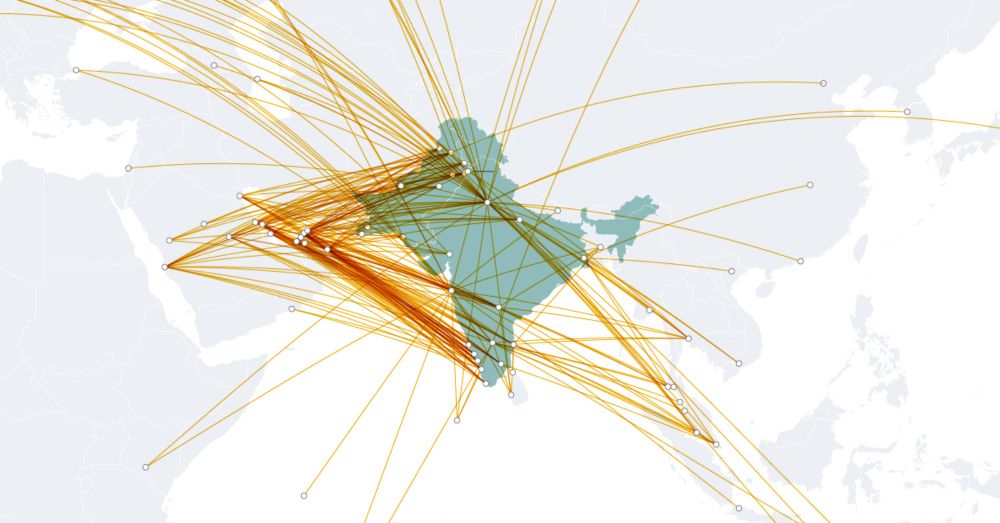
How India-Pakistan conflict pushed planes off course
Data shows closure of airspace and military confrontations lead to rerouting of flights, swelling flight times
Data shows how the India-Pakistan conflict has disrupted air traffic. Airspace restrictions forced Indian and foreign airlines to go around Pakistan, adding anywhere from a few minutes to several hours to flights.
www.reuters.com/graphics/IND...
08.05.2025 08:23 — 👍 4 🔁 1 💬 0 📌 0
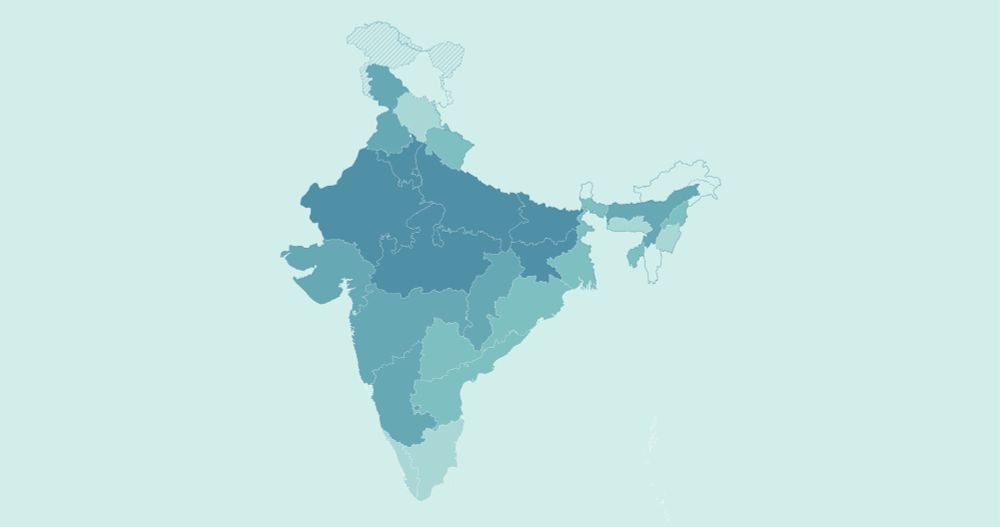
North vs South India: Controversial delimitation exercise explained
Graphics illustrate the disproportionate growth in population across Indian states and why is it concerning for upcoming delimitation exercise.
Debates around the delimitation of Lok Sabha seats have started gaining momentum. In this piece, I use maps and charts to explain the core of the issue and how India arrived at this critical situation.
Link: reut.rs/3XLMdAH
14.03.2025 06:59 — 👍 1 🔁 0 💬 0 📌 0
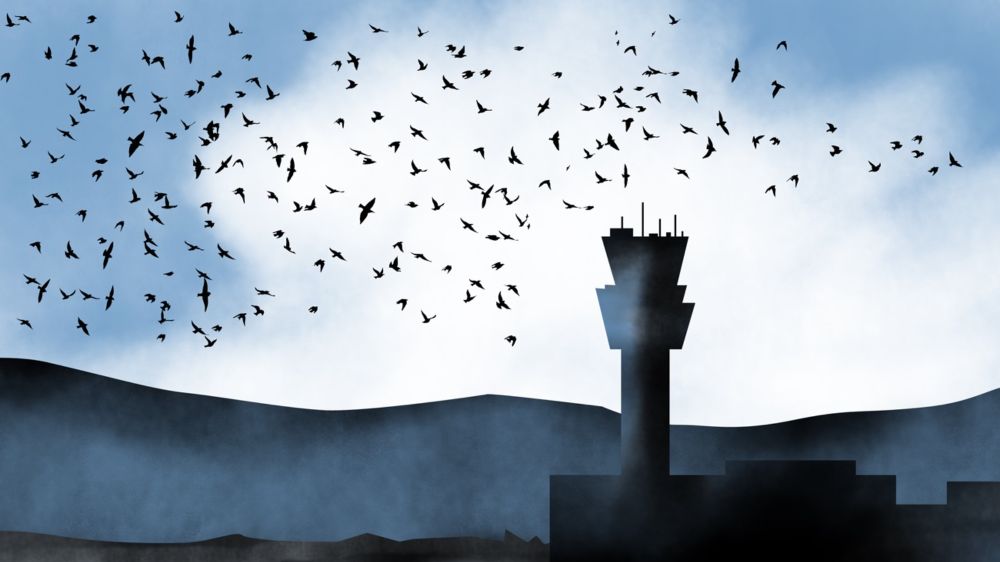
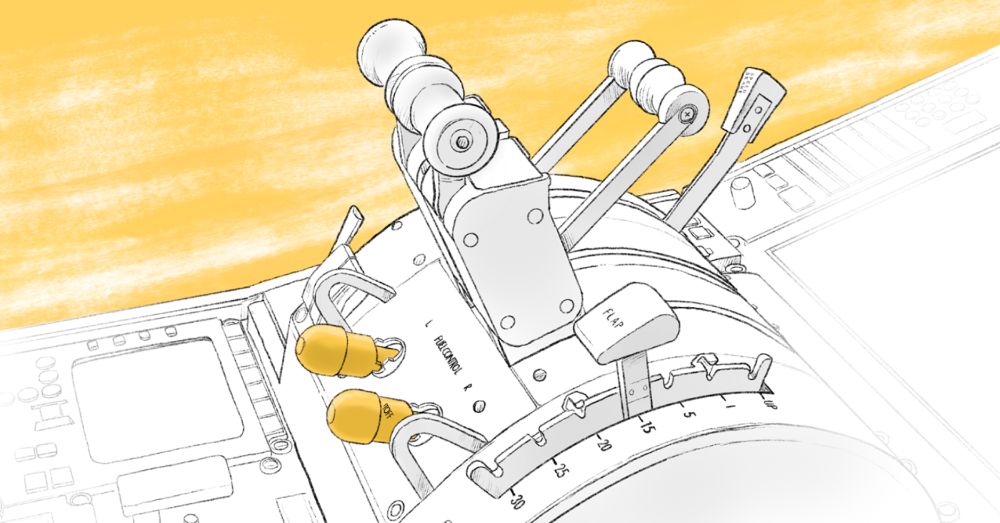
How over 150 bird strikes a day challenge aviation
Birds striking an aircraft is common in aviation, serious incidents are rare yet often fatal.
Do you know birds collide with aircraft 150 times a day? Yet serious outcomes like South Korea's Jeju Air crash are rare but often fatal. In some cases it's been a miraculous escape for the passengers.
We have a story on bird strikes, with data and graphics: reut.rs/3PVwtHe
29.01.2025 08:06 — 👍 0 🔁 0 💬 0 📌 0
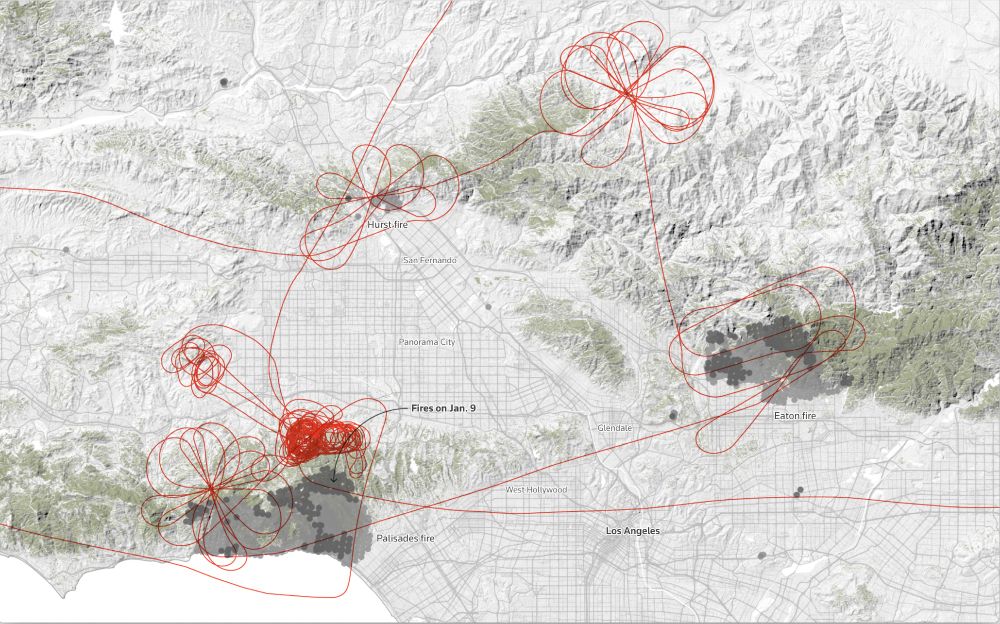
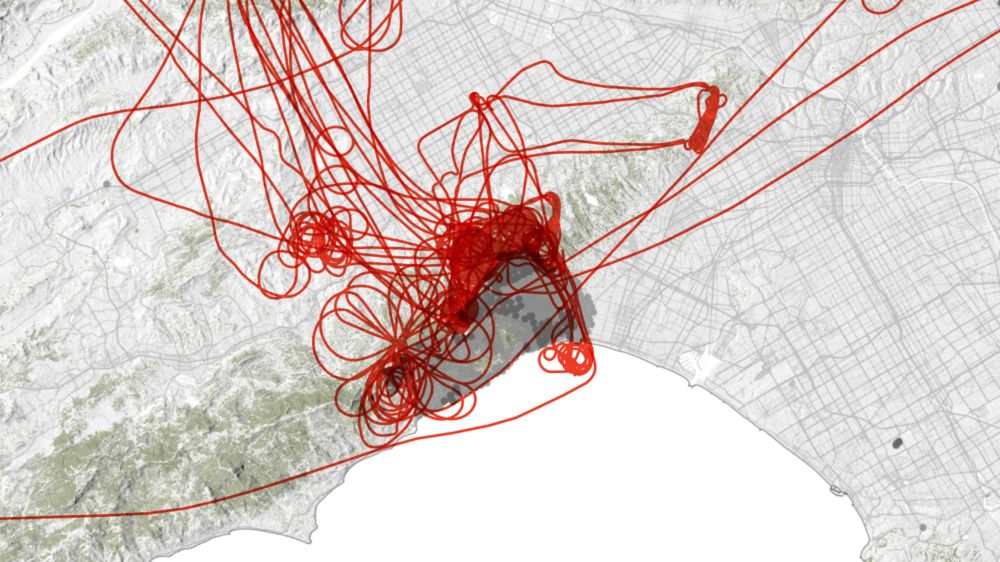
Map of flight paths around the Los Angeles fires. Flight paths are indicated by red lines, roads by gray lines, forested areas with muted green, and active fires with dark gray dots. The map is accented by hill shading.
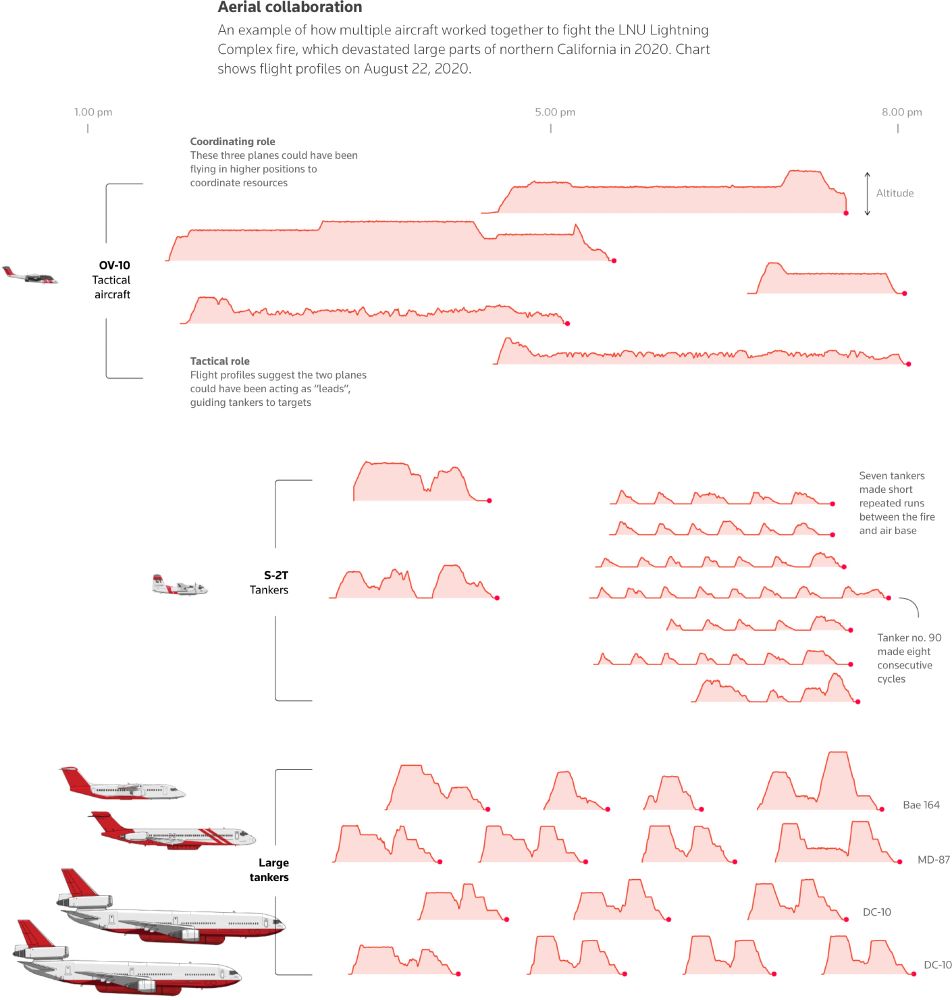
Annotated graphs of altitude and flight times for observation aircraft and tankers, showing coordination of the fleet.
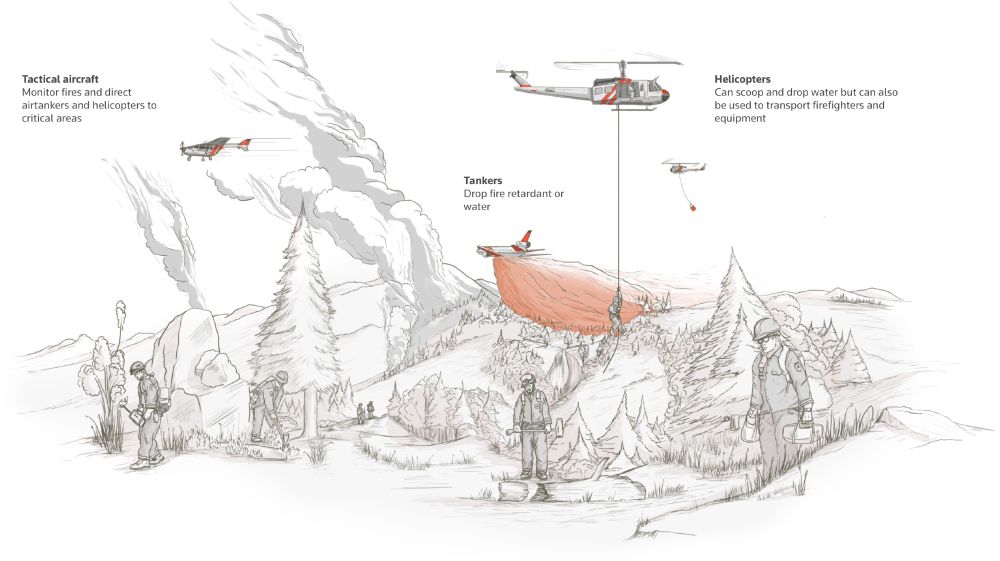
Hand-drawn illustration showing how helicopters and aircraft are used to dump water and flame retardant to help fight wildfires.
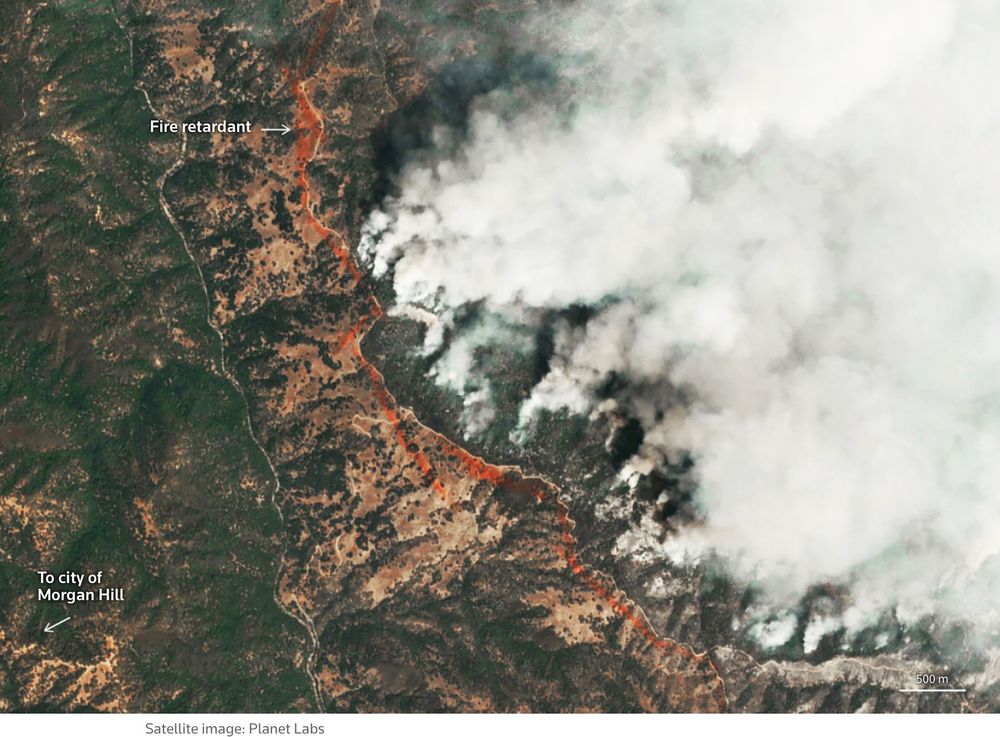
High-resolution color satellite image showing red flame retardant laid in front of an advancing fire with copious smoke.
The graphics in this @reuters.com article on air tankers battling the fires in LA are astonishingly good.
www.reuters.com/graphics/CAL...
via @interactives.bsky.social
10.01.2025 18:38 — 👍 63 🔁 20 💬 3 📌 2
Thank you, Amanda. Thanks to our graphics team for a quick huddle on this, helping get this out quickly.
31.12.2024 04:04 — 👍 1 🔁 0 💬 0 📌 0
We're keeping our starter pack up to date, as more of the team comes over to bluesky. Follow the graphics reporters and editors behind our stories: go.bsky.app/CnSL5PB
09.12.2024 21:16 — 👍 11 🔁 8 💬 0 📌 0

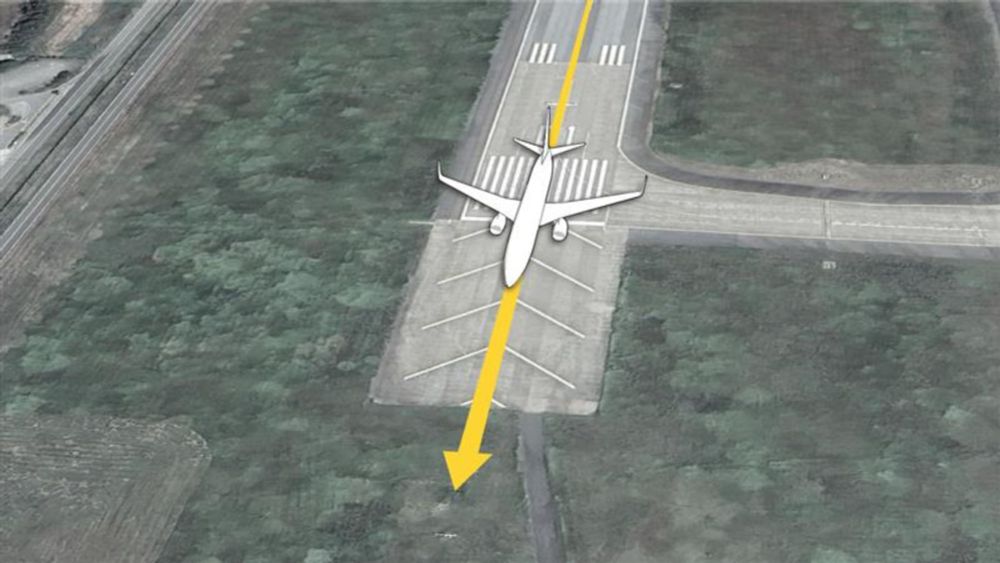
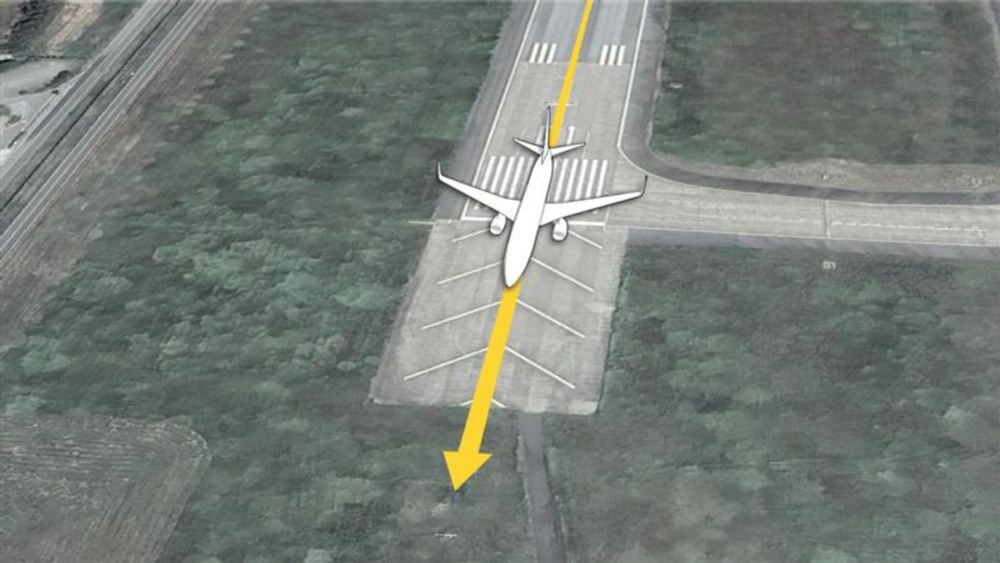
The final moments before the Jeju Air crash in South Korea
Maps and diagrams break down the final minutes of Jeju Air flight 2216 that ended in the deadliest air crash in South Korea.
Almost 180 people died when a Jeju Air flight crashed at Muan International Airport. Here's a graphic representation of what we know so far about the deadliest air disaster on South Korean soil reut.rs/3DvIH6k
30.12.2024 15:20 — 👍 57 🔁 23 💬 2 📌 0
The final moments before the Jeju Air crash in South Korea
Maps and diagrams break down the final minutes of Jeju Air flight 2216 that ended in the deadliest air crash in South Korea.
We break down the final moments of the Jeju Air flight that crash-landed in South Korea. It crashed just five minutes after control tower cautioned the pilots of birds around the area.
reut.rs/3ZV0E64
30.12.2024 15:09 — 👍 1 🔁 1 💬 1 📌 0
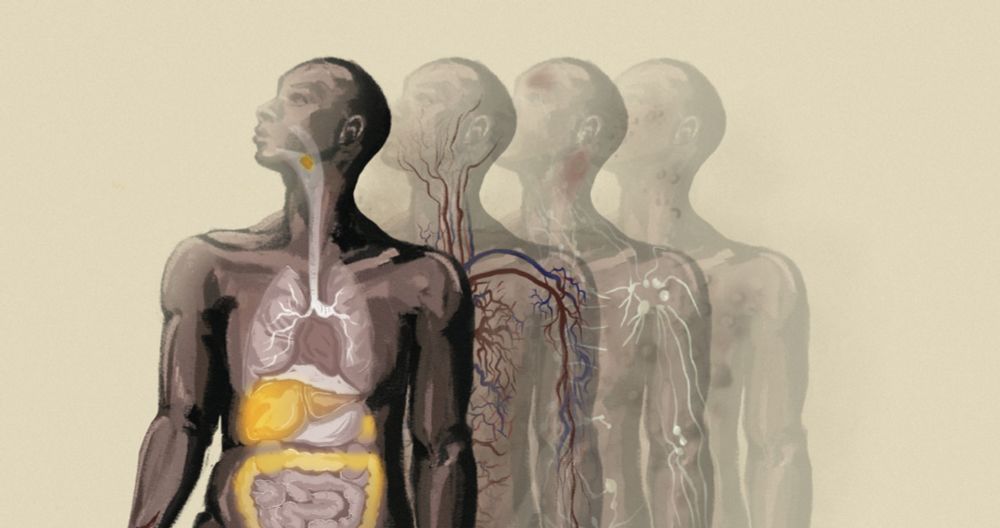
How the mpox virus spreads, mutates, and attacks humans
Explaining the evolution of mpox, formerly monkeypox, and how it affects the body
Visual explainer on the human body’s battle with mpox, and how the virus spreads and mutates. In recent years, a new strain of the virus spread globally.
bit.ly/4eHS9AB
22.11.2024 09:26 — 👍 2 🔁 1 💬 0 📌 0
And at least this new country looks, feels and navigates like the one we come from, so at least we don't need to find where the grocery shops are and navigate new roads. We only enjoy better pavements, less potholes, friendly infrastructure and more inclusivity here.
20.11.2024 11:04 — 👍 1 🔁 0 💬 1 📌 0
... and end up meeting, greeting and making friends with a whole lot of new people, and sometimes end up losing contact with your friends who didn't immigrate with you.
20.11.2024 11:02 — 👍 1 🔁 0 💬 1 📌 0
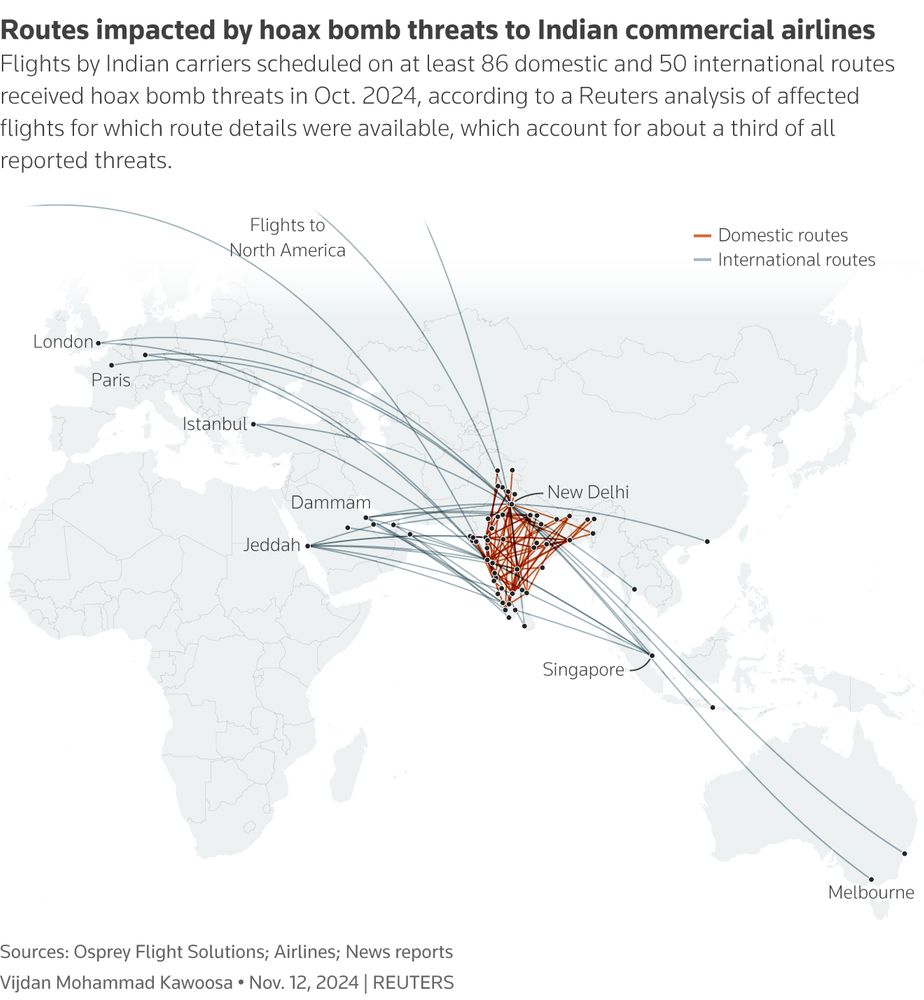
In my first Bluesky post, sharing my latest work, a data-driven graphics story looking at more than 500 hoax bomb threats that flights in India got this October, disrupting operations on at least 136 routes.
Full story: reut.rs/4emitA9
Produced with my excellent colleagues at Reuters Graphics!
20.11.2024 09:00 — 👍 2 🔁 1 💬 1 📌 0
Data visualisation designer at BBC News focusing on satellite data, climate change and cartography | previously at @esa.int | Co-founder of @chartle.cc - A daily chart game
Data analyst/scientist making data analysis software, #datavis, #datascience , etc, nature photography, some creativity and hobbyist personal complex medical research . ( Did I miss anything?... well, #mecfs ;)
miskaknapek.eu
A Bluesky-bot that shares interactives, graphics, and other stories built using code from newsrooms around the world.
Created by @sammorr.is
Source code: https://github.com/sammorrisdesign/interactive-feed
Data Visualization. Ex-Planet & NASA Earth Observatory. Blue Marble, Earth at Night, color, cartography, occasionally skewed views of Earth. Looking for a job.
I like to draw. On @graphics.reuters.com team
Data viz at Reuters Graphics
http://samhart.co
Senior Graphics Editor at @ReutersGraphics
| AAA Kavli Award 2021 | Ortega y Gasset 2021 | @el_pais @WSJ |
@uninoticias | @elmundoes | marianozafra.github.io
dunno. data, journo, teacher, human, dog lover
right brain + left brain
she/her
Graphics Journalist at Reuters Graphics (www.reuters.com/graphics/)
Illustrator I Information design
Finance + data + design @graphics.reuters.com . Ex-FT. 🏳️🌈
portfolio: prinzmagtulis.com
personal projects: https://www.data-dict.com
Information Experience Designer | Crafts visual stories from data at Reuters, Makes 🎨 art, takes 📸 pictures and collects 🐶 memes.
https://bit.ly/m/pkddapacific
Graphics Journalist at Reuters Graphics (https://www.reuters.com/graphics/)
| Science Illustrator |
Formally doing infographics and dataviz at National Geographic
Side project: taiwandatastories.com
Made in Taiwan🇹🇼 legal Kiwi🇳🇿
Financial Graphics Editor, Reuters
Maps, charts, illustrations, animations, 3d models, data analysis and fun little easter eggs from your favorite graphics team. https://www.reuters.com/graphics/
Data, Graphics & Art ✨ freelance creative, black cat lover, DnD nerd 🖤 amandaweisbrod.com
Financial and economic data and graphics @ Reuters
Asia Graphics Editor at Reuters, mum, and obsessor of all things Greek + Roman (from a feminist perspective!)
Journalist | Designer | Kashmiri