@wcrpclimate.bsky.social's APARC releases a landmark report on global atmospheric impacts of the 2022 Hunga volcanic eruption
159 scientists. 21 countries. 3 years. One report.
More information here: https://bit.ly/493hOmz
#WCRP #APARC #ScienceforAction #HungaEruption
19.12.2025 12:29 —
👍 17
🔁 9
💬 0
📌 0


Don’t miss the final CLIVAR webinars of 2025 as we wrap up the year!
Dec 10: "Ocean-atmosphere coupled model development(...)" with Jing-Jia Luo (07:00 UTC)
Dec 11: "When internal variability meets climate change(...)" with Thibault Guinaldo (14:00 UTC)
Check the full details 👇
09.12.2025 09:03 —
👍 1
🔁 2
💬 0
📌 0

ECMWF Science blog. The AI Weather Quest: uniting international expertise to advance sub-seasonal forecasting. Authors: Joshua Talib, Olga Loegel, Frederic Vitart, Joern Hoffmann, Matthew Chantry.
New science blog:
As the competition phase of the #AIWeatherQuest starts, the organisers introduce the competition framework and establish a baseline by assessing the skill of current dynamical sub-seasonal forecast models.
➡️ www.ecmwf.int/en/about/med...
@wmo-global.bsky.social
19.08.2025 08:56 —
👍 6
🔁 3
💬 0
📌 0
🌊❄️🧪 🇦🇶 Please share:
We have learned that the National Science Foundation is moving ahead with plans to decommission the U.S. Research Vessel/Ice Breaker Nathaniel B. Palmer this October.
If you care about Antarctic research, please read on (1/n)
25.07.2025 19:50 —
👍 317
🔁 227
💬 8
📌 23

Interested in joining the APECS international Executive Committee for 2026? There are only a few days left to apply! apecs.is/who-we-are/l...
11.06.2025 04:47 —
👍 1
🔁 1
💬 0
📌 0

This is not the actual cover of Nature, just shown here for illustrative purposes. We did submit this figure for consideration for their cover. Print run in two weeks, we'll know by then if it gets used.
Out today in Nature, our paper on the drivers of the record 2023 summer heating of the North Atlantic. Temperatures warmed to record levels in just a few months. The impacts on climate & ecosystems were severe. A thread on how this work came about and what we found.👇👇🧵 www.nature.com/articles/s41...
04.06.2025 15:19 —
👍 569
🔁 256
💬 9
📌 19
So sorry …! 🤯
11.04.2025 05:39 —
👍 4
🔁 0
💬 0
📌 0

"To address climate challenges, we need more women in science and policy-making to drive solutions that protect our wetlands." — Prof. Celeste Saulo
➡️ www.ramsar.org/person/prof-...
05.04.2025 06:57 —
👍 10
🔁 4
💬 0
📌 0
Last month was the 4th lowest #Antarctic sea ice extent on record for the month of March
This was 1,070,000 km² below the 1981-2010 March average. Data from NSIDC at nsidc.org/data/seaice_... 🌊
03.04.2025 15:54 —
👍 82
🔁 20
💬 3
📌 1

Line graph time series of 2025's daily Arctic sea ice extent compared to decadal averages from the 1980s to the 2010s. The decadal averages are shown with different colored lines with purple for the 1980s, blue for the 1990s, green for the 2000s, and white for the 2010s. Thin white lines are also shown for each year from 2000 to 2024. 2025 is shown with a thick gold line. There is a long-term decreasing trend in ice extent for every day of the year shown on this graph between February and May by looking at the decadal average line positions.
Monday ice update - #Arctic sea ice extent is currently the lowest on record (JAXA data)
• about 570,000 km² below the 2010s mean
• about 970,000 km² below the 2000s mean
• about 1,540,000 km² below the 1990s mean
• about 1,920,000 km² below the 1980s mean
Plots: zacklabe.com/arctic-sea-i... 🧪⚒️🌊
31.03.2025 14:41 —
👍 165
🔁 75
💬 4
📌 10
🚨 It's official - 2025 likely observed the lowest annual maximum #Arctic sea ice extent on record!
Climate change is reshaping the Arctic, all throughout the year.
For more information from @nsidc.bsky.social: nsidc.org/sea-ice-toda...
27.03.2025 19:38 —
👍 201
🔁 93
💬 2
📌 6

Open Call for Membership: WCRP Global Precipitation Experiment (GPEX) 🌧️
The WCRP GPEX Lighthouse Activity is expanding its Working Groups and invites nominations (including self-nominations) from scientists worldwide.
📅 Deadline: 31 March 2025
🔗 More information below
#ClimateScience #GPEX #WCRP
27.03.2025 09:09 —
👍 2
🔁 3
💬 0
📌 0

Line graph time series showing the latest mean sea level as of 27 January 2025 using data from 1993. There is a long-term increasing trend and a quadratic fit line is shown on the graph with an acceleration of 0.11 mm/yr^2. The current rate of increase is +4.1 mm/yr in the 2013-2024 period.
Another global sea level update with satellite altimetry data now processed by CNES/AVISO through late January 2025. It's accelerating. 🌊
+ Note that this graph was produced by www.aviso.altimetry.fr/en/data/prod...
20.03.2025 01:35 —
👍 250
🔁 97
💬 8
📌 8
🔴The #StateOfClimate report, released today, reveals key climate change indicators again reached record levels in 2024.
Check out the full report: wmo.int/publication-...
19.03.2025 08:00 —
👍 316
🔁 239
💬 5
📌 39
We've just published a study @commsearth.bsky.social about the severe 2020 coral bleaching event in the tropical Atlantic caused by massive marine heatwaves 🌊🌡️🧵
Link: www.nature.com/articles/s43...
19.03.2025 05:52 —
👍 23
🔁 11
💬 1
📌 0

Trump moves to close government lab that tracks planet-warming pollution
The lab is connected to the Mauna Loa Observatory, where scientists gather data to produce the Keeling Curve, a chart on the daily status of atmospheric carbon dioxide concentrations.
New: A NOAA lab in Hawaii that is connected to the longest-running observation of global greenhouse gas concentrations is slated for closure in August, according to a list of lease terminations Democratic members of Congress shared with @washingtonpost.com.
14.03.2025 18:23 —
👍 472
🔁 352
💬 33
📌 97
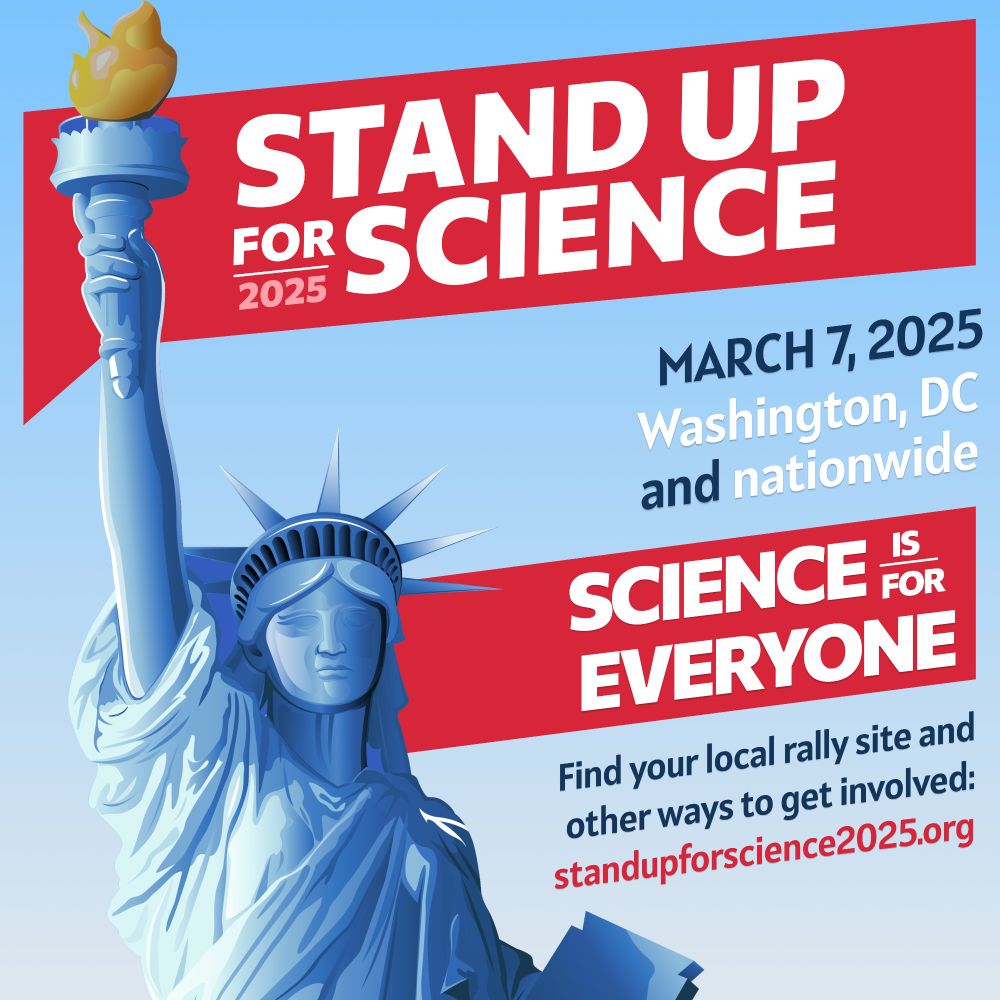
Welcome to the Bluesky account for Stand Up for Science 2025!
Keep an eye on this space for updates, event information, and ways to get involved. We can't wait to see everyone #standupforscience2025 on March 7th, both in DC and locations nationwide!
#scienceforall #sciencenotsilence
12.02.2025 17:04 —
👍 11494
🔁 5432
💬 291
📌 670

Line graph time series of 2025's daily Arctic sea ice extent compared to decadal averages from the 1980s to the 2010s. The decadal averages are shown with different colored lines with purple for the 1980s, blue for the 1990s, green for the 2000s, and white for the 2010s. Thin white lines are also shown for each year from 2000 to 2024. 2025 is shown with a thick gold line. There is a long-term decreasing trend in ice extent for every day of the year shown on this graph between January and April by looking at the decadal average line positions.
In the next few days, I will be sharing some of our work that I am most proud of from my time at NOAA/GFDL. But I would also like a little normalcy today on my feed, so here's my go-to sea ice data viz update.
#Arctic sea ice extent still remains the *lowest* on record for the date (JAXA). Not good
01.03.2025 00:00 —
👍 735
🔁 202
💬 15
📌 12
📣 Digital Earths lighthouse activity is organizing a global pan-hackathon for km-scale models! Dozens of researchers from across the world will participate in this hackathon in real-time.
Here is a curtain-raiser video about the event: loom.ly/xYErXdU
#KmScalemodels #EarthSystemModels #Hackathon
27.02.2025 13:58 —
👍 6
🔁 3
💬 0
📌 0
So sorry for you and so sorry for the short-sightedness of all this …
28.02.2025 06:46 —
👍 0
🔁 0
💬 0
📌 0


