The Rousseeuw Prize for Statistics
The Rousseeuw Prize for Statistics is a biennial prize to celebrate outstanding contributions to statistics research.
Nominations are now open for the Rousseeuw Prize, the most prestigious in Statistics. Akin to Fields Medal
Prize: $1 million! Deadline: Feb 26
Categories for 2026:
🔵computational statistics & data science
🔵statistics in physical sciences
🔵statistics in economics & humanities
rousseeuwprize.org
14.01.2026 16:05 — 👍 5 🔁 1 💬 0 📌 0
Some 15 years ago my colleague Parry Clarke said to me, "Dude stop complaining and write your own stats book!" So I did. It definitely changed my life, and I'm glad it has had a positive impact on others.
08.01.2026 13:30 — 👍 91 🔁 8 💬 1 📌 0

Behind the mic: Meet the minds of the ‘Stats + Stories’ podcast
After nearly 400 episodes, “Stats + Stories” has become a podcast where statisticians, journalists and the curious can listen in to make sense of the world around them.
Since 2013, “Stats + Stories” has explored the stats behind the stories & the stories behind the stats—from sports to pop culture, health, and more. The podcast was recently featured in “Behind the Mic: Meet the Minds of the ‘Stats + Stories’ Podcast.” tinyurl.com/39nbf82d @johnbailer.bsky.social
07.01.2026 20:34 — 👍 4 🔁 2 💬 0 📌 0

Dirac's equation, quantum electrodynamics, atomic and molecular structure
@tandfresearch.bsky.social www.tandfonline.com/doi/full/10....
07.01.2026 10:35 — 👍 2 🔁 1 💬 0 📌 0

A map of all the buildings in a UK city centre cropped into a circle. There are lots of large buildings in the centre with a gap in the north east.

A map of all the elevation in a UK city centre cropped into a circle.

A map of all the streets in a UK city centre cropped into a circle. There are lots of densely packed streets, with a gap running south west to north east.
Can you guess the UK city just from the streets, the buildings, and the contours? 📊
#RStats #DataViz
18.12.2025 14:05 — 👍 10 🔁 3 💬 0 📌 0

My year in data visualisation – Nicola Rennie
A round up of my projects this year, highlighting some of my favourite charts from 2025, and looking back on five years of TidyTuesday contributions.
Here's a little round up of my 2025 year in #DataViz featuring
💜 Some of my favourite #RStats charts
💜 A look back at 5 years of #TidyTuesday
💜 Links to cool #QuartoPub and visualisation things I've seen this year
Link: nrennie.rbind.io/blog/year-in...
10.12.2025 13:41 — 👍 35 🔁 6 💬 1 📌 0

#30daymapchallenge · Jour 30 · Relooking
🌍 Europe · Europa · Ευρώπη · Європа
🔍 Zoomez pour découvrir les villes d'Europe dans leur langue.
🔽 L'ancienne carte, en commentaire, utilisait un texte de substitution, réalisée pour le #30daymapchallenge 2024.
#cartographie #map #europe #europa
30.11.2025 03:51 — 👍 51 🔁 19 💬 3 📌 4

The editor of the ASA’s journal "Statistics and Data Science in Imaging" invites submissions for a special issue on spatial statistics in imaging with the support of the ASA Statistics and the Environment and Statistics in Epidemiology sections. Learn more: magazine.amstat.org/...
24.11.2025 14:01 — 👍 3 🔁 2 💬 0 📌 0

🚀 Excited to speak at the Rome R User Group Thu, Nov 27 (6PM CET)!
I’ll show practical workflows for geospatial predictive mapping in R — including tools to avoid spatial bias and improve prediction reliability.
More info: www.meetup.com/rome-r-users...
#RStats #Geospatial #GISchat #RSpatial
17.11.2025 14:04 — 👍 13 🔁 4 💬 0 📌 0

Line chart showing daily births. September 26th has the highest number, December 25th and 26th have the lowest. Source: ONS births in England and Wales data
In honour of today being the second-most-popular day to be birthed, here's my second-favourite birthday distribution chart
25.09.2025 07:54 — 👍 37 🔁 6 💬 10 📌 1
Lovely to see all the books from the series💚 @clairemkbowen.bsky.social @johnbailer.bsky.social
11.09.2025 08:17 — 👍 4 🔁 0 💬 0 📌 0

Chart showing how rankings of passports have changed over time, split by region with top one in each highlighted. European are ranked high, and UAE has had a dramatic rise.
There was lots of data to play with for #TidyTuesday this week where we're looking at the power of different passports! ✈️
I decided to try out the idea of using small multiples and highlighting to untangle a spaghetti chart with lots of lines 📊
#RStats #DataViz #ggplot2
09.09.2025 08:58 — 👍 110 🔁 16 💬 8 📌 3

Bump chart faceted by world regions showing the top countries of origin of refugees, asylum-seekers, and others in need of international protection. Asia and Africa rank consistently high, driven by long-term crises such as Afghanistan and Sudan. The Americas and Europe also appear high due to more recent crises in Venezuela and Ukraine.
Inspired by @nrennie.bsky.social excellent #TidyTuesday plot on the power of passports, I adapted the idea to look at refugee origins.
This chart ranks countries of origin of refugees, asylum-seekers, and others in need of international protection, grouped by region.
#RStats #ggplot2 #Refugees
10.09.2025 07:14 — 👍 34 🔁 9 💬 3 📌 0

collection of #rstats and #rspatial books
My personal library's looking healthy 😁
04.09.2025 16:16 — 👍 18 🔁 3 💬 1 📌 1

Lessons from UKCTOCS, a large-scale trial in ovarian cancer screening
UKCTOCS (UK Collaborative Trial of Ovarian Cancer Screening) is one of the largest screening trials in ovarian cancer. More than 200,000 women from England, Wales and Northern Ireland took part in it,
September is #GynaecologicalCancerAwarenessMonth.
#OvarianCancer is the most devastating gynaecological cancer in the UK.
The UKCTOCS trial involved over 200,000 women to explore if screening could save lives, but it wasn’t without challenges.
🎧 Discover the insights in this #TrialTalk episode:
01.09.2025 12:15 — 👍 3 🔁 1 💬 0 📌 0
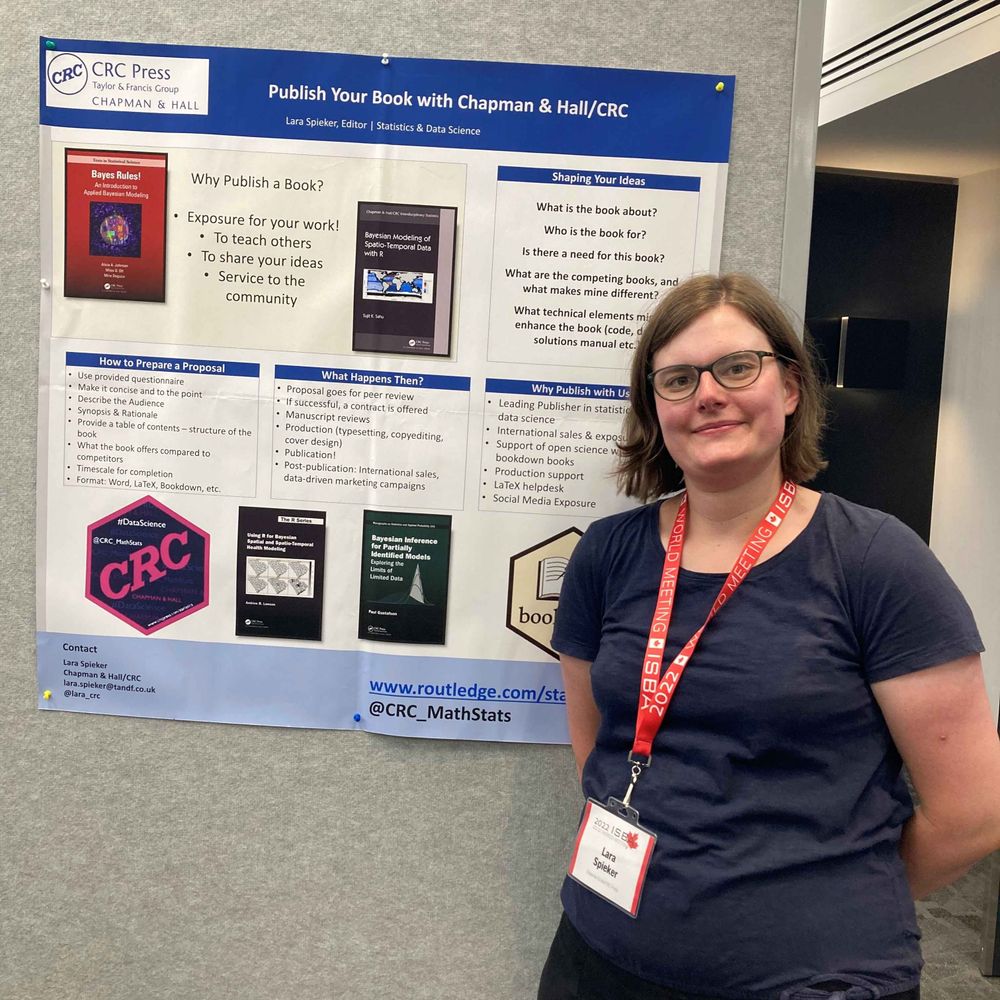
I'm really looking forward to this session!
Some of the things I'll be talking about include:
📖 Writing about #RStats with #QuartoPub
✍️ Working with @laracrc.bsky.social at CRC Press
📊 How it all started with some #TidyTuesday charts!
#StatsEd #DataViz
26.08.2025 14:06 — 👍 6 🔁 2 💬 0 📌 0

Screenshot of slides showing my first and a more recent TidyTuesday visualisation
At @royalstatsoc.bsky.social conference next week, I'll be talking in the 'Book Publication as a Scholarly Activity for Statisticians' session @ 11.30 on Thu 4 Sep - which I'm really excited about!
(Very subtle announcement that there's a #DataViz book from me coming soon!)
#StatsEd #RSS2025Conf
26.08.2025 14:22 — 👍 24 🔁 3 💬 1 📌 0

Chart styled to look like sheet music showing the happiness scores of funk and soul songs, by male/female/mixed songwriting teams. A cluster of happy songs by male songwriters is seen in the mid-1970s.
For this week's #TidyTuesday data about Billboard Hot 100 Number Ones, I decided to make a sheet music-themed chart 📊 - that will probably manage to annoy #DataViz people as much as music people! 🎶
Thanks to @jenrichmondphd.bsky.social for curating the data!
#RStats #ggplot2
27.08.2025 08:57 — 👍 41 🔁 7 💬 12 📌 1
Just in time for the start of a new school year - a podcast discussion of evaluating student success. Also check out other Stats+Stories education-related #podcast episodes #EduSky
statsandstories.net/education
21.08.2025 14:22 — 👍 3 🔁 2 💬 0 📌 0
CRAN: "thanks, package heplots_1.7.8.tar.gz is on its way to CRAN!"
Added a distancePlot(), a very nice diagnostic plot for multivariate linear models.Shows leverage & outliers together
in a way that shows both problems.
See: friendly.github.io/heplots/
19.08.2025 01:15 — 👍 9 🔁 3 💬 0 📌 0

Book cover of Spatial Linear Models for Enviornmental Data, dark blue background with white pattern with a picture of caribou and data plots
Happy Friday 🌍! We are giving away one copy of 'Spatial Linear Models for Environmental Data'. To enter, simply follow me and re-post this by the end of Sunday, August 17. #spatial #environment # #data #StatsSky routledge.com/9780367183349 not associated with bsky
15.08.2025 09:56 — 👍 7 🔁 8 💬 1 📌 1
That's good to hear, I hope you enjoy the book (in full colour) :)
15.08.2025 09:48 — 👍 2 🔁 0 💬 0 📌 0
So sorry about that too - would you mind dropping me an email with the details (lara.spieker@tandf.co.uk) and I can look into getting a replacement copy for you?
15.08.2025 09:14 — 👍 2 🔁 0 💬 1 📌 0
So sorry to hear you got a faulty copy - could you please drop me an email (lara.spieker@tandf.co.uk) and I can get a replacement (colour!) copy sent out to you?
14.08.2025 11:22 — 👍 2 🔁 0 💬 1 📌 0
some light teasing for an upcoming quarto revealjs plugin I have been working on
12.08.2025 19:03 — 👍 61 🔁 9 💬 7 📌 4

Taylor 🐿️ & Francis 🦔 are enjoying hanging out at their booth at #MathFest2025!
@joinmaa.bsky.social @tandfresearch.bsky.social
07.08.2025 21:35 — 👍 6 🔁 2 💬 0 📌 0

📍 Registration is open for Spatial Data Science across Languages (SDSL) 2025 – Sept 17–18 (+19), Salzburg, Austria.
Connect R, Python, Julia & more in spatial science.
🔗 https://forms.gle/E9fpG88V2VQQKmjk9 -- Apply for on-site by mid-July – limited spots […]
[Original post on fosstodon.org]
23.06.2025 14:01 — 👍 11 🔁 9 💬 0 📌 0

Beauty in/of mathematics: tessellations and their formulas
@tandfresearch.bsky.social #mathart #tessellations www.tandfonline.com/doi/full/10....
23.06.2025 12:16 — 👍 11 🔁 2 💬 0 📌 0
Data/govt etc freelancer gavinfreeguard.com
Starting sotf.org.uk
@connectedbydata.org, Data Bites @publicdigital.bsky.social, @instituteforgovernment.org.uk, Think Digital Partners, @kinship.works, @transformgovtalks.bsky.social
Pic @paulclarke.com
The campaign for communities to have a powerful say on data and AI, to help create an equitable and sustainable world.
connectedbydata.org
Data nerd/wonk. Founder of Connected by Data, campaigning for communities to have a powerful say over data and AI.
Into trans rights, neurodiversity, board games, lego, dogs, spreadsheets.
www.jenitennison.com
Director of Research & Practice at @ConnectedByData.org working on participatory and open governance of tech. Adoptive parent.
Head of Delivery & Operations for Connected by Data. #RunningIsFunning, fundraiser for Jane Tomlinson Appeal, Trustee: LGBT+ Consortium & Reading List Foundation. 🏳️🌈 She/Her.
https://linktr.ee/emilyjmacaulay
Building a fairer UK justice system within everyone’s reach.
Data/AI policy @adalovelaceinst.bsky.social
(Political) philosophy of tech @lsegovernment.bsky.social @lsepoltheory.bsky.social
Views my own 🔮✨
🏳️🌈🏳️⚧️
Research and policy adviser www.abdconsultancy.co.uk
Futures of work, digital welfare state, tech ethics, public sector innovation
Also cats, telly, general silliness
Now with added newsletter! https://www.abdconsultancy.co.uk/digital-welfare-state
Legal and Policy Officer @openrightsgroup.bsky.social
"Between a high, solid wall and an egg that breaks against it, I will always stand on the side of the egg." - cit.
Data protection, ArtificiaI intelligence, Social media pluralism, UK - EU regulation
An independent research and development institute exploring how new technologies are transforming work and working lives. http://www.ifow.org
Subscribe to our newsletter: https://www.ifow.org/newsletter
We are Careful Trouble. We are a research studio and a social enterprise, helping make technologies work better for more people, more of the time.
🌍 carefultrouble.net
Hopeful technologist.
Community tech, careful innovation, socially progressive tech policy.
https://www.careful.industries
https://hopeful.technology
https://buttondown.email/justenoughinternet
DMs don't work but hello@careful.industries will find me
🌈 Feminist Senior Lecturer in data politics and social justice at City st. George's, Uni of London, UK. She/her.
https://elinorcarmi.com/
Working on data politics/feminist data/data&AI literacies/data justice/digital rights/ad tech industry/surveillance.
Associate director for economic policy & AI @IPPR. Former Bank of England economist and IMF fellow.
IPPR is the UK’s leading progressive think tank.
Find out more here: linktr.ee/IPPR
Senior Policy Advisor at JRF (@jrf-uk.bsky.social) focusing on communities and place
she/her
Views my own.
We work to speed up and support the transition to a future free from poverty, in which people and planet can flourish.
https://www.jrf.org.uk/
Campaigning to shift power on data and AI with @Connectedbydata.org and the Trades Union Congress @the-tuc.bsky.social
Tech, AI, Digital Public Infrastructure and old border foils at @Chatham House. Fellow @ ISD, Demos, Public AI network
- Director @adalovelaceinst.bsky.social:ensuring data & AI work for ppl & society
- Stint in government - led #NationalDataStrategy; roles in Cabinet Office, ONS & MHCLG
- Charity roles inc. Samaritans Trustee; staff @ The RSA, Centrepoint, ParkinsonsUK