Why do I have to pretend that I'm going to print something in order to save it as a PDF. Why do I have to engage in a little ruse.
23.02.2026 21:43 —
👍 19285
🔁 2922
💬 344
📌 1
🆕 Several Earth system components may be closer to destabilisation than previously thought. Crossing key temperature thresholds could trigger feedback loops, pushing the planet toward a “Hothouse Earth” trajectory. Study by @oregonstate.edu, @iiasa.ac.at & PIK: www.sciencedirect.com/science/arti...
11.02.2026 16:52 —
👍 819
🔁 499
💬 35
📌 57

EDGE orbit (orange tracks) extends to the polar regions allowing for dense mapping around the edges of ice sheets and sea ice pack. Credit: EDGE
🛰️BIG NEWS! NASA has selected a
@ucsandiego.bsky.social led satellite mission for the Earth System Explorers program. Led by Scripps Oceanography glaciologist @helen-amanda.bsky.social, Earth Dynamics Geodetic Explorer (EDGE) is one of two next-generation satellite missions selected. 🧵⤵️
06.02.2026 23:32 —
👍 44
🔁 14
💬 1
📌 2
Well done!
02.02.2026 22:00 —
👍 2
🔁 0
💬 0
📌 0

U.S. and global steel production over the past decade. The highlighted year-over-year increase in U.S. output is real but small, and looks very different when shown in context versus a tightly cropped comparison.
another look at this generational chart crime
02.02.2026 21:42 —
👍 41
🔁 18
💬 1
📌 3
Don was visionary leader of SDSS and a wonderful mentor to many postdocs and students at U Chicago, myself included.
16.01.2026 20:10 —
👍 5
🔁 1
💬 0
📌 0
Here is the 2025 version of our annual visualization of global temperatures from GISTEMP. NASA's estimate has 2025 tying 2023 for the second warmest year since 1880 (2024 was the warmest). svs.gsfc.nasa.gov/5603
14.01.2026 20:22 —
👍 5
🔁 1
💬 1
📌 1

A stacked area chart showing the total population (split by World Bank region) living in extreme poverty, defined as living below the International Poverty Line of $3 per day. Shown from 1990 to 2025, with World Bank projections from 2026–2040. The data is adjusted for inflation and cost of living differences.
Rapid progress against extreme poverty in recent decades has slowed and is projected to end.
In 1990, 2.3 billion people lived in extreme poverty. Since then, the number of extremely poor people has declined by 1.5 billion people.
The number of people in extreme poverty is projected to decline, from 831 million people in 2025 to 793 million people in 2030. After 2030, the number of extremely poor people is expected to increase.
The data source is Lakner et al (2024), updated using the World Bank PIP (2025). The chart is licensded CC BY to Our World in Data.
In the last decades, the world has made fantastic progress against extreme poverty. In 1990, 2.3 billion people lived in extreme poverty. Since then, the number of extremely poor people has declined by 1.5 *billion* people. 🧵
17.11.2025 11:24 —
👍 129
🔁 60
💬 4
📌 11
SVS is such a valuable NASA group!!
08.11.2025 00:56 —
👍 7
🔁 1
💬 0
📌 0
Thanks Dan
16.11.2025 00:39 —
👍 1
🔁 0
💬 0
📌 0

Almost Everything About NASA’s Latest Mission to Mars Is Unusual
The New York Times article about the Escapade missions includes a beautiful visualization by the SVS's AJ Christensen.
www.nytimes.com/2025/11/14/s...
15.11.2025 23:05 —
👍 5
🔁 3
💬 1
📌 0

Coffee being sold inside a bank vault.
Coffee prices are skyrocketing and Rise Up Coffee isn't taking any chances.
15.11.2025 22:27 —
👍 4
🔁 0
💬 0
📌 0

Time series of annual GISTEMP data from 1880 onwards with an estimate for 2025 based on Jan-Oct data showing that it will be cooler than 2024, but probably a little warmer than 2023.
Now that the Sept and Oct data are (belatedly) in, it looks like 2025 will be the second warmest year in the record (~80% probability). The last three years are in a class of their own.
15.11.2025 16:54 —
👍 378
🔁 208
💬 10
📌 18


#30DayMapChallenge | Day 2: Lines (Miniature Globes Edition)
For today’s theme, “Lines,” I created a miniature globe of NASA SVS’ Global Sea Surface Currents and Temperature visualization. Look closely to see the mesmerizing ocean eddies!
02.11.2025 19:56 —
👍 18
🔁 2
💬 2
📌 1
Congratulations Gavin!
18.10.2025 16:49 —
👍 4
🔁 0
💬 0
📌 0
my takeaway from climate week nyc is that "climate storytelling" is a little too much "we must reimagine our deepest souls in relationship to mother nature and the moral abyss of the polycrisis into which we must now stare" and not enough "ok but get a heat pump"
28.09.2025 18:52 —
👍 2410
🔁 429
💬 81
📌 76
The different sources of atmospheric methane: svs.gsfc.nasa.gov/5424 a companion to the popular SVS visualization of carbon dioxide from 2023: svs.gsfc.nasa.gov/5110
28.09.2025 16:20 —
👍 14
🔁 8
💬 1
📌 0

This only happens to you once
26.09.2025 19:39 —
👍 21650
🔁 4228
💬 348
📌 181

A photo of a caiman next to a turtle in a tank at the National Aquarium in Baltimore. The head of the caiman is above water and due to refraction its body looks like it is offset to the right by a foot or more.
Refraction
23.08.2025 14:42 —
👍 5
🔁 1
💬 1
📌 1
Atmospheric Carbon Dioxide Concentration
800,000 BCE - July 2025
svs.gsfc.nasa.gov/5447/
15.08.2025 01:55 —
👍 48
🔁 26
💬 0
📌 3
This newly released visualization showing the progression of the Palisades and Eaton fires was the last visualization produced by the SVS's Cindy Starr after an incredible 37 year career.
svs.gsfc.nasa.gov/5558/
12.07.2025 15:29 —
👍 9
🔁 3
💬 1
📌 0
August 1-September 15, 2024
Sorry that it is hard to find. It is listed in the dataset section, but we will make sure it gets bumped up to the main text as well.
12.07.2025 04:00 —
👍 7
🔁 0
💬 1
📌 0
NASA is more than rockets and moonwalks. NASA is behind much of our everyday technology. From space discovery, to Air Jordans, to CAT scans, NASA has played a role. We get it all on less than a penny of every federal dollar. Now their science may be gutted by 50%.
#NASADidThat
10.07.2025 22:39 —
👍 8044
🔁 2619
💬 257
📌 184
A few tips:
1: Open up your aperture as much as you can for more bokeh. Faster lenses are better.
2: Make a mark on your focus ring + lens (I use two narrow strips of masking tape) so you can quickly and repeatedly hit your in-focus point.
04.07.2025 14:36 —
👍 4
🔁 1
💬 1
📌 0
Gorgeous!
04.07.2025 15:08 —
👍 2
🔁 0
💬 1
📌 0
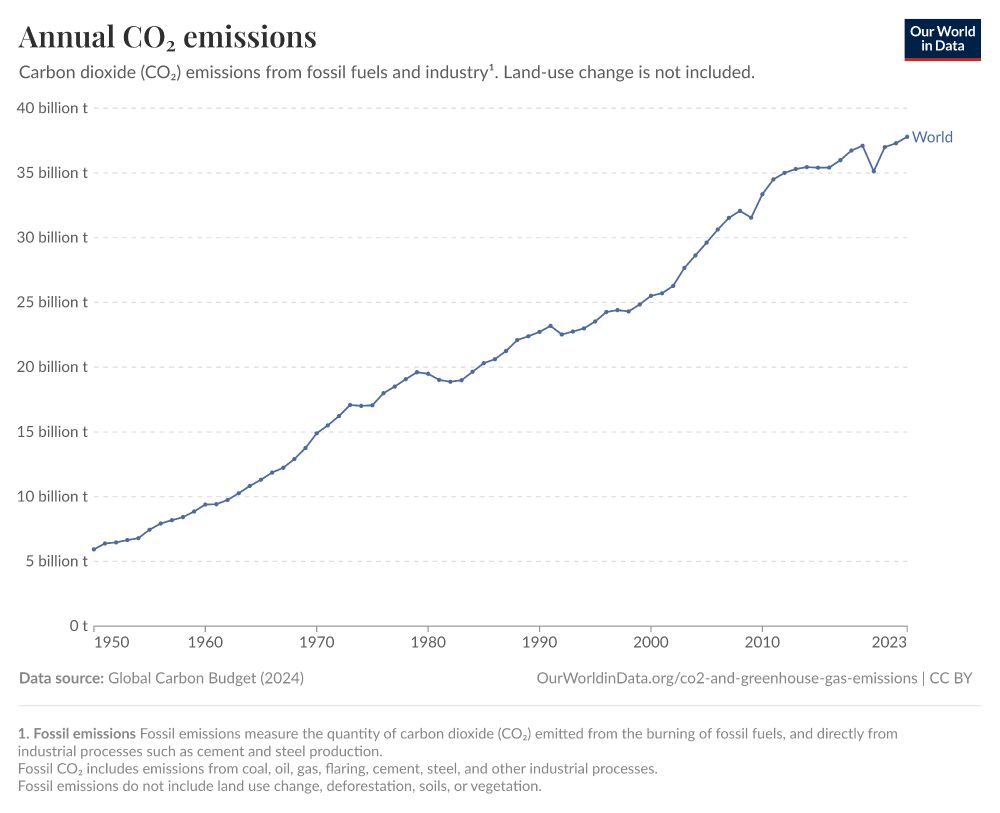
A line chart titled “Annual CO₂ emissions” shows the global carbon dioxide emissions from fossil fuels and industry from 1950 to 2023. The y-axis represents emissions in billions of tonnes (t), ranging from 0 to 40 billion t. The x-axis covers the years from 1950 to 2023.
The chart presents a steady increase in emissions from approximately 5 billion tonnes in 1950 to over 36 billion tonnes in 2023. Key features include:
A consistent upward trend from 1950 through the early 1970s.
A brief plateau and dip around 1980–1983.
A strong growth trend resuming in the late 1980s.
A sharp increase during the 2000s.
A slight drop around 2008–2009, likely due to the global financial crisis.
A major dip in 2020, attributed to the COVID-19 pandemic.
A rapid rebound in emissions after 2020, continuing the upward trend to a new high in 2023.
A blue line labeled “World” traces these changes over time.
Below the chart, the data source is listed as the Global Carbon Budget (2024), and the graphic is credited to OurWorldInData.org with a Creative Commons license (CC BY). A footnote explains that the data includes emissions from coal, oil, gas, flaring, cement, and steel, but excludes land-use changes such as deforestation.
I get annoyed at the narrative that all the awareness and work on climate change hasn't done anything. Yes, global CO₂ emissions indeed continue to climb, but we don't know the counterfactual. When I was in grad school, we were on track for 5°C of warming. Now it's below 3°C. That's progress.
22.06.2025 17:09 —
👍 2000
🔁 447
💬 76
📌 40
The core portion of the Nancy Grace Roman Space Telescope has successfully completed vibration testing, ensuring it will withstand the extreme shaking experienced during launch: go.nasa.gov/4jNWjcK 🔭 🧪
10.06.2025 15:23 —
👍 170
🔁 28
💬 3
📌 5

NASA is our best US brand name. Proposed cuts to NASA will destroy our position of leadership in space science and exploration ! Tell Congress: Save NASA Science congressweb.com/PlanetarySocie… #
02.06.2025 20:31 —
👍 378
🔁 108
💬 14
📌 2