Map of 24 hour rainfall totals across southern Illinois, from CoCoRaHS observers.
Nothing to see here... just southern Illinois getting more precipitation in a single day than they got all of winter.
#CoCoRaHS observers reporting the improvement in drought!
05.03.2026 13:30 —
👍 3
🔁 0
💬 1
📌 0

Table that shows the 10 driest months on record in Moline, Illinois and the Quad Cities area. Records in Moline go back to 1872.
Rain is finally in the forecast for Illinois, and we need a lot of rain after yet another very dry month.
February is the only month on record in Moline with no measurable precipitation (T = trace), and is the driest month in the Quad Cities since (at least) the Ulysses S. Grant administration.
02.03.2026 15:35 —
👍 6
🔁 3
💬 0
📌 0

Most of IL is in drought. Tell us how this is impacting you by submitting a Condition Monitoring Observer Report at droughtimpacts.unl.edu/Tools/Condit.... The reports are used by the US Drought Monitor and @ilclimatologist.bsky.social to better understand what is happening around the state #ilwx
13.02.2026 15:46 —
👍 8
🔁 4
💬 0
📌 0

Snow-to-Liquid Ratio Overview - Mount Washington Observatory
Snow-to-Liquid Ratio Overview
By Charlie Peachey
Collecting the Precip Can for measurements.
Forecasting and measuring precipitation in the winter is often a difficult process at the summit. The t...
Why did so much snow yield so little precipitation? The cold air limited the amount of liquid water in the snow.
We had snow-to-liquid ratios of 20:1 last month, which is more like the champagne powder of Colorado instead of the normal Midwest slush. 2/2
See: mountwashington.org/snow-to-liqu...
04.02.2026 13:25 —
👍 6
🔁 2
💬 0
📌 0

Maps show January total snowfall and January snowfall as a percent of normal across Illinois. Data source: NOHRSC gridded snowfall analysis.
January in Illinois was cold, snowy, and dry... thanks to abundant but powdery snowfall.
Du Quoin had 19.5" of snow last month, which is 500% of their snowfall normal. Yet, Du Quoin was 2" drier than average last month with only 0.97" of total precipitation. 1/2
go.illinois.edu/scosummary
04.02.2026 13:25 —
👍 24
🔁 7
💬 3
📌 0

Table showing the top ten driest 6-month periods on record in Bloomington-Normal, Illinois. The records go back to 1893.
So, it's still really dry across Illinois. January brought snow, but not so much precipitation to give us some relief.
To give some idea of how dry it's been since August... the last 6 months is the 5th driest of any 6 month period on record in Bloomington-Normal, with only 7.10".
02.02.2026 17:23 —
👍 5
🔁 2
💬 0
📌 0

A map that shows 7-day average nighttime low temperature rankings across the Midwest United States. The map comes from the Southeast Regional Climate Center at https://sercc.oasis.unc.edu/.
Average nighttime low temperatures last week were top 5 highest on record across the Midwest, 5 - 10 degrees warmer than average.
The Southeast RCC's tool shows Chicago's temperatures last week were similar to normal temperatures in Orlando.
sercc.oasis.unc.edu/Map.php?regi...
30.06.2025 13:31 —
👍 5
🔁 1
💬 0
📌 0

CoCoRaHS observers are especially critical in summer when rainfall varies a lot.
Yesterday, we had 0.21" at our Water Survey station, Willard Airport got a big goose egg, and some parts of Champaign picked up >2".
Consider joining CoCoRaHS to help fill in those gaps across Illinois: cocorahs.org
17.06.2025 13:46 —
👍 3
🔁 0
💬 0
📌 0
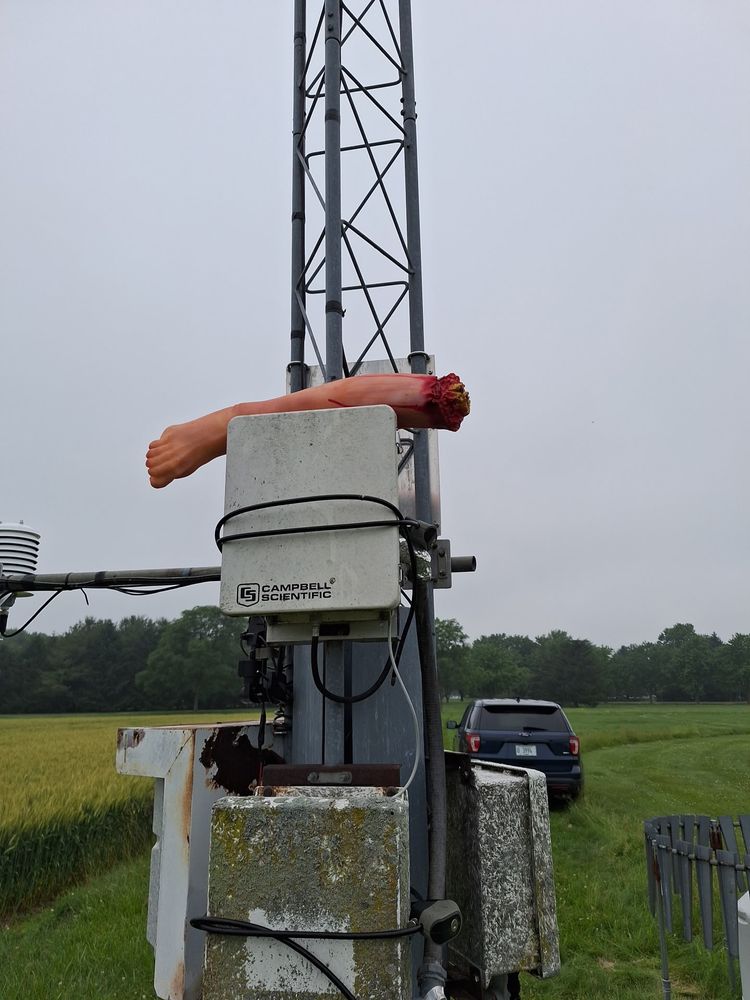
You find the most interesting things at monitoring stations. Thankfully it was fake. @prairieresearch.bsky.social
09.06.2025 12:36 —
👍 4
🔁 3
💬 1
📌 0

Next week, the National Integrated Heat Health Information System (#NIHHIS) is hosting a Heat Safety Week to provide information about #heat risks and ways to stay safe this summer.
Follow along with #HeatSafety. Visit Heat.gov for more information about heat.
14.05.2025 17:25 —
👍 42
🔁 13
💬 0
📌 0

Map of CoCoRaHS precipitation measurements from May 13th in Bloomington-Normal
#CoCoRaHS is an invaluable part of weather monitoring in the US all year long, and especially so when we have small-scale convective events that produce huge differences in rainfall over small scales.
See the 3" rainfall gradient across Bloomington-Normal yesterday. #ilwx
cocorahs.org
14.05.2025 16:36 —
👍 7
🔁 0
💬 0
📌 0
The implications of warming winters in the Great Lakes region (like changes in lake stratification) are often under-reported relative to weather extremes like flooding and heat. But, they are nonetheless impactful.
08.04.2025 15:28 —
👍 5
🔁 0
💬 0
📌 0

Current and forecasted stage of the Ohio River at Old Shawneetown, Illinois.

Map of 7-day total precipitation as of Sunday, April 6 across the Ohio River Basin.
Historic rainfall across the Ohio River Basin (watershed average of 5.13" in the last 7 days) has caused widespread flooding along the River and its tributaries.
The Ohio River at Old Shawneetown, IL is expected to crest over 53', the 6th highest crest on record and the highest since May 2011.
07.04.2025 12:58 —
👍 46
🔁 19
💬 3
📌 2


This is a particularly dangerous situation for this region. Everyone in this area should take action now (e.g., charge your phones, make sure sump pump is working, have fresh batteries, etc.), and monitor forecasts and stay weather aware today through Saturday.
02.04.2025 12:33 —
👍 1
🔁 0
💬 0
📌 0
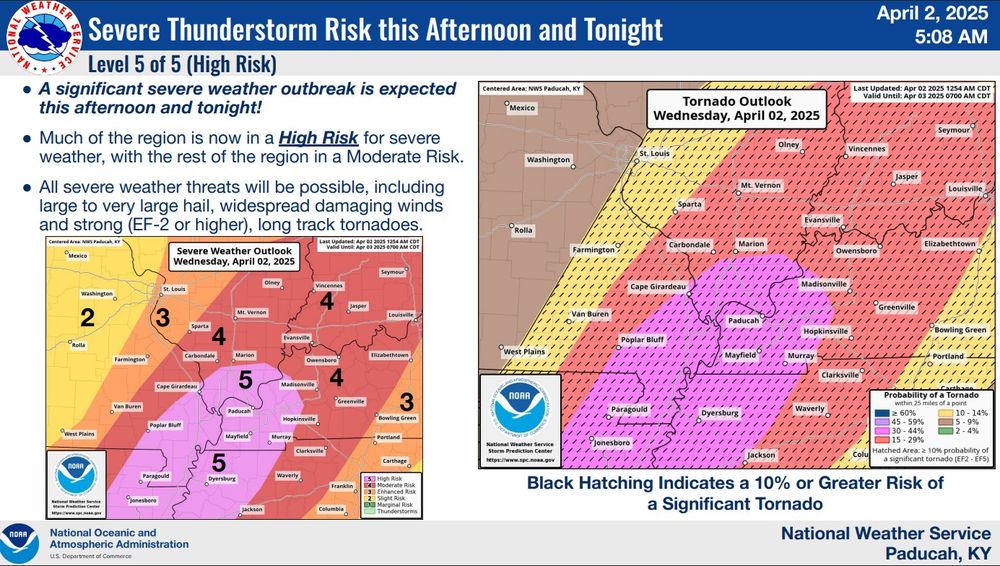
Maps of severe weather risk on Wednesday, April 2nd across the southern Midwest, courtesy of the National Weather Service Paducah office.

Maps of forecasted rainfall amounts between Wednesday and Saturday across the southern Midwest, courtesy of the National Weather Service Paducah office.
Key messages from @nws.noaa.gov Paducah office:
-> a very dangerous weather pattern today and this weekend
-> High risk of severe weather on Wednesday
-> Potentially catastrophic flooding... entire region is expected to get at least 7 - 10" thru Saturday
www.weather.gov/media/pah/Ds...
02.04.2025 12:33 —
👍 2
🔁 1
💬 1
📌 0
NWS in Paducah dropped a “catastrophic” this afternoon regarding the upcoming Ohio valley flooding potential. So that’s great.
01.04.2025 19:56 —
👍 45
🔁 5
💬 6
📌 0
More severe weather and likely widespread flooding in southern Illinois are highlighted in this morning's briefing from @nws.noaa.gov Paducah.
www.weather.gov/media/pah/Ds...
It is VERY important to stay weather aware this week across Illinois!
31.03.2025 18:24 —
👍 2
🔁 1
💬 0
📌 0

Map of March-to-date daily maximum temperature rankings across the Midwest US.
Spring has been kind of sneaky warm so far in the Midwest. March-to-date average daily high temperatures have been in the top 10 on record in many places, including 4th warmest in St. Louis.
Shout out to Southeast Regional Climate Center:
sercc.oasis.unc.edu/Map.php?regi...
27.03.2025 19:12 —
👍 2
🔁 1
💬 0
📌 0
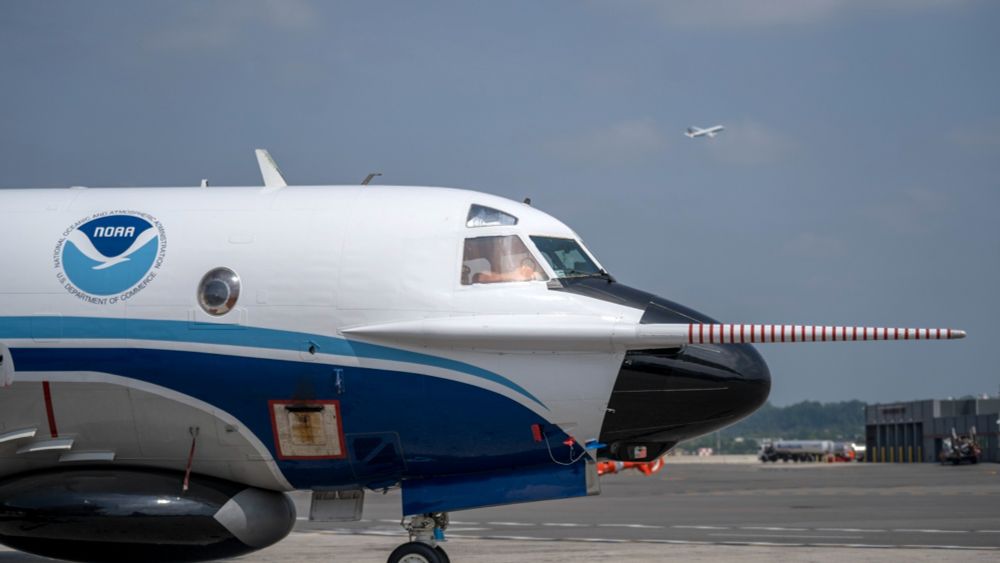
While we commemorate this disaster, we should also praise the advances in weather prediction, communication, planning, and warning that have saved countless lives in the last 100 years.
These are made possible by publicly funded science and the dedication of NOAA and the National Weather Service.
18.03.2025 13:05 —
👍 3
🔁 0
💬 0
📌 0

Photo of tri-state tornado damage to Longfellow School in Murphysboro, Illinois. Credit: Jackson County Historical Society
The tri-state tornado, the US's deadliest tornado, occurred 100 years ago today. Over 700 deaths, including 234 lives lost in Murphysboro, Illinois. The tornado had an estimated 219 mile-long path through three states.
Check out @nws.noaa.gov Paducah's great page: www.weather.gov/pah/1925torn...
18.03.2025 13:05 —
👍 8
🔁 5
💬 1
📌 0

Water table levels on March 1st measured at the WARM network's Peoria site (ICC). The blue area indicates the depth of the saturated zone below the surface.
The precipitation across central and northern Illinois the last 2 days was much welcome to help recharge very dry soils.
The water table at @warm-isws.bsky.social site in Peoria is about 10 feet deep. That means we have to dig down 10 feet to hit saturated soil, compared to 3-4 feet normally.
05.03.2025 14:29 —
👍 3
🔁 2
💬 0
📌 0
Fortunately, we have a dream team to meet these challenges, including @cristiproist.bsky.social, @latinwx.bsky.social, and partners with @readyillinois.bsky.social, @prairieresearch.bsky.social, @climasuiuc.bsky.social, and NCSA.
Next: on to southern Illinois for more feedback and discussion. 3/3
04.03.2025 13:25 —
👍 4
🔁 0
💬 0
📌 0
The precarious status of federal climate, hazard, and vulnerability information resources reinforces the need for this work in Illinois, which was reflected in the group's discussion.
EMs, planners, and decision makers need clear, high fidelity local information on actionable timescales. 2/3
04.03.2025 13:25 —
👍 3
🔁 1
💬 1
📌 0

Photo of presentation at the workshop on future climate information in central Illinois on March 4th.
Workshop #2 on climate and hazard information needs of emergency managers and planners - this time in central Illinois. Great insights from participants that will help us continue to build a climate information system for Illinois.
Thanks @illinoisstate.bsky.social for hosting us!
1/3
04.03.2025 13:25 —
👍 7
🔁 1
💬 1
📌 0

Total precipitation from in January and February each year between 1889 and 2025 in Champaign, Illinois.
2025 so far has been very dry in east-central Illinois. Champaign-Urbana has had only 1.37" of precipitation since the start of the year, which is the driest first two calendar months there since 1920. #ilwx
02.03.2025 21:30 —
👍 1
🔁 0
💬 0
📌 0
Snow has been a rarity so far this season in Chicago.
As of this morning (and ahead of the potential for significant snowfall) the city has only had 10.1" of snow this season, which is 9th lowest on record through February 12, and the lowest since 1931. #ilwx
12.02.2025 15:13 —
👍 3
🔁 1
💬 0
📌 0

Women and girls belong in science, and their inclusion fosters innovation.
In 2025, we join the United Nations to celebrate 10 years of the International Day of Women and Girls in Science—a key milestone in advancing gender equality and empowering women globally.
11.02.2025 12:48 —
👍 315
🔁 111
💬 4
📌 8

Nuclear power plant to help reduce flooding, ice jam risk along Kankakee River
A nuclear power plant is helping to reduce the chance of flooding along the Kankakee River.
A warm up following prolonged cold - as expected this weekend - increases the risk of ice jams on Illinois streams, and the Kankakee River is particularly vulnerable to jams and flooding.
@nws.noaa.gov flood advisory: forecast.weather.gov/wwamap/wwatx...
www.fox32chicago.com/news/nuclear...
30.01.2025 13:15 —
👍 2
🔁 0
💬 0
📌 0