RDM Weekly - Issue 021
A weekly roundup of Research Data Management resources.
RDM Weekly Issue 21 is out! 📬
- Project Structure slides @djnavarro.net
- AI TutoR @emilynordmann.bsky.social
- Data Documentation and Validation @lmu-osc.bsky.social
- Request for Reading Data @jessicatoste.bsky.social @emilyafarris.bsky.social
and more!
rdmweekly.substack.com/p/rdm-weekly...
11.11.2025 14:00 — 👍 19 🔁 6 💬 0 📌 2

The value of public R&D
Government has published one of those quiet but important documents that might get overlooked as it is not 'newsy'. The headline finding is that £1 of public R&D investment generates £8 in net economic benefits for the UK over the long term
www.gov.uk/government/p...
30.10.2025 13:28 — 👍 631 🔁 357 💬 8 📌 18
There still seems to be a lot of confusion about significance testing in psych. No, p-values *don’t* become useless at large N. This flawed point also used to be framed as "too much power". But power isn't the problem – it's 1) unbalanced error rates and 2) the (lack of a) SESOI. 1/ >
31.10.2025 08:13 — 👍 111 🔁 42 💬 2 📌 9
Thanks.
20.10.2025 12:54 — 👍 0 🔁 0 💬 0 📌 0

Causal inference interest group, supported by the Centre for Longitudinal Studies
Seminar series
20th October 2025, 3pm BST (UTC+1)
"Making rigorous causal inference more mainstream"
Julia Rohrer, Leipzig University
Sign up to attend at tinyurl.com/CIIG-JuliaRohrer
Happy to announce that I'll give a talk on how we can make rigorous causal inference more mainstream 📈
You can sign up for the Zoom link here: tinyurl.com/CIIG-JuliaRo...
06.10.2025 11:43 — 👍 162 🔁 59 💬 5 📌 11
Will a recording of this one be made available?
20.10.2025 08:00 — 👍 1 🔁 0 💬 1 📌 0

❗️Our next workshop will be on Oct 16th, 6 pm CEST titled Structural Bayesian Techniques for Experimental and Behavioral Economics in R& Stan by @jamesbland.bsky.social
Register or sponsor a student by donating to support Ukraine!
Details: bit.ly/3wBeY4S
Please share!
#AcademicSky #EconSky #RStats
10.10.2025 09:14 — 👍 12 🔁 12 💬 1 📌 5

Join us, and invite your siblings, as Quantitude gets Wild tomorrow…
06.10.2025 13:12 — 👍 5 🔁 2 💬 0 📌 0

Rookie scientists make research teams more innovative
Papers from research teams with a substantial number of beginners are highly disruptive and innovative, study shows.
Beginner's charm 😊
Want to do disruptive #science? Papers from #research teams with a substantial number of beginners are highly disruptive and innovative, a new study shows. www.nature.com/articles/d41... @nature.com #ScienceCareer
30.09.2025 11:06 — 👍 11 🔁 2 💬 0 📌 0

Popularity of the first name Bo correlates with Zimmer Biomet Holdings' stock price (ZBH) (r=0.918)
30.09.2025 13:34 — 👍 1 🔁 1 💬 0 📌 0

In chess, everyone understands that a new player starts by learning the basics like how the pieces move.
In education, the same is true - but it's much less well understood.
Latest on our Substack - 3 things education can learn from chess.
substack.nomoremarking.com/p/three-thin...
24.06.2025 10:24 — 👍 7 🔁 4 💬 0 📌 0
Sample: I'm so random *holds up spork*
24.06.2025 11:26 — 👍 15 🔁 2 💬 1 📌 0
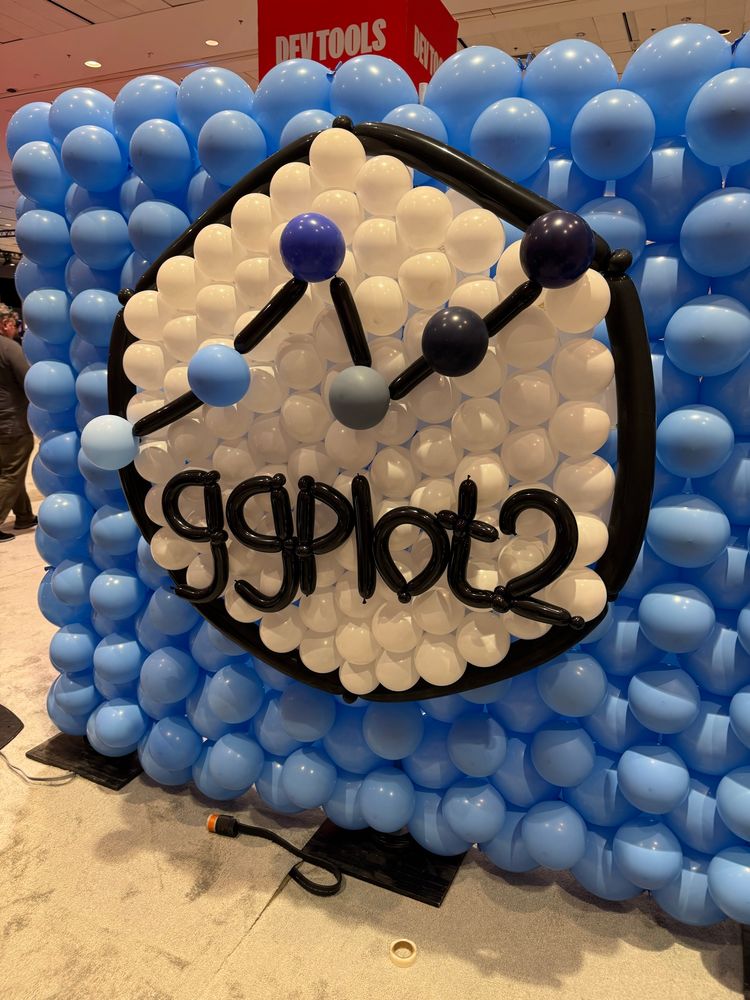
Balloon wall art inspired by the ggplot2 hex sticker. The display features a hexagonal frame made of black balloons, filled with white balloons inside and surrounded by a background of light and dark blue balloons. A line graph with black balloon segments and round coloured nodes runs across the centre, and the word “ggplot2” is spelled out in black balloon letters below the chart.
Happy 18th birthday ggplot2! #rstats
10.06.2025 23:56 — 👍 860 🔁 163 💬 16 📌 21
Data skills are life skills: why we need stats in the classroom
Our vice-president for education & statistical literacy @sophiebays.bsky.social writes for OCR on why statistics is an essential life skill and why we need the curriculum updated to reflect this
09.06.2025 08:49 — 👍 2 🔁 2 💬 0 📌 0


#OTD 1918 Frank Anscombe b (d 17 Oct 2001) UK. ASA Fellow 1956. BIL of John Tukey. Best known for Anscombe's quartet, the most compelling argument ever made why data should be plotted before analysis. /3
13.05.2025 09:22 — 👍 4 🔁 2 💬 1 📌 0

The ASA has a book club! Follow the group on LinkedIn at www.linkedin.com/sho... and connect with other statisticians who share your love of reading. Upcoming book is "Talking to Strangers" by Malcolm Gladwell. Sign up by May 23. lnkd.in/eh6ey7iQ
13.05.2025 13:28 — 👍 4 🔁 2 💬 0 📌 1

Google searches for 'matt levine' correlates with The number of college administrators in Ohio (r=0.952)
13.05.2025 13:30 — 👍 2 🔁 1 💬 0 📌 0
This is getting lots of attention - check the thread. I want to emphasize the basic problem: Just because you have randomized (or pseudo-randmized) a treatment, that doesn't mean you can reliably estimate interactions with that treatment. Which means post-strat prediction for population not possible
12.05.2025 07:03 — 👍 85 🔁 13 💬 5 📌 0
This is really important. Do NOT use the AI summaries at the top of google searches. Ignore them. This is especially important if you don't have any prior knowledge about the topic, but also a good general rule.
Search sources, scrutinize them carefully and double-check with other sources.
25.04.2025 13:40 — 👍 1947 🔁 991 💬 73 📌 92

Pencils of varying sizes underneath a fever chart.
The new issue of the "Journal of Statistics and Data Science Education" explores AI in teaching, experiential learning, Bayesian analysis in K–12, and more! Plus, a call for papers on AI in the classroom. www.tandfonline.com/toc/ujse20/c.... #DataScience #StatisticsEducation #AIinEducation
23.04.2025 17:51 — 👍 6 🔁 4 💬 0 📌 0

Best Practices for Data Visualisation
Insights, advice, and examples (with code) to make data outputs more readable, accessible, and impactful
📊 Best Practices for Data Visualisation
By Andreas Krause, Nicola Rennie & Brian Tarran — A fantastic guide from the Royal Statistical Society on making clear, accessible, and impactful data visuals.
🔗 Read the guide: buff.ly/JEPX0Cb
More R resources 👉 buff.ly/MSQa1kh
#RStats #DataViz
21.04.2025 16:06 — 👍 11 🔁 2 💬 0 📌 0
👇 these workshops look great.
Dealing with Duplicate Data in R, April 25th
Smart Extraction: Converting PDF Tables into Usable Data with R, May 1st
Retrieving and Generating Data using LLMs in Python, May 8th
19.04.2025 12:53 — 👍 2 🔁 3 💬 0 📌 0
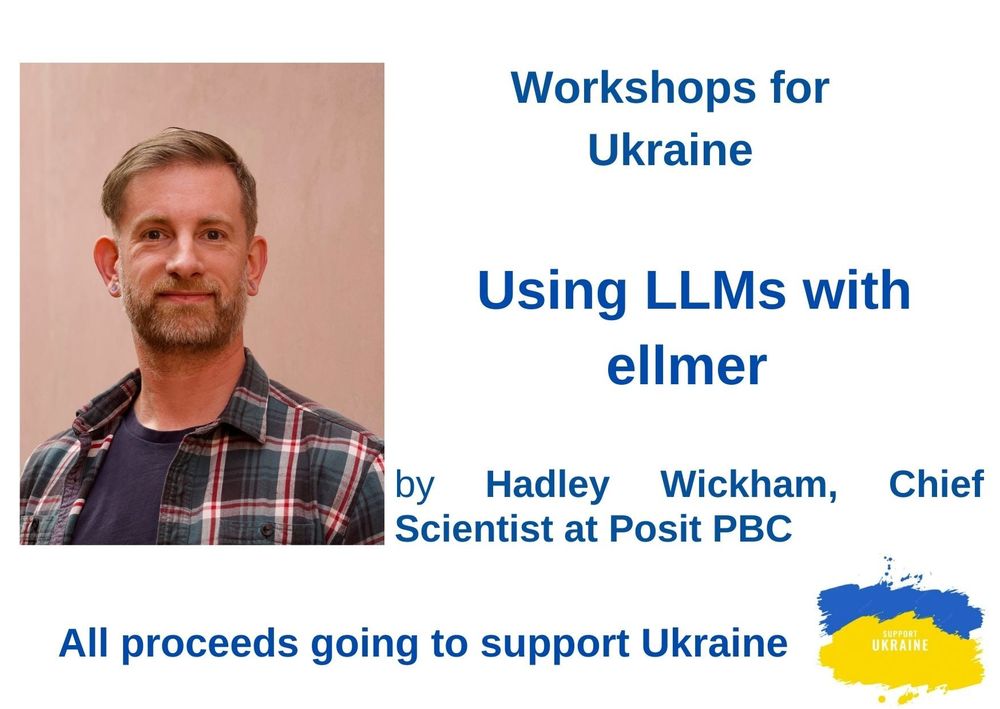
On June 13, we will have a workshop on Using LLMs by @hadley.nz
More info: bit.ly/4jmEAJW
Please share!
#RStats #EconSky #AcademicSky
19.04.2025 08:45 — 👍 97 🔁 31 💬 4 📌 5

Rethinking our approach to maths anxiety
Farhana Gokhool, Anthea Cowen and Julie Hulme argue that distinguishing typical maths apprehension from clinical anxiety enables more effective support and inclusive teaching
Last week on Wonkhe: Farhana Gokhool, Anthea Cowen and Julie Hulme argue that distinguishing typical maths apprehension from clinical anxiety enables more effective support and inclusive teaching
20.04.2025 13:00 — 👍 0 🔁 1 💬 0 📌 0
>The earliest statisticians would spend hours thinking about their assumptions and models because the computations themselves might have taken days.
Today we call those people Bayesians
21.04.2025 06:36 — 👍 63 🔁 11 💬 1 📌 0

de Sitter xkcd.com/3077
17.04.2025 06:42 — 👍 2298 🔁 131 💬 56 📌 13
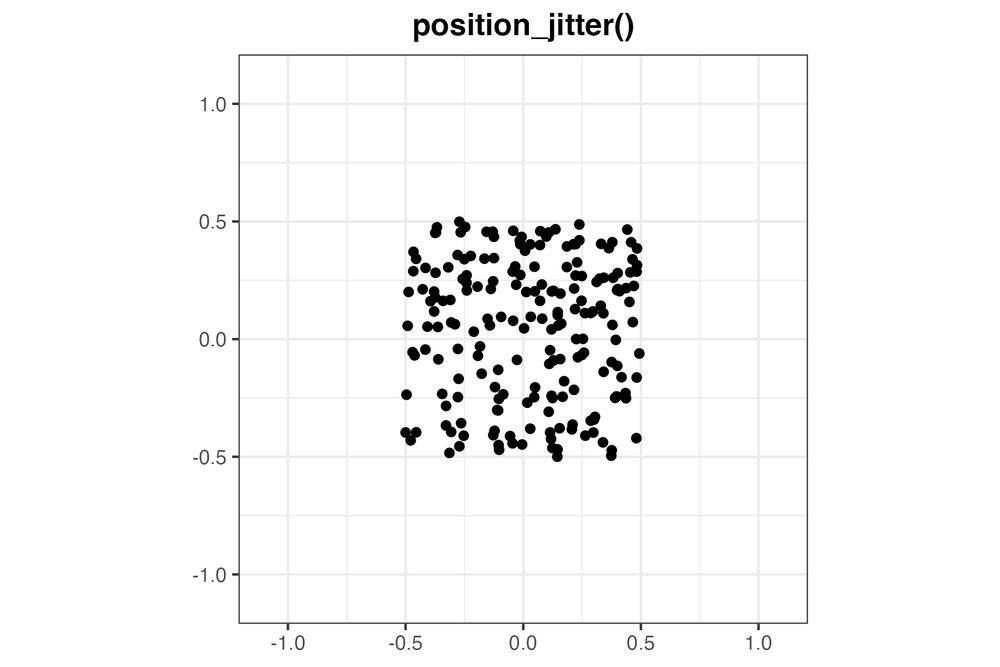
position_jitter()

position_jitter_ellipse()
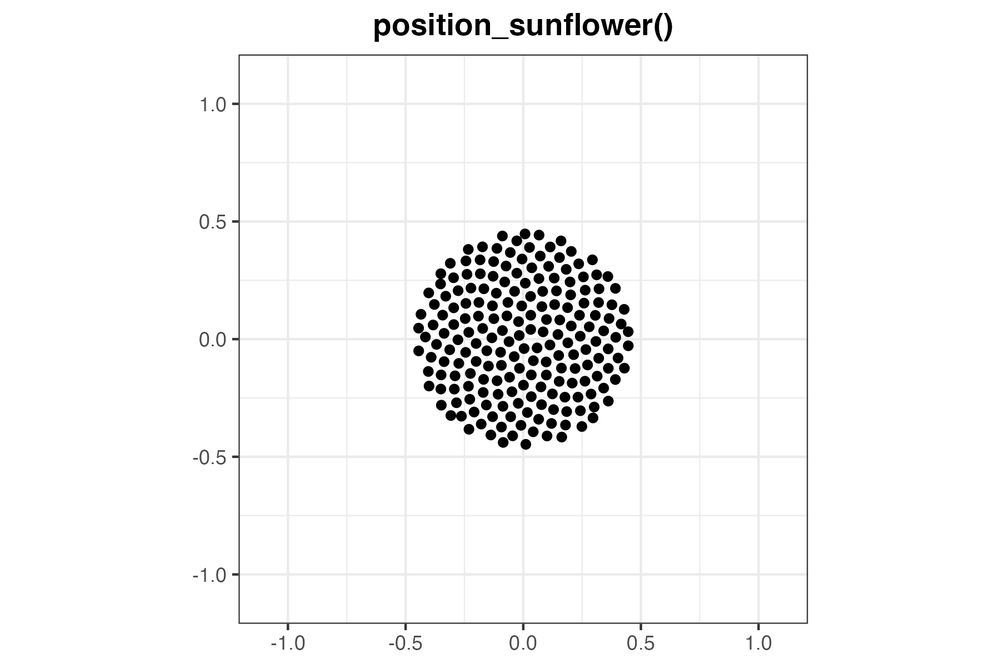
position_sunflower()

position_circlepack()
New visualization tool alert!
The vayr package version 1.0.0 is now on CRAN.
It contains position adjustments for ggplot2 that help with overplotting in pleasing ways. My favorite is position_sunflower().
- install.packages("vayr")
- alexandercoppock.com/vayr
#rstats #ggplot2 #dataviz
16.04.2025 19:53 — 👍 194 🔁 53 💬 3 📌 3
Assistant prof at Utrecht University, trying to make science as reproducible as non-scientists think it is. Blogs at @the100ci.
Economist at UToledo. 🇦🇺 Bayesian Econometrics for economic experiments and Behavioral Economics
Free online book on this stuff here: https://jamesblandecon.github.io/StructuralBayesianTechniques/section.html
https://sites.google.com/site/jamesbland/
He/his
Personality & subjective well-being; Interested in open science & research practices. Editor at JPSP:PPID. Web: richlucas.org Blog: http://deskreject.com @richlucas@mastodon.social
Supporting the impact of the UK Data Service @ukdataservice.bsky.social
Data Impact blog: http://blog.ukdataservice.ac.uk
Other impact activities: https://ukdataservice.ac.uk/impact/
Email us at: ukdsimpact@jisc.ac.uk
Prof. Most tweets about R. “Polisci, it’s all about what’s going on.”
http://arelbundock.com
Research Scientist at the University of Washington based in Brooklyn. Also: SFI External Applied Fellow, Harvard BKC affiliate. Collective Behavior, Statistics, etc..
Social/Personality Psychology, Michigan State University | ♥ Burritos+Vinyl+ | if there aren’t typos, I didn’t write it
Award-winning podcast on the history, philosophy & social studies of science brought to you by graduate students from the University of Melbourne.
Season 5 hosted by @tespiteri.bsky.social
🔗 https://linktr.ee/thehpspodcast
👨🏫 Statistics, Data Science and Ethical ML
📍 Oxford // London
🏃♂️🧶📖 ☕ 🏳️🌈
Royal Statistical Society Section for Teaching Statistics. The views here reflect the author and not necessarily the Royal Statistical Society.
Lecturer in Statistics @CardiffUni | Lifeboat Coxswain @SevernRescue | Advanced Instructor @BSAC | Commercial Skipper @RYA | Vegan | Republican | YesCymru | Remain | Pacifist
Researchers of Statistics Education Network. An inclusive, global community for statistics education researchers & scholars. || Owner of the #StatsEd feed. || #RoSE2025Conf - 31st July 2025 || rose-network.org
PhD, FHEA, Assistant Professor, mother | Creator of SASS | Deputy Director of RoSE | Famous for a 10 sec Countryfile appearance | Autistic academic
Lectures #stats #biostats #Rstats at the University of Auckland, Aotearoa NZ.
Posts may also contain 🐕🐕
Psychology lecturer at UoG 🏴
All things data skills, statistics, quant research methods, and HE pedagogy. #rstats
🗣️🇬🇧🇩🇪
Computational social scientist, random crafter, disabled non-binary cyborg and fan of amazement, movement, humour, insight and my dog. 🦓🏳️⚧🏳️🌈🤖
Assistant Professor at the Medical College of Wisconsin. 🧀
Substance use, neuroscience, genetics, & development. 🧠🧬🍺
Rock climber & dad. He/him. 🧗
Opinions my own. 🤔
bearlab.science 🐻
Personality psych & causal inference @UniLeipzig. I like all things science, beer, & puns. Even better when combined! Part of http://the100.ci, http://openscience-leipzig.org
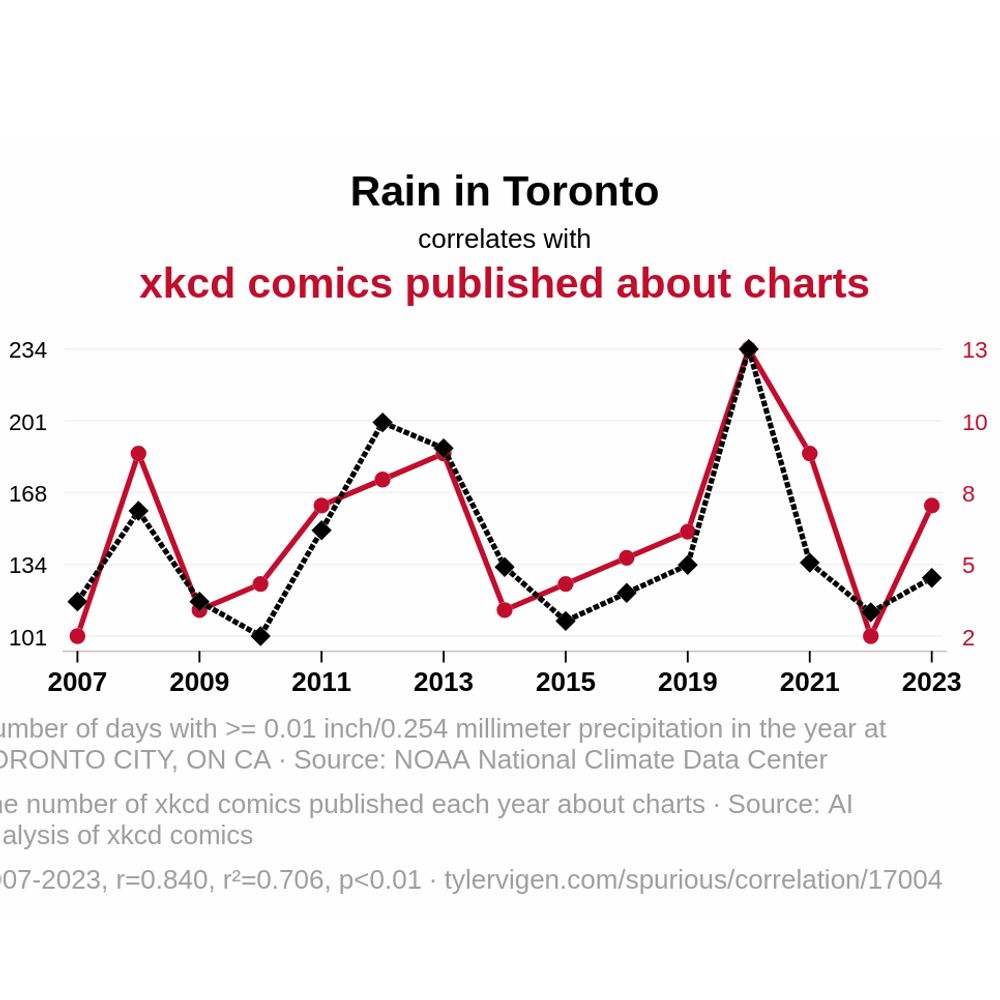
Correlation is not causation: your daily dose of spurious correlation.
Made with @trotsky.pirhoo.com using Tyler Vigen's charts.