Thanks. Took the most work to work out how to represent, trying to pack a lot in.
10.02.2025 20:30 — 👍 1 🔁 0 💬 0 📌 0The Overhang
@overhang-aonz.bsky.social
Structured vibes. Aotearoa-New Zealand political takes, with an analytical bent.
@overhang-aonz.bsky.social
Structured vibes. Aotearoa-New Zealand political takes, with an analytical bent.
Thanks. Took the most work to work out how to represent, trying to pack a lot in.
10.02.2025 20:30 — 👍 1 🔁 0 💬 0 📌 0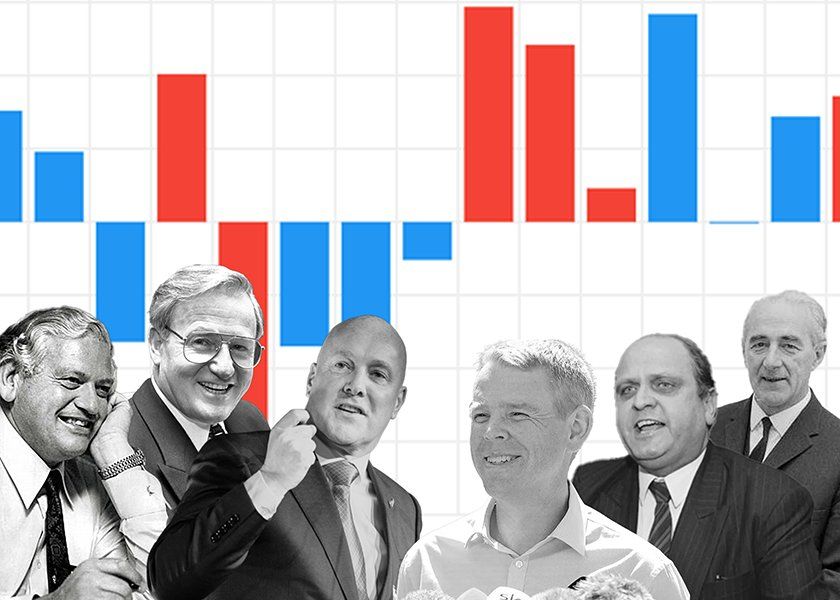
Phots of Norman Kirk, Jim Bolger, and Chris Luxon facing Chris Hipkins, Mike Moore, and Jack Marshall, superimposed on an illustrative bar graph of blue and red bars.
New piece via The Overhang newsletter: Halfway(ish).
This time we look at how the Sixth National Government is doing in the polls, and how that compares historically.
tl;dr: Eeehhhhhhh. Not great. Could be worse.
theoverhangaonz.substack.com/p/the-overha...
Very long way of saying "National might win the next election, but on the other hand they might not".
That uncertainty is the point.
Using 1990-93 as a comparison, things look OK for National: they won in 93, and Luxon has a *much* smaller mountain to climb.
On the other hand, the distortions of FPP aren't there to lend a hand in beating off a fissile left.
Like these two examples, the current government is dealing with economic headwinds. Fortunately, they're not as bad (yet) as the 70s or 90s.
The leadership changes that sealed the 3LG's fate seem unlikely to repeat, with both Luxon and Hipkins seeming secure (and uh, healthy).
Moore looked certain to get a second go. But then he didn't.
Instead, Bolger made the mother of all comebacks and by the barest of margins (zero seats, with a speakership deal serving as the boundary countback) clung on in 1993.
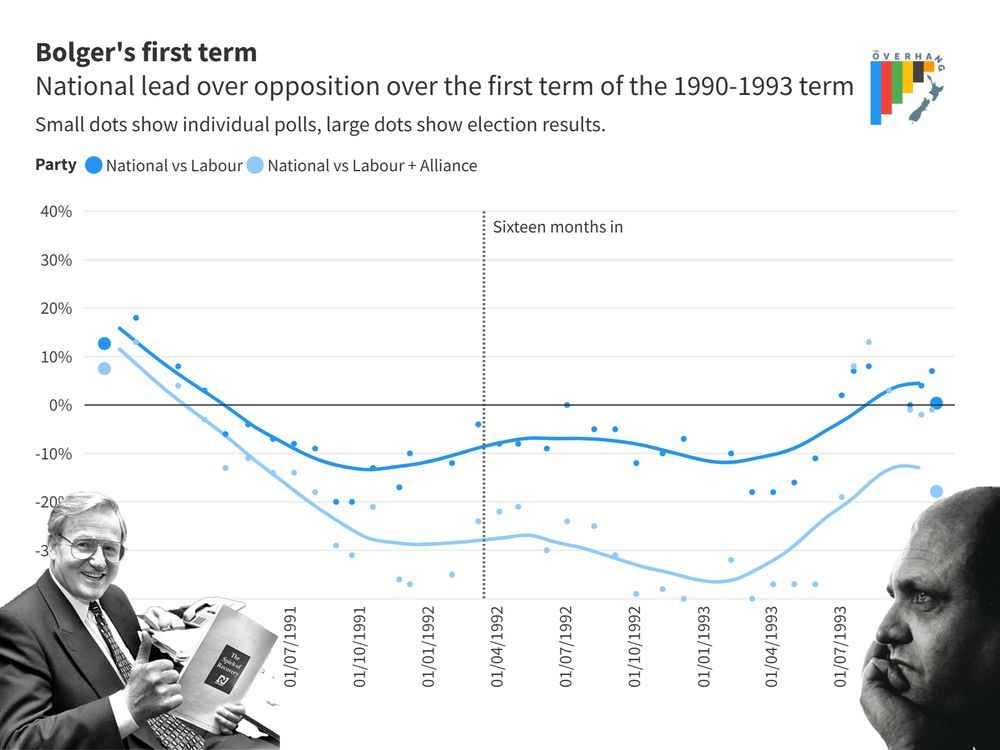
A line chart showing the performance of the fourth national government between 1990 and 1993. The government started 13 points ahead, declining rapidly to a low of -35 by early 1993. By the 1993 election they recover to be 1 point ahead. Images Jim Bolger looking positive holding a pamphlet labelled “The Spirit of Recovery” and Mike Moore looking pensive are superimposed.
Bolger started with an even more commanding 13% landslide over hospital-pass recipient Mike Moore.
The crash was harsher too.
By this point, amid economic strife and in the aftermath of the Mother of All Budgets, National had shed a 24 points to be -11 down on Moore's Labour.
Kirk's untimely death and Muldoon's near coincident take over of National would finish them off.
10.02.2025 10:35 — 👍 1 🔁 0 💬 1 📌 0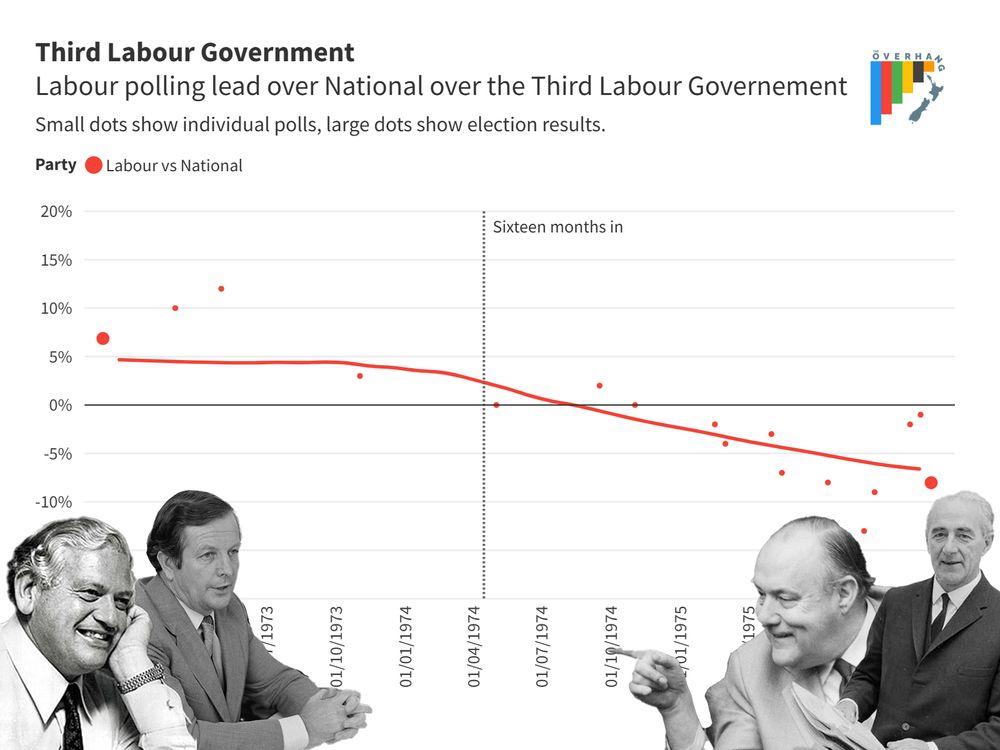
A line chart showing the performance of the third labour government between 1972 and 1975. The government started 5 points ahead, remaining stable until 1973 when it slowly began to decline. By the 1975 election they were 8 points behind. Images of Norman Kirk, Bill Rowling, Robert Muldoon, and Jack Marshall are superimposed.
Kirk started off well (finally defeating the fourth-term, Marshall-led, natural-party-of-government Second National Government) by 8%.
With repeated economic shocks, this had decayed to just 2% by the half way mark.
The two past governments who were below this average were Norman Kirk's third Labour government in the 1970s and Jim Bolger's Fourth National Government in the 1990s.
10.02.2025 10:35 — 👍 2 🔁 0 💬 1 📌 0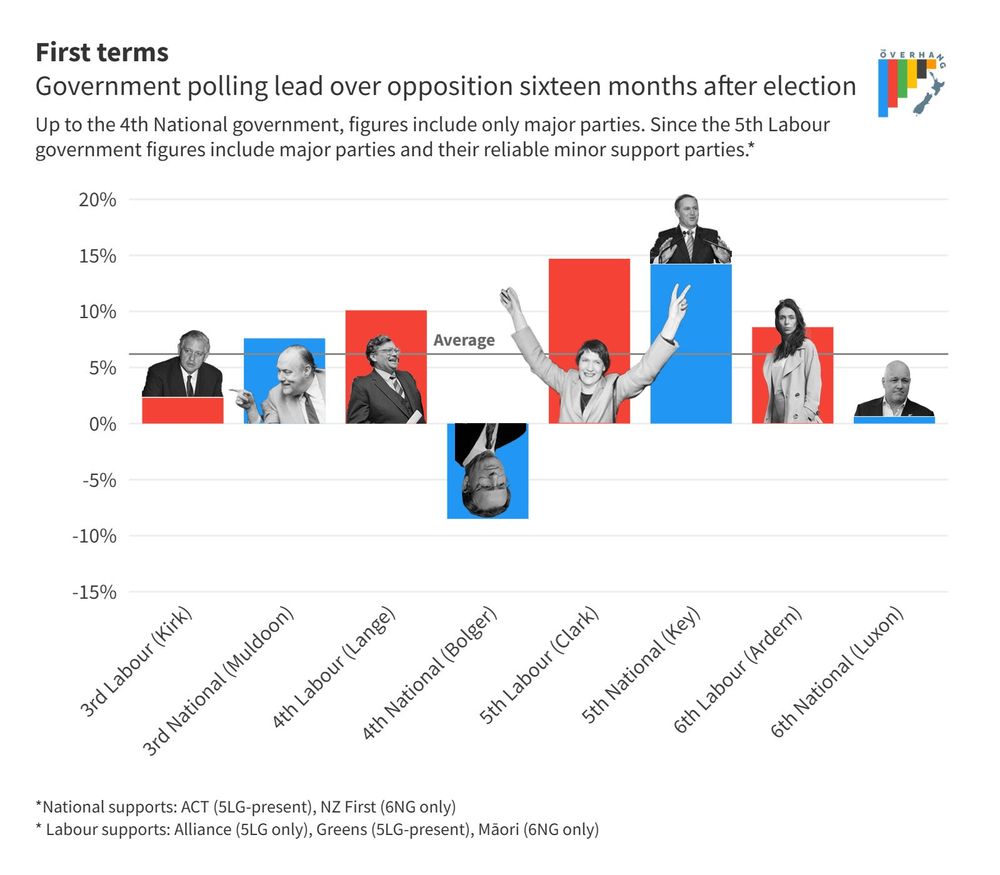
A bar chart showing just the first term governments lead at this point in the electoral cycle. Third Labour Government (Kirk) was 2.3 points ahead. The third National government (Muldoon) 7.6 ahead. The Fourth Labour Government (Lange) 10.1 ahead. The fourth national government (Bolger) -8.5 behind. The fifth labour government (Clark) 14.7 ahead. The fifth National government (key) was 14.2 ahead. The sixth Labour government (Ardern) 8.6 ahead. The sixth National government (luxon) is 0.6 ahead. Images of each Prime Minister with emotional reactions reflecting their position are superimposed.
Isolating just first terms and the picture is a little more concerning.
Most new administrations tend to have an extended honeymoon, with support averaging ~6% at this point.
At 0.6% (on a raw basis not adjusting for house effects) is the second worst on record.
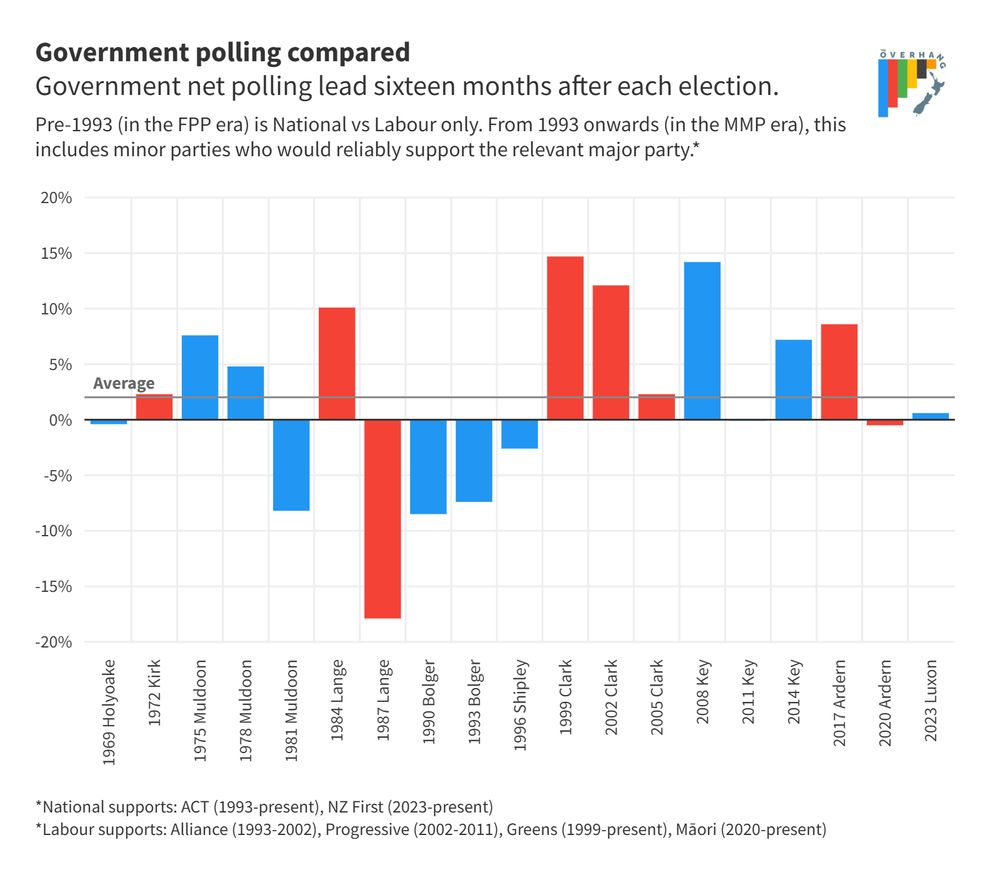
A bar chart showing each governments polling performance at this point in the electoral cycle. After the 1969 election Keith Holyoake was -0.4 points behind. 1972 Kirk was 2.3 points ahead. 1975 Muldoon 7.6 ahead. 1978 Muldoon 4.8 ahead. 1981 Muldoon -8.2 behind. 1984 Lange 10.1 ahead. 1987 Lange -17.9 behind. 1990 Bolger -8.5 behind. 1993 Bolger -7.4 behind. 1996 Shipley -2.6 behind. 1999 Clark 14.7 ahead. 2002 Clark 12.1 ahead. 2005 Clark 2.3 ahead. 2008 Key 14.2 ahead. 2011 Key 0.1 behind. 2014 Key 7.2 ahead. 2017 Ardern 8.6 ahead. 2020 Ardern -0.5 behind. 2023 Luxon 0.6 ahead.
Zooming in on just where we are now (16 months in) we can get a reasonable comparison.
Next to an all-terms average of 2%, the current government's narrow lead doesn't look especially bad.
But support for the government tends to decay over its lifespan.
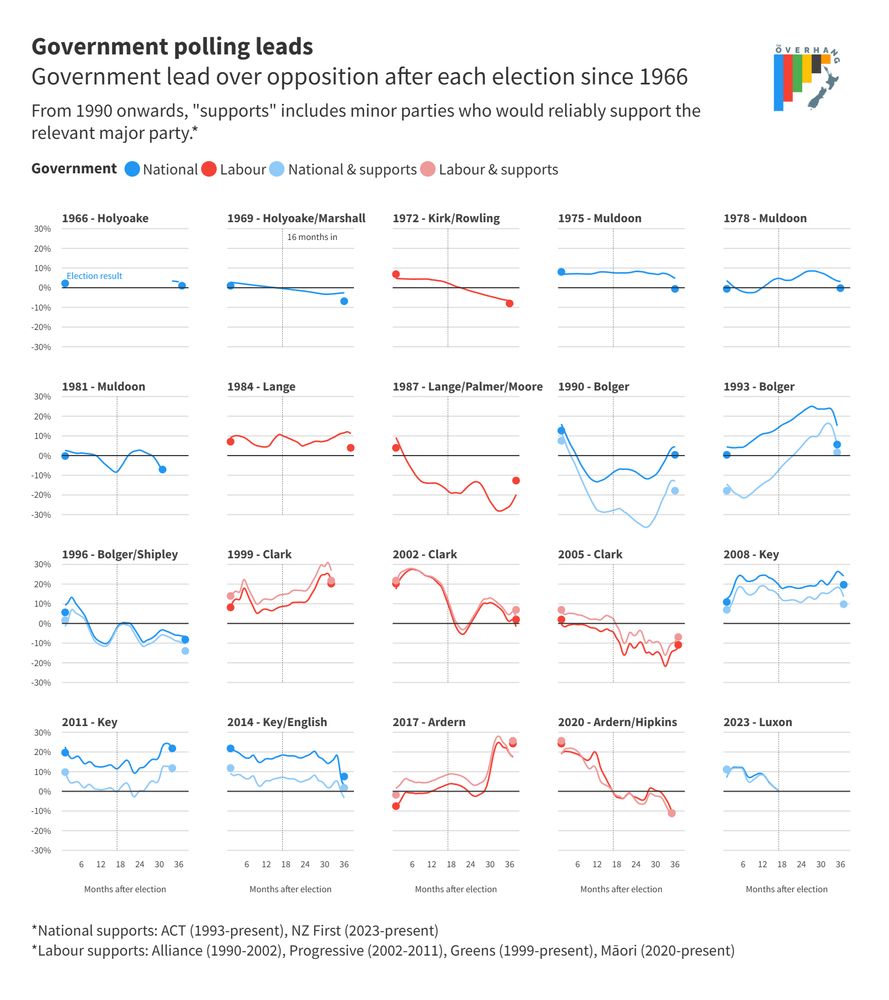
A grid of line charts showing the polling performance of each governmental term since 1966.
This is on the face of it... not great.
But how does it compare historically, and how did past governments in a similar position fare? We have public polling data going back to the end of the Holyoake years.
The polling path of each govt since then, along with their electoral fortunes are below.
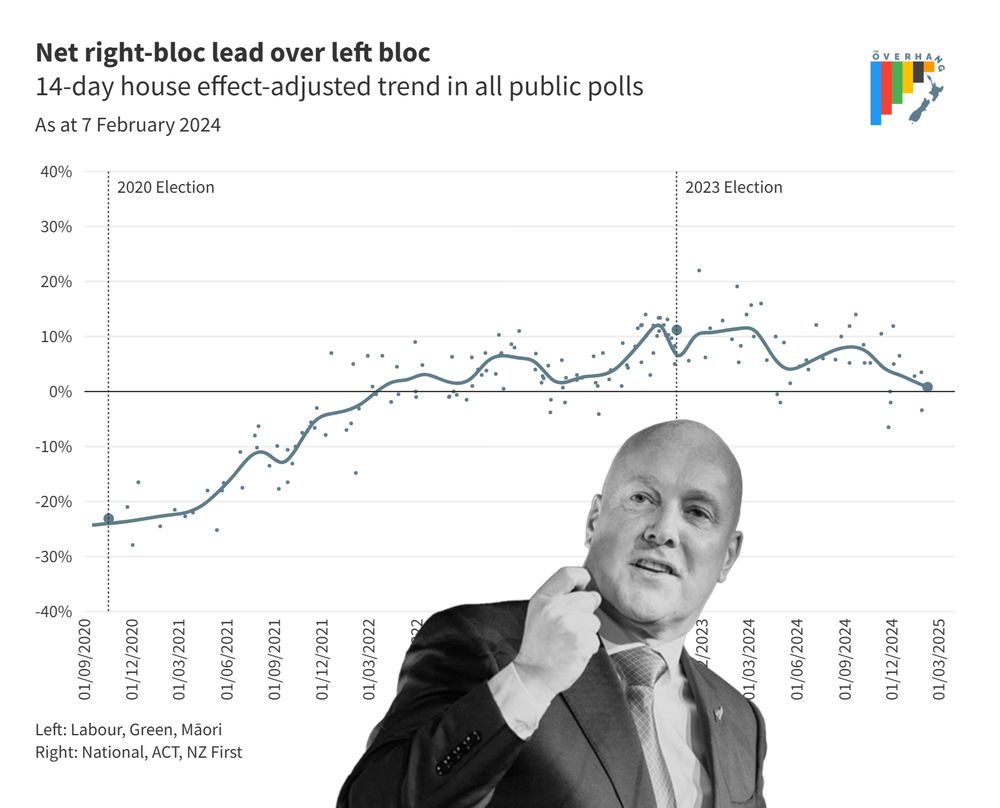
A line chart showing the right wing blocks lead over the left between the 2020 election and today. The right gradually rises from 25 point behind in 2020 to 11 points ahead at the 2023 election. Since 2023 they have dropped to 0.8 points ahead. An image of Prime Minister Christopher Luxon looking defiant is superimposed.
In terms of how we got here, Luxon et al started with a respectable 11% margin (above the historic norm of 8% for new govts) and held that lead for about a year.
Then over the course of 2024 that began to slip and now hovers just above a dead heat.
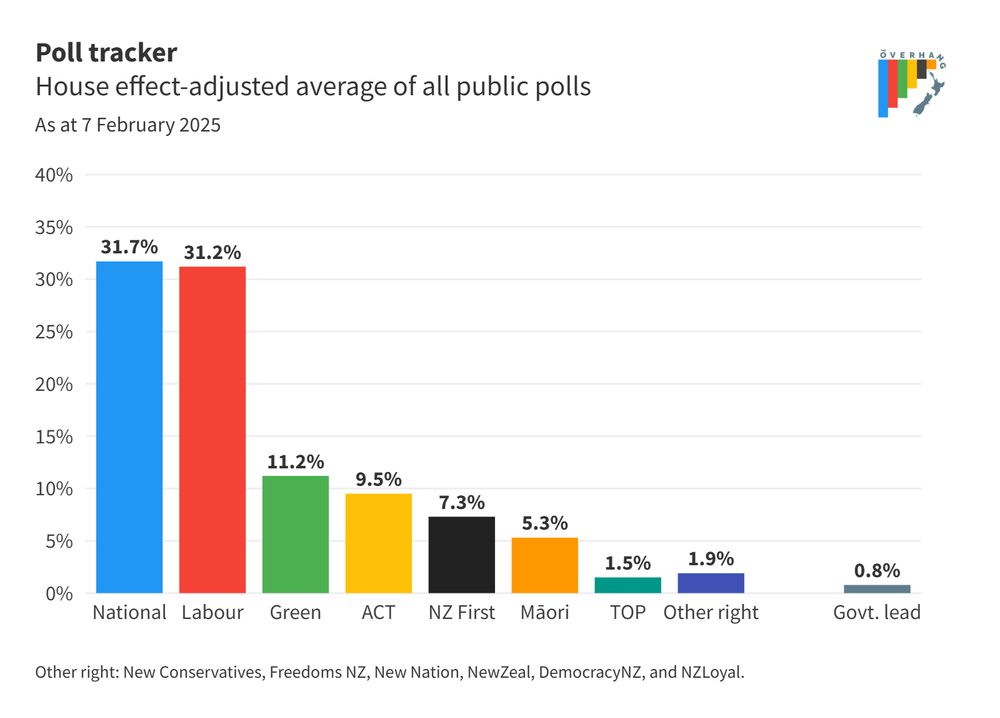
A bar chart of current party polling. National on 31.7, Labour on 31.2, the Greens on 11.2, ACT on 9.5, New Zealand First on 7.3, te Pāti Māori on 5.3, TOP on 1.5, and the other right wing parties outside parliament on 1.9 combined. The government leads the opposition by 0.8 percent.
Brief summary of the current situation and how we got here.
National (31.7) are just ahead of Labour (31.2). With support parties factored in the government is 0.8% ahead of the opposition.
(Note: this was written prior to today's Curia and Verian polls, but the overall picture remains the same).

Phots of Norman Kirk, Jim Bolger, and Chris Luxon facing Chris Hipkins, Mike Moore, and Jack Marshall, superimposed on an illustrative bar graph of blue and red bars.
New piece via The Overhang newsletter: Halfway(ish).
This time we look at how the Sixth National Government is doing in the polls, and how that compares historically.
tl;dr: Eeehhhhhhh. Not great. Could be worse.
theoverhangaonz.substack.com/p/the-overha...
Holding off on predictions or ranges for a while as we're so far out from the election.
Also paused on seat picks while we wait on the boundary review (more on that soon).
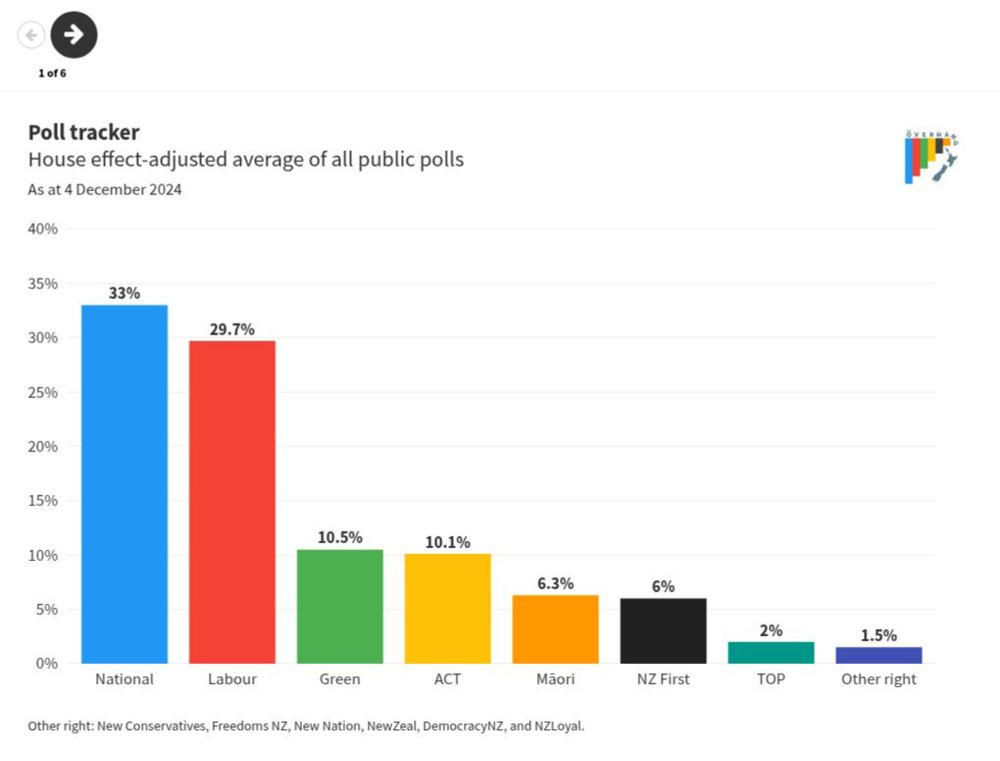
Mildly interactive version available here:
public.flourish.studio/story/2764151/
Seats in the house:
🟨🟨🟦🟦🟦🟦🟦🟦🟦🟦🟦🟦🟦
🟨🟨🟨🟦🟦🟦🟦🟦🟦🟦🟦🟦🟦
🟨🟨🟨🟦🟦🟦🟦🟦🟦🟦🟦🟦🟦
🟨🟨🟨🟦🟦🟦🟦🟦🟦🟦🟦🟦🟦
⬛⬛🟨🟨
⬛⬛⬛⬛
⬛⬛🟧🟧
🟧🟧🟧🟧
🟧🟧🟩🟩🟥🟥🟥🟥🟥🟥🟥🟥🟥
🟩🟩🟩🟩🟥🟥🟥🟥🟥🟥🟥🟥🟥
🟩🟩🟩🟩🟥🟥🟥🟥🟥🟥🟥🟥🟥
🟩🟩🟩🟥🟥🟥🟥🟥🟥🟥🟥🟥🟥
🟦Nat 41 (-4 vs 2023)
🟥Lab 37 (+3)
🟩Gre 13 (-2)
🟨ACT 13 (+2)
⬛NZF 8 (n/c)
🟧TPM 8 (+2)
Right: 62
Left: 58
(Net loss of 2 overhang seats)
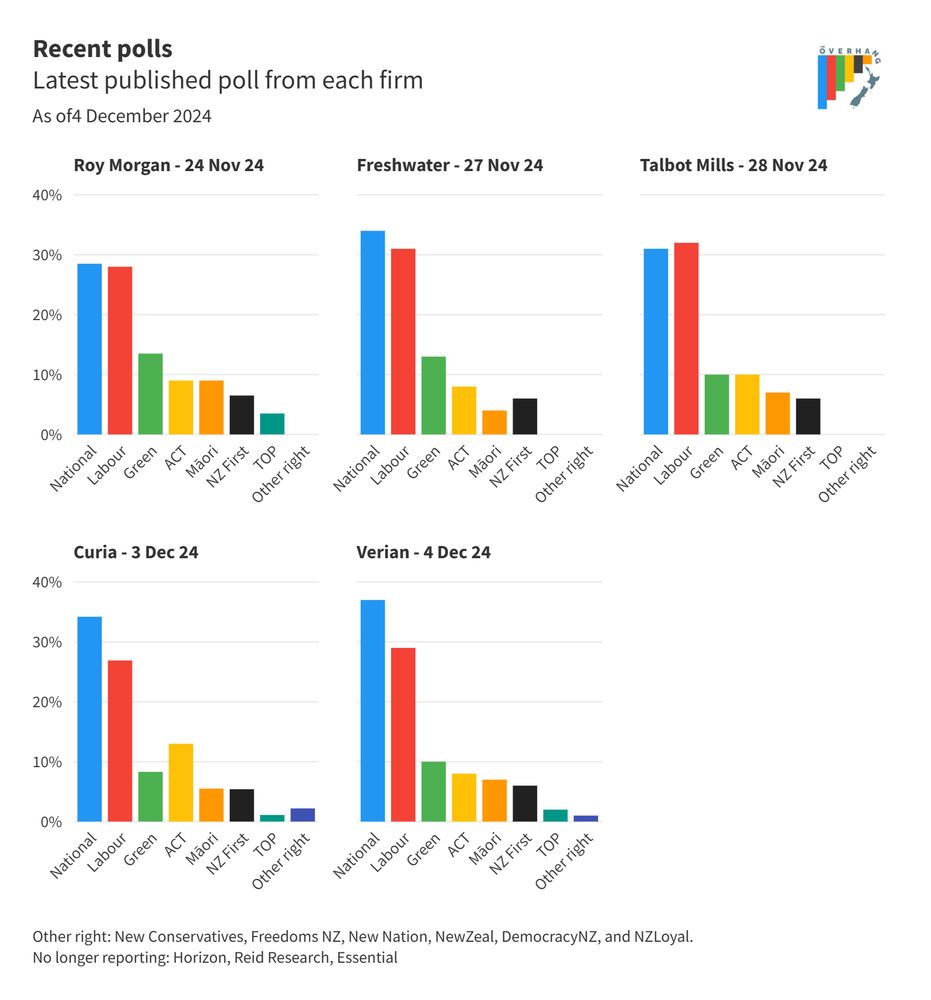
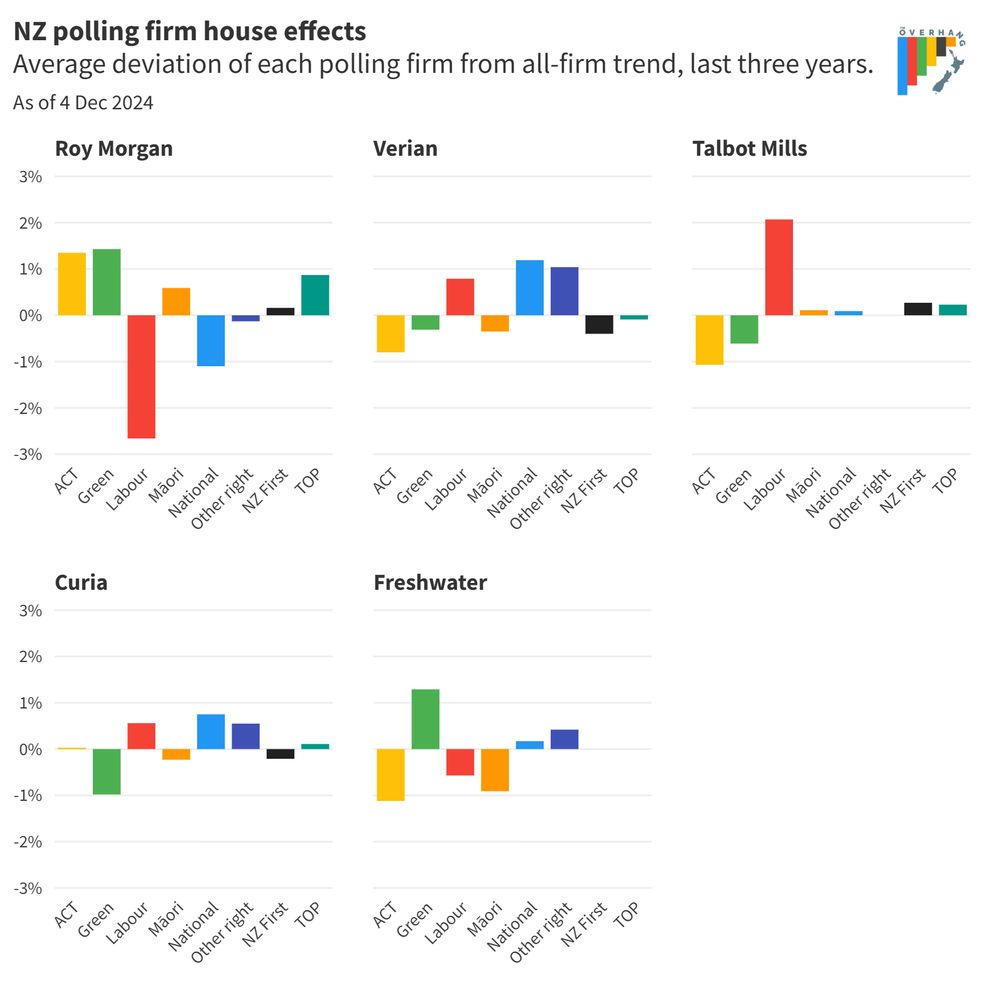
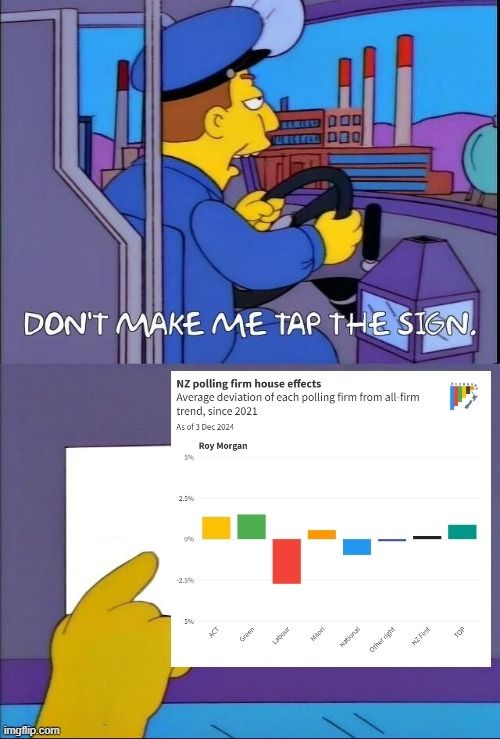
Latest polls from each firm largely confirming to type: - Roy flattering the minors (giving TPM a record 9%).
- Talbot Mills looking better for Labour
- Hard to say if that Freshwater Green-lean is real, given we only have two polls.
Also Fs in the chat for Reid Research 😔
September saw a brief "Inwards" phase benefiting the majors with Green loses continuing.
October flipped to "Labourwards" as Labours gains continued but National gave back theirs.
Finally the last two months have seen an "Outwards (to the left)" phase benefit TPM and ACT.
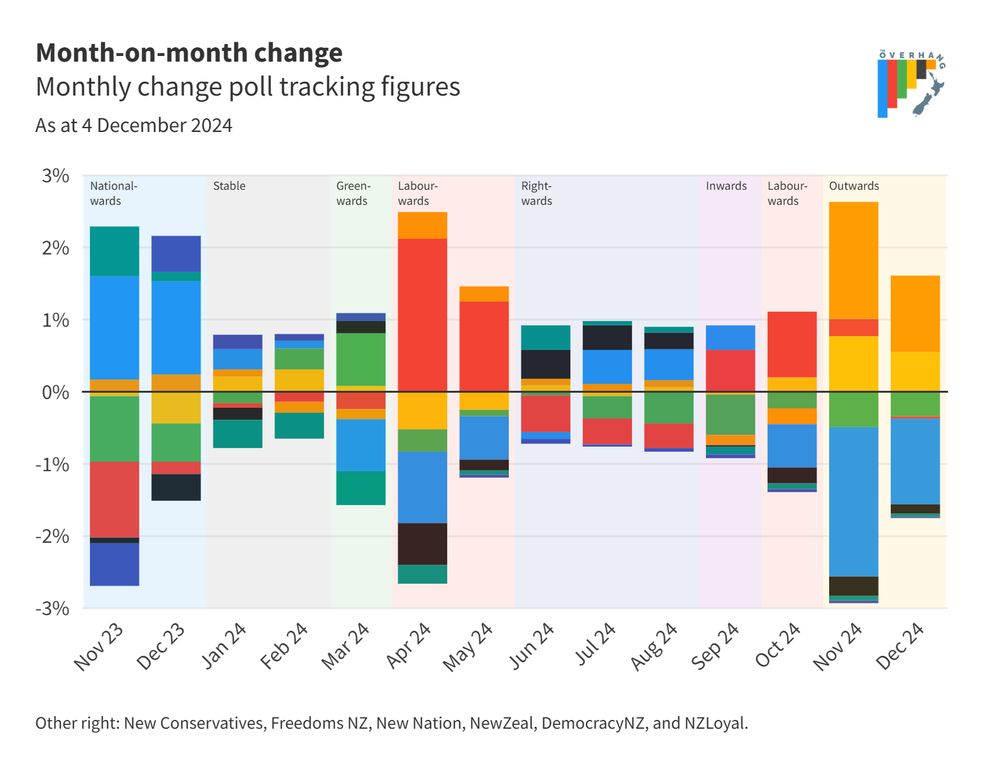
Fish view of the same data since the election to get us caught up:
Post-election saw a "Nationalwards" phase.
Summer was "Stable" with sparse polling.
February into March saw a modest "Greenwards" recovery.
April-May was "Labourwards".
Winter was a slow "Rightwards" drift.
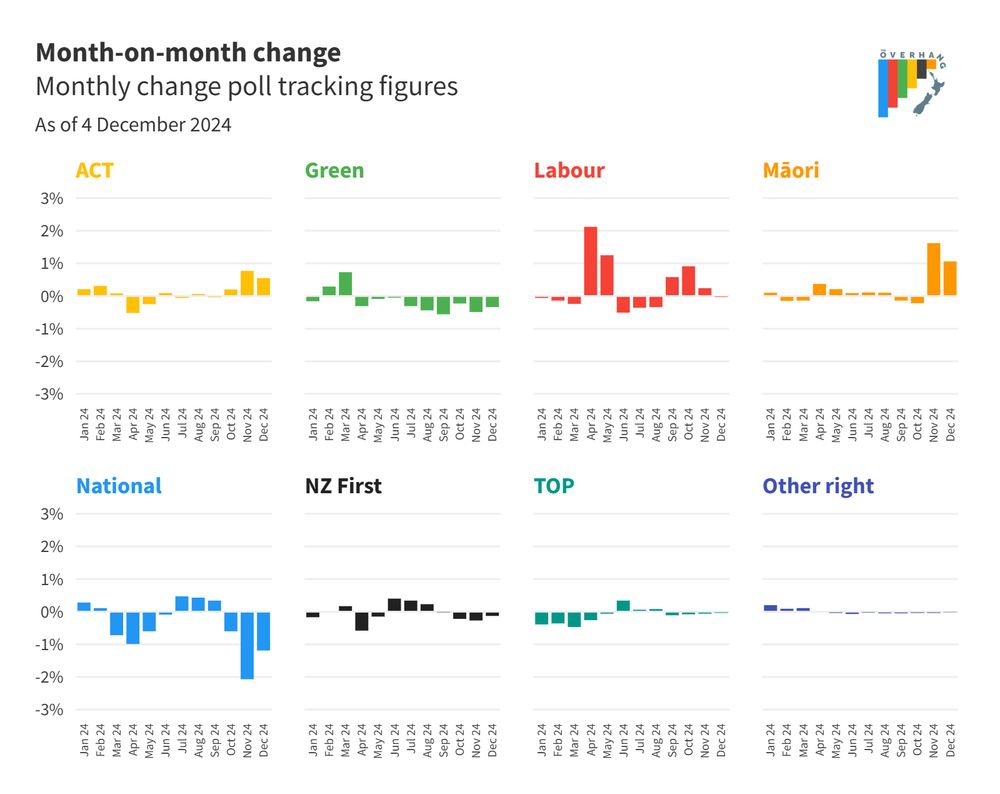
Changes over the past year (it's been a while) slightly clearer in this view.
Current phase is 🟢>🟠<🔴=🔵>🟡=⚫ "outwards".
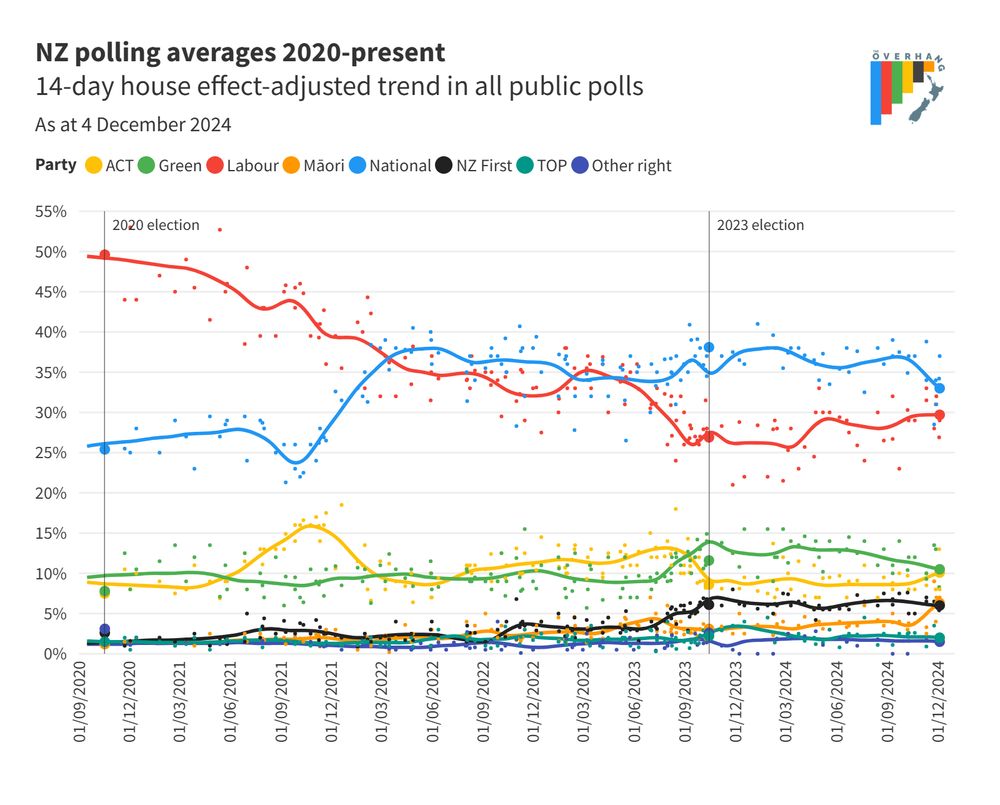
Trends in support overtime.
National compound recent losses (-1.2 vs November). ACT continue modest gains (+0.6). NZ First largely flat (-0.1).
Labour also flat (n/c). Greens' slide continues (-0.3%). TPM the most significant winner (+1.1).
Parties outside parliament stable.
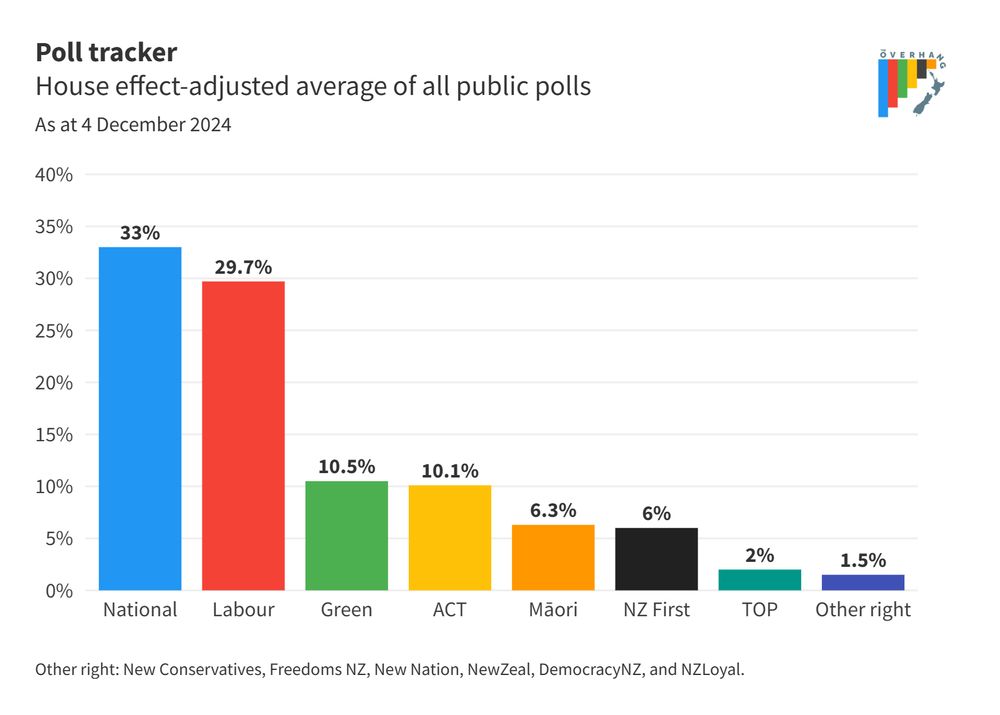
NZ polling update: December 2024
We're back!
National (33%) hold a reasonable lead over Labour (30%).
Figures for ACT (10%), NZ First (6%), the Greens (11%) and TPM (6%) give the right a 3% lead over the left.
TOP are on 2.4%. Other right-wing parties on 1.5% combined.
 03.12.2024 05:19 — 👍 3 🔁 1 💬 0 📌 0
Kia ora. Setting up the Aotearoa politics data store here too.
Content to follow in due course.