This image shows gauges with the Jan 17 - Jan 30, 2026 COVID Forecast scores for Canada, the provinces, and territories. From left to right:
Canada: VERY HIGH - 12.1
Alberta: VERY HIGH - 12.3
British Columbia: HIGH - 8.1
Manitoba: SEVERE - 19.2
New Brunswick: VERY HIGH - 11.2
Newfoundland & Labrador: VERY HIGH - 11.3
North: VERY HIGH - 12.9
Nova Scotia: SEVERE - 17.6
Ontario: VERY HIGH - 10.9
Prince Edward Island: HIGH - 9.8
Quebec: VERY HIGH - 12.3
Saskatchewan: SEVERE - 17.9
A text box reads: 'The COVID Forecast is calculated from 3 equally weighted categories: 1) Current infections and spread; 2) Healthcare system impact; 3) Mortality. Within each category there is one sub-category for trends over the most recent week (Trends) and one sub-category for current parameter values relative to a specified baseline (Current values). Trends and current values are weighted equally when determining the final score for a category. All Forecast input data and sources are available here (https://datastudio.google.com/embed/u/0/reporting/42b886cf-d661-488e-b7d8-5c5836b55ab6/page/p_2yqs028mwc). Past Forecast scores are available in the table below. Forecast scores are grouped into 4 ranges: MODERATE (1 to <5, white), HIGH (6 to <10, yellow), VERY HIGH (10 to <15, orange), SEVERE (>15 red).'
Canadian COVID Forecast: Jan 17 - Jan 30, 2026
SEVERE: MB, NS, SK
VERY HIGH: CAN, AB, NB, NL, North, ON, QC
HIGH: BC, PEI
MODERATE: none
About 1 in 95 people in Canada are CURRENTLY infected.
22.01.2026 00:50 — 👍 215 🔁 130 💬 10 📌 8

This image shows gauges with the Dec 20, 2025 - Jan 2, 2026 Forecast scores for Canada, the provinces, & territories. From left to right:
Canada: HIGH - 10.0
Alberta: VERY HIGH - 12.4
British Columbia: HIGH - 7.6
Manitoba: VERY HIGH - 10.3
New Brunswick: VERY HIGH - 10.5
Newfoundland & Labrador: HIGH - 9.1
North: VERY HIGH - 10.3
Nova Scotia: HIGH - 9.9
Ontario: HIGH - 9.2
Prince Edward Island: HIGH - 6.6
Quebec: VERY HIGH - 10.4
Saskatchewan: VERY HIGH - 14.0
A text box reads: "The COVID Forecast is calculated from 3 equally weighted categories: 1) Current infections and spread; 2) Healthcare system impact; 3) Mortality. Within each category there is one sub-category for trends over the most recent week (Trends) and one sub-category for current parameter values relative to a specified baseline (Current values). Trends and current values are weighted equally when determining the final score for a category. All Forecast input data and sources are available here (https://datastudio.google.com/embed/u/0/reporting/42b886cf-d661-488e-b7d8-5c5836b55ab6/page/p_2yqs028mwc). Past Forecast scores are available in the table below. Forecast scores are grouped into 4 ranges: MODERATE (1 to <5, white), HIGH (6 to <10, yellow), VERY HIGH (10 to <15, orange), SEVERE (>15 red)."
Canadian COVID Forecast: Dec 20, 2025 - Jan 2, 2026
SEVERE: none
VERY HIGH: AB, MB, NB, North, QC, SK
HIGH: CAN, BC, NL, NS, ON, PEI
MODERATE: none
About 1 in 55 people in Canada are CURRENTLY infected.
22.12.2025 22:18 — 👍 234 🔁 138 💬 14 📌 13

This image shows gauges with the Nov 22 - Dec 5, 2025 Forecast scores for Canada, the provinces, & territories. From left to right:
Canada: HIGH - 9.4
Alberta: SEVERE - 15.1
British Columbia: HIGH - 7.2
Manitoba: VERY HIGH - 13.9
New Brunswick: VERY HIGH - 14.0
Newfoundland & Labrador: HIGH - 7.9
North: VERY HIGH - 11.1
Nova Scotia: VERY HIGH - 14.3
Ontario: HIGH - 8.2
Prince Edward Island: HIGH - 8.8
Quebec: HIGH - 8.7
Saskatchewan: VERY HIGH - 14.5
A text box reads: "The COVID Forecast is calculated from 3 equally weighted categories: 1) Current infections and spread; 2) Healthcare system impact; 3) Mortality. Within each category there is one sub-category for trends over the most recent week (Trends) and one sub-category for current parameter values relative to a specified baseline (Current values). Trends and current values are weighted equally when determining the final score for a category. All Forecast input data and sources are available here (https://datastudio.google.com/embed/u/0/reporting/42b886cf-d661-488e-b7d8-5c5836b55ab6/page/p_2yqs028mwc). Past Forecast scores are available in the table below. Forecast scores are grouped into 4 ranges: MODERATE (1 to <5, white), HIGH (6 to <10, yellow), VERY HIGH (10 to <15, orange), SEVERE (>15 red)."
Canadian COVID Forecast: Nov 22 - Dec 5, 2025
SEVERE: AB
VERY HIGH: MB, NB, North, NS, SK
HIGH: CAN, BC, NL, ON, PEI, QC
MODERATE: none
About 1 in 161 people in Canada are CURRENTLY infected.
25.11.2025 02:02 — 👍 281 🔁 189 💬 15 📌 27
![This image describes the Canadian COVID Forecast for the fourteen-day period between Nov 8 - Nov 21, 2025, which is produced by COVID-19 Resources Canada. Canada’s COVID Forecast outlook is VERY HIGH [no change] with a COVID INDEX SCORE of 10.1
About 1 of every 118 people is infected.
Estimated infections this week: 583,200-806,200
What these numbers mean: MODERATE 1-5, HIGH 5-10, VERY HIGH 10-15, SEVERE >15 COMPARED TO THE LOWEST POINT IN THE COVID PANDEMIC IN CANADA
How much higher are key indicators compared to the lowest point in the COVID pandemic in Canada?
Waste water, infections: HIGH; 7.6X higher
Long COVID: HIGH; 6.0X higher
Hospitalizations: VERY HIGH; 10.4X higher
Deaths: VERY HIGH; 12.2X higher
HOW TO HELP:
EVERYONE:
UPDATE vaccines every 6 months
WEAR N95-type masks
AVOID indoor social gatherings
AVOID crowded non-essential places
Who is HIGH RISK?
People 60 and older, babies < 1 year, pregnant
ALL AGES: immunocompromised OR medically at-risk OR no vaccine or infection in the last 6 months
Recommendations are based on the COVID-19 Risk Index from the Peterborough ON Public Health Unit
COVID-19 Resources Canada is a grassroots organization of volunteer scientists supporting Canadian COVID responses. Sources, data and methods for the COVID Index are available at www.Covid19Resources.ca](https://cdn.bsky.app/img/feed_thumbnail/plain/did:plc:qbuobwdie7rzq4fburk63aft/bafkreigcayvfpw3riiwc5ff4taetmai2egkpb4dyvp7ghhtvqirbpzm2vu@jpeg)
This image describes the Canadian COVID Forecast for the fourteen-day period between Nov 8 - Nov 21, 2025, which is produced by COVID-19 Resources Canada. Canada’s COVID Forecast outlook is VERY HIGH [no change] with a COVID INDEX SCORE of 10.1
About 1 of every 118 people is infected.
Estimated infections this week: 583,200-806,200
What these numbers mean: MODERATE 1-5, HIGH 5-10, VERY HIGH 10-15, SEVERE >15 COMPARED TO THE LOWEST POINT IN THE COVID PANDEMIC IN CANADA
How much higher are key indicators compared to the lowest point in the COVID pandemic in Canada?
Waste water, infections: HIGH; 7.6X higher
Long COVID: HIGH; 6.0X higher
Hospitalizations: VERY HIGH; 10.4X higher
Deaths: VERY HIGH; 12.2X higher
HOW TO HELP:
EVERYONE:
UPDATE vaccines every 6 months
WEAR N95-type masks
AVOID indoor social gatherings
AVOID crowded non-essential places
Who is HIGH RISK?
People 60 and older, babies < 1 year, pregnant
ALL AGES: immunocompromised OR medically at-risk OR no vaccine or infection in the last 6 months
Recommendations are based on the COVID-19 Risk Index from the Peterborough ON Public Health Unit
COVID-19 Resources Canada is a grassroots organization of volunteer scientists supporting Canadian COVID responses. Sources, data and methods for the COVID Index are available at www.Covid19Resources.ca
Canadian COVID Forecast Nov 8 - Nov 21, 2025
CANADA
VERY HIGH [no change]
About 1 of every 118 people is infected.
Compared to lowest point of pandemic in Canada:
-Infections: 7.6 x higher
-Long COVID: 6.0 x higher
-Hospitalizations: 10.4 x higher
-Deaths: 12.2 x higher
10.11.2025 22:58 — 👍 124 🔁 71 💬 6 📌 3

Prévisions de COVID pour le Canada : NOV 8 - NOV 21, 2025
CANADA
TRÈS ÉLEVÉ [stable]
Environ 1 personne sur 118 est infectée
Par rapport au point le plus bas de la pandémie au Canada :
-Infections : 7.6 x🔺
-COVID longue : 6.0 x🔺
-Hospitalisations : 10.4 x🔺
-Décès : 12.2 x🔺
10.11.2025 23:01 — 👍 33 🔁 13 💬 1 📌 3

This image shows gauges with the Oct 11 - Oct 24, 2025 Forecast scores for Canada, the provinces, & territories. From left to right:
Canada: HIGH - 8.9
Alberta: HIGH - 7.0
British Columbia: HIGH - 8.4
Manitoba: VERY HIGH - 14.9
New Brunswick: VERY HIGH - 11.3
Newfoundland & Labrador: SEVERE - 17.0
North: VERY HIGH - 12.3
Nova Scotia: SEVERE - 16.3
Ontario: HIGH - 7.5
Prince Edward Island: VERY HIGH - 11.8
Quebec: HIGH - 10.0
Saskatchewan: SEVERE - 17.0
A text box reads: "The COVID Forecast is calculated from 3 equally weighted categories: 1) Current infections and spread; 2) Healthcare system impact; 3) Mortality. Within each category there is one sub-category for trends over the most recent week (Trends) and one sub-category for current parameter values relative to a specified baseline (Current values). Trends and current values are weighted equally when determining the final score for a category. All Forecast input data and sources are available here (https://datastudio.google.com/embed/u/0/reporting/42b886cf-d661-488e-b7d8-5c5836b55ab6/page/p_2yqs028mwc). Past Forecast scores are available in the table below. Forecast scores are grouped into 4 ranges: MODERATE (1 to <5, white), HIGH (6 to <10, yellow), VERY HIGH (10 to <15, orange), SEVERE (>15 red)."
Canadian COVID Forecast: Oct 11 - Oct 24, 2025
SEVERE: NL, NS, SK
VERY HIGH: MB, NB, North, PEI
HIGH: CAN, AB, BC, ON, QC
MODERATE: none
About 1 in 95 people in Canada are CURRENTLY infected.
15.10.2025 00:41 — 👍 384 🔁 201 💬 24 📌 28
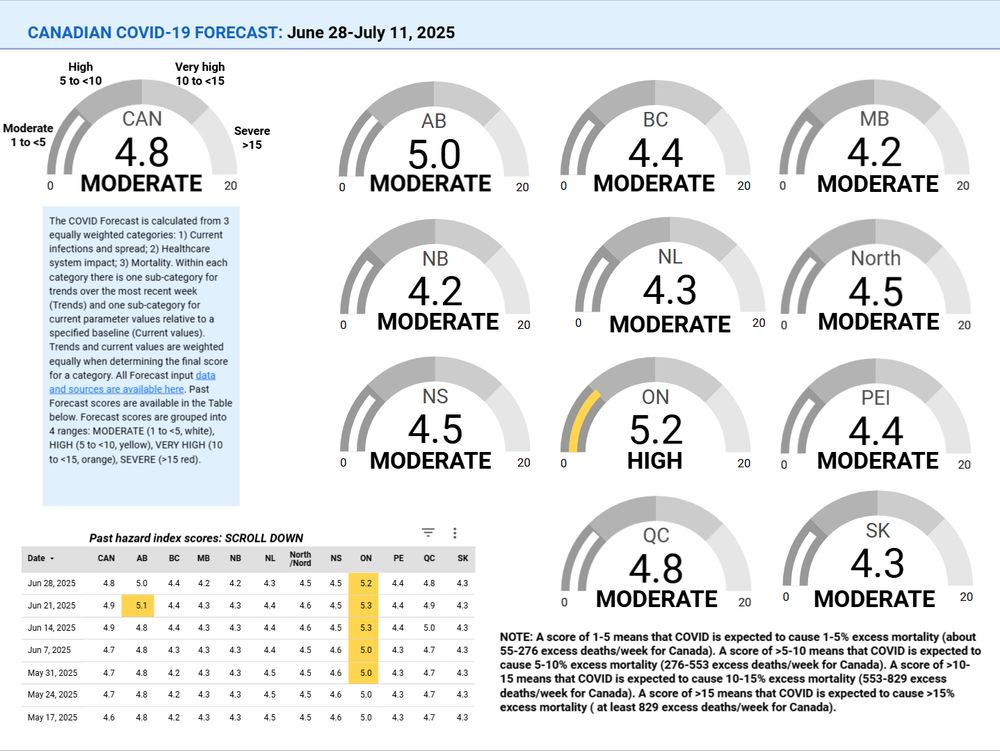
This image shows gauges with the Jun 28-Jul 11, 2025 COVID Forecast scores for Canada, the provinces, & territories. From left to right:
Canada: 4.8 - MODERATE
Alberta: 5.0 - MODERATE
British Columbia: 4.4 - MODERATE
Manitoba: 4.2 - MODERATE
New Brunswick: 4.2 - MODERATE
Newfoundland and Labrador: 4.3 - MODERATE
North: 4.5 - MODERATE
Nova Scotia: 4.5 - MODERATE
Ontario: 5.2 - HIGH
Prince Edward Island: 4.4 - MODERATE
Quebec: 4.8 - MODERATE
Saskatchewan: 4.3 - MODERATE
A text box reads: "The COVID Forecast is calculated from 3 equally weighted categories: 1) Current infections and spread; 2) Healthcare system impact; 3) Mortality. Within each category there is one sub-category for trends over the most recent week (Trends) and one sub-category for current parameter values relative to a specified baseline (Current values). Trends and current values are weighted equally when determining the final score for a category. All Forecast input data and sources are available here (https://datastudio.google.com/embed/u/0/reporting/42b886cf-d661-488e-b7d8-5c5836b55ab6/page/p_2yqs028mwc). Past Forecast scores are available in the table below. Forecast scores are grouped into 4 ranges: MODERATE (1 to <5, white), HIGH (6 to <10, yellow), VERY HIGH (10 to <15, orange), SEVERE (>15 red)."
Canadian COVID Forecast: Jun 28-Jul 11, 2025
SEVERE: none
VERY HIGH: none
HIGH: ON
MODERATE: CAN, AB, BC, MB, NB, NL, North, NS, PEI, QC, SK
About 1 in 120 people in Canada are CURRENTLY infected.
03.07.2025 19:58 — 👍 355 🔁 166 💬 19 📌 14

This image shows gauges with the Apr 12-25, 2025 COVID Forecast scores for Canada, the provinces, & territories. From left to right:
Canada: 11.0 - VERY HIGH
Alberta: 11.3 - VERY HIGH
British Columbia: 10.2 - VERY HIGH
Manitoba: 10.4 - VERY HIGH
New Brunswick: 8.7 - HIGH
Newfoundland and Labrador: 8.5 - HIGH
North: 10.7 - VERY HIGH
Nova Scotia: 8.9 - HIGH
Ontario: 12.8 - VERY HIGH
Prince Edward Island: 9.1 - HIGH
Quebec: 10.9 - VERY HIGH
Saskatchewan: 9.9 - HIGH
A text box reads: "The COVID Forecast is calculated from 3 equally weighted categories: 1) Current infections and spread; 2) Healthcare system impact; 3) Mortality. Within each category there is one sub-category for trends over the most recent week (Trends) and one sub-category for current parameter values relative to a specified baseline (Current values). Trends and current values are weighted equally when determining the final score for a category. All Forecast input data and sources are available here (https://datastudio.google.com/embed/u/0/reporting/42b886cf-d661-488e-b7d8-5c5836b55ab6/page/p_2yqs028mwc). Past Forecast scores are available in the table below. Forecast scores are grouped into 4 ranges: MODERATE (1 to <5, white), HIGH (6 to <10, yellow), VERY HIGH (10 to <15, orange), SEVERE (>15 red)."
Canadian COVID Forecast: Apr 12-25, 2025
SEVERE: none
VERY HIGH: AB, BC, CAN, MB, North, ON, QC
HIGH: NB, NL, NS, PEI, SK
MODERATE: none
About 1 in 151 people in Canada are CURRENTLY infected.
14.04.2025 19:15 — 👍 278 🔁 143 💬 9 📌 16

This image shows gauges with the Feb 1-14, 2025 COVID Forecast scores for Canada, the provinces, & territories. From left to right:VQ5RF
Canada: 12.7 - VERY HIGH
Alberta: 10.3 - VERY HIGH
British Columbia: 8.5 - HIGH
Manitoba: 10.0 - VERY HIGH
New Brunswick: 8.4 - HIGH
Newfoundland and Labrador: 8.3 - HIGH
North: 10.9 - VERY HIGH
Nova Scotia: 9.1 - HIGH
Ontario: 16.4 - SEVERE
Prince Edward Island: 9.3 - HIGH
Quebec: 12.7 - VERY HIGH
Saskatchewan: 9.9 - HIGH
A text box reads: "The COVID Forecast is calculated from 3 equally weighted categories: 1) Current infections and spread; 2) Healthcare system impact; 3) Mortality. Within each category there is one sub-category for trends over the most recent week (Trends) and one sub-category for current parameter values relative to a specified baseline (Current values). Trends and current values are weighted equally when determining the final score for a category. All Forecast input data and sources are available here (https://datastudio.google.com/embed/u/0/reporting/42b886cf-d661-488e-b7d8-5c5836b55ab6/page/p_2yqs028mwc). Past Forecast scores are available in the table below. Forecast scores are grouped into 4 ranges: MODERATE (1 to <5, white), HIGH (6 to <10, yellow), VERY HIGH (10 to <15, orange), SEVERE (>15 red)."
Canadian COVID Forecast: Feb 1-14, 2025
SEVERE: ON
VERY HIGH: CAN, AB, MB, North, QC
HIGH: BC, NB, NL, NS, PEI, SK
MODERATE: none
About 1 in 42 people in Canada are CURRENTLY infected.
03.02.2025 20:18 — 👍 494 🔁 294 💬 25 📌 24

Picture of man with grey hair, blue shirt and white respirator mask with a woman with black curly hair, a black respirator mask, an olive trench coat, making a peace sign
Rocking boats and learning about boats needing to be rocked with @jvipondmd.bsky.social at Wordfest. Was grateful to experience the conversation between Catherine Hernandez, Danny Ramadan and Michael Lista (Joe clearly feeling energized 😅) wordfest.com/2024/imaginair…
19.10.2024 20:48 — 👍 125 🔁 10 💬 4 📌 1
Weird.
19.10.2024 05:39 — 👍 13 🔁 2 💬 3 📌 0
Not yet! More of an planned escape route from twitter for now.
17.10.2024 04:27 — 👍 2 🔁 0 💬 0 📌 0
Account no longer in use, but not sure about deleting so parked for now - might use for advocacy later.
Associate Professor, University of Toronto. Bloodborne infections, Lyme disease, misinfo. COVID-19 Resources Canada. Defend journalism. Look for the helpers. Opinions mine. 🇨🇦🏳️🌈
https://covid19resources.ca
Collection of news, resources, and discourse related to the ongoing COVID-19 pandemic & health advocacy. Occasional venting, hot-takes and memes.
Los Angeles, CA.
I have a defective personality module.
“Humankind has not woven the web of life. We are but one thread within it. Whatever we do the web, we do to ourselves.”
― Chief Seattle, Squamish-Duamish
(1782 – June 7, 1866)
https://x.com/DavidUllrich202 🏳️🌈
Twitter: @hackingbutlegal
Mastodon: @hackingbutlegal@toad.social
Former EMD / EMS / AHS Lackie .. Dad to a special needs girl! Comments are my own!! DM's open for Tips regarding AHS Closures, Outbreaks, EMS or other healthcare items. Unofficial CMOH of Alberta!
#HarrisWalz2024! 🪷 NO LISTS. Board Game lover. 🏳️🌈 Ally. @sassiestminx on the Bad Place. Paralegal. 🚫Maga. Dog Mom #Resist 🌊 . #HaveFaith. Joe, the UN & our allies won't let us down!!! BE PATIENT! It's not over yet! 4am Club. Dreamer.
Musician (saxes, basses), artist, writer. Science advocate. Non believer. #brexitwasacon #wearffp3 #ClimateCatastrophe #zoology #animals. Banner is a tan and white boxer dog on a beach holding a long stick and looking to camera.
Also writes.
“Facts are not repealed by a refusal to face them.” —William Catton.
♿🏳️🌈😷#fblc
#LongCovid 2020 • #CAIDS 2021
#unhoused in #texas • she/they
🔗 linkn.bio/froglet80
Detoxing from the other place.
Masking. Vaxxing. Not relaxing.
Waiting for the cat distribution system to find me again. Elbows Up. Not playing cards.
I'm that bad motherfucker called Stagger Lee.
Mother, wife and teacher on the West Coast 🇨🇦 Vegetarian. Still choosing to stay informed to protect myself and others 😷💉
Father of 3, Dog dad of 1, Pediatric Cardiothoracic Surgeon
Aus GenX, cranky femme lesbian 🐈🫖🗾 80s New Wave music nerd. Clean air, N95 😷, Greens member.
#COVIDISNOTOVER #MASKFORYOURLIFE
No DMs.
Dean - College of Engineering at the University of California, Davis. Indoor air quality researcher. Dog lover. Music lover. Acoustic guitarist. Faith in younger generations.
Posts are my own.
Infectious disease news.
Sharing reports on outbreaks, from bird flu to Ebola. Follow this account if you want to be the first to know when a novel pathogen appears or a dangerous outbreak is brewing.
Support me here: https://ko-fi.com/hmpxvtracker
Public health warnings & health policy. Epidemiologist & health economist. Chair and Faculty at NECSI. Former 16 years at Harvard. DC & Virginia.
✏️ necsi.edu/eric-feigl-ding
🐥 x.com/drericding
📰 bit.ly/raisealarm
📝 drericding.substack.com/subscribe