Screenshot: Reiches Gaskraft-Pläne auf Habeck-Größe zusammengeschrumpft
es ist das eingetreten, was experten vorhergesagt hatten.
ein halbes Jahr hat Reiche damit verschenkt.
gleichzeitig:
* ersaufen die Netzbetreiber in Speicheranfragen
*ist die Smart-Meter-Quote eine nationale Peinlichkeit
* versumpft bidirektionales Laden
21.10.2025 17:06 —
👍 596
🔁 160
💬 20
📌 5
 07.09.2025 20:22 —
👍 2
🔁 0
💬 0
📌 0
07.09.2025 20:22 —
👍 2
🔁 0
💬 0
📌 0
The year 2000 sometimes seems like yesterday, so close. What memories do you have? And now think of the year 2050, it's as close as the year 2000, only 25 years. If 2000 feels like yesterday, 2050 is like tomorrow.
29.08.2025 20:20 —
👍 0
🔁 0
💬 0
📌 0


Wichtiger Hinweis, war mir nicht bewusst, das verändert die Statistik deutlich. Mild-Hybride machten im H1 2025 etwa 45 % der „alternativen Antriebe“ aus.
Immerhin E-Autos trotz dieser fake Hybriden auf dem Vormarsch.
08.08.2025 06:06 —
👍 1
🔁 0
💬 1
📌 0

Ging ja viel durch die Presse, dass reine E-Autos bei den Neuzulassungen in 🇩🇪 inzwischen bei 17,7% liegen. Noch eindrucksvoller finde ich, dass klassische Verbrenner inzwischen deutlich weniger als 50% ausmachen:
07.08.2025 13:29 —
👍 1
🔁 1
💬 2
📌 0
For too long, Europe has relied on China for trade, Russia for energy and the US for security.
03.08.2025 17:53 —
👍 1
🔁 2
💬 0
📌 0

Hier noch zum Vergleich das hochgelobte 🇨🇳, wo immer noch mehr als die Hälfte der Neuzulassungen klassische Verbrenner sind. Allerdings liegt der Anteil reiner E-Autos höher.
07.08.2025 13:49 —
👍 0
🔁 0
💬 0
📌 0

Aus den Juli-Zahlen geht auch hervor, dass der Anteil reiner E-Autos weiter steigt (auf nun 18,4%). 🔋
07.08.2025 13:29 —
👍 0
🔁 0
💬 1
📌 0

Und der Trend scheint sich zu verstärken, darauf deuten die gerade erschienen Zahlen für Juli hin.
Der Verbrenner hat nun auch in 🇩🇪seinen Rückzug angetreten.
07.08.2025 13:29 —
👍 0
🔁 0
💬 1
📌 0
Ging ja viel durch die Presse, dass reine E-Autos bei den Neuzulassungen in 🇩🇪 inzwischen bei 17,7% liegen. Noch eindrucksvoller finde ich, dass klassische Verbrenner inzwischen deutlich weniger als 50% ausmachen:
07.08.2025 13:29 —
👍 1
🔁 1
💬 2
📌 0
For too long, Europe has relied on China for trade, Russia for energy and the US for security.
03.08.2025 17:53 —
👍 1
🔁 2
💬 0
📌 0
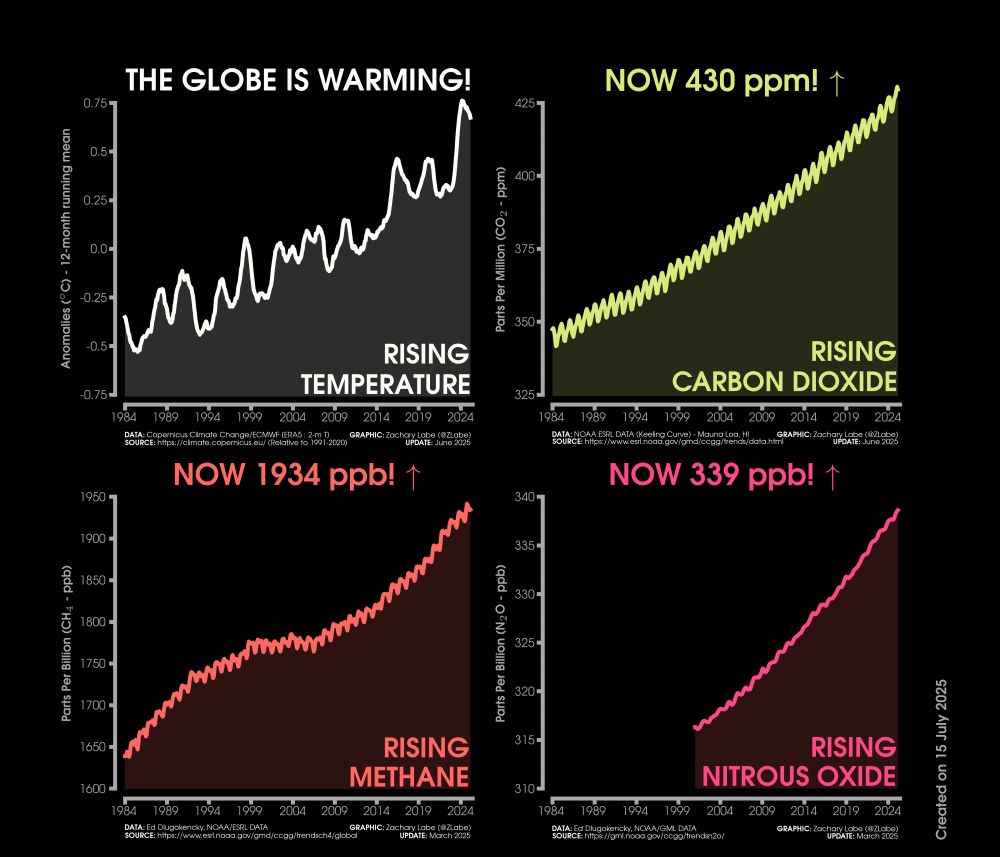
This graphic shows four line graph time series and each are monthly from January 1984 through June 2025. The first graph is a 12-month running mean of global mean surface temperature anomalies. Anomalies are computed relative to a 1991-2020 baseline using ERA5 data. The second graph is monthly carbon dioxide abundance. The CO2 graph is the Keeling Curve. Current levels are 430 ppm. The third graph is monthly global methane abundance. Current levels are 1934 ppb. The fourth graph is monthly global nitrous oxide abundance. Current levels are 339 ppb. The three greenhouse gases show seasonal cycles and long-term increasing trends using data from NOAA ESRL. The global mean surface temperature anomaly record also exhibits decadal variability and a long-term increasing trend. All graphs are rising and shown in four different colors, including white, yellow, orange, and pink.
It's time for your monthly climate change update: 🫣
+ Global temperature: 📈
+ Carbon dioxide (CO₂): 📈
+ Methane (CH₄): 📈
+ Nitrous oxide (N₂O): 📈
Graphic by zacklabe.com/climate-chan...
25.07.2025 00:42 —
👍 177
🔁 94
💬 3
📌 9
Super thoughtful piece by @davidautor.bsky.social and @gordonhanson.bsky.social on the next China shock and strategies to confront it. As simple as possible, but no simpler, when it comes to a solution.
14.07.2025 17:22 —
👍 8
🔁 3
💬 0
📌 0
Hier sieht man die Flut kommen. Ziemlich krass.
05.07.2025 14:47 —
👍 3
🔁 1
💬 0
📌 0
Und Fluten in den USA, Texas
05.07.2025 09:44 —
👍 3
🔁 0
💬 0
📌 0
The stories coming out of Texas are tragic
05.07.2025 03:22 —
👍 343
🔁 61
💬 31
📌 3

Graphic shows three line graph time series of monthly carbon dioxide abundance in ppm (blue line), monthly methane abundance in ppb (red line), and monthly nitrous oxide in ppb (purple line). Graphs are all shown from January 1984 through February 2025/May 2025. Current levels of CO2 are 431 ppm. Current levels of methane are 1934 ppb. Current levels of nitrous oxide are 339 ppb. All graphs show long-term increasing trends along with some interannual variability and seasonality.
ICYMI - the latest monthly status on greenhouse gas levels...
For more data: gml.noaa.gov/ccgg/
29.06.2025 01:42 —
👍 108
🔁 49
💬 7
📌 5
One of the biggest problems with the world is that fools are always so sure and certain about everything and intelligent people are so full of doubts and uncertainties.
19.06.2025 14:15 —
👍 5623
🔁 1233
💬 103
📌 55

The US economy shrinks (-0.2%) just as suddenly as the German economy grows (+0.4%).
🇺🇸 🇩🇪
29.05.2025 12:57 —
👍 2
🔁 0
💬 0
📌 0
Höcke löscht einen Post, wo er Beamten zu drohen schien, Chrupalla kündigt "Mäßigung" an.
Schaut, wie schnell die Faschisten in Deckung gehen, wenn sie ein bisschen Widerstand von der Demokratie spüren. Das sollte uns ermutigen, härtere Kante zu zeigen!
Wehrt euch jetzt, es funktioniert!
04.05.2025 17:41 —
👍 3691
🔁 900
💬 69
📌 11
He stood there on Jan 20 and falsely mouthed the words to protect and defend our Constitution.
Asked now on Meet the Press if he thinks he needs to uphold the Constitution, he says, “I don’t know.”
Translation: No.
Woe to America and the utter failure of putting this man back in our Oval Office.
04.05.2025 15:19 —
👍 18855
🔁 5672
💬 949
📌 310

Any questions?
04.05.2025 20:05 —
👍 0
🔁 0
💬 0
📌 0
Kamala was right. And it only took him less than 30 days to roll over for Putin.
19.02.2025 19:52 —
👍 62094
🔁 18830
💬 2097
📌 1483
Much of this growth has been driven by China, which by 2023, accounted for about 43% of the cumulative installed capacity worldwide.
A reason for the acceleration has been a decrease in the price of solar panels. Since 2001, it has dropped by 95%, from $6.21 to $0.31 per watt.
10.02.2025 07:24 —
👍 1
🔁 0
💬 0
📌 0

In 2004, it took the world a year to add 1GW of solar power — in 2023, it took a day. And in 2024, a bit more than half a day (an estimated 600GW was added last year, not shown in the graph below).
10.02.2025 07:24 —
👍 3
🔁 1
💬 1
📌 0
Finde es spannend, wie die Rechtsradikalen Hunderttausende friedlich Demonstrierende sehen können und sie für Demokratiefeinde halten, während paar tausende, Galgen-Tragende, gewalttätige Rechtsextreme natürlich "das Volk" sein sollen. 😂
02.02.2025 19:19 —
👍 3167
🔁 527
💬 33
📌 7

Wenn Du die Themen anderer Parteien bespielst, passiert das. Zigfach erwiesen.
01.02.2025 18:31 —
👍 2
🔁 0
💬 0
📌 0
Sarah Tacke in Richtung Linnemann (2/2)
30.01.2025 22:07 —
👍 434
🔁 98
💬 9
📌 10
Sarah Tacke in Richtung Linnemann (1/2)
30.01.2025 22:03 —
👍 576
🔁 212
💬 14
📌 46

I continue to see comments that suggest somehow high energy prices in Europe have to do with renewables.
That's nonsense:
1️⃣ most energy use is NOT electricity but gas+oil
2️⃣ gas prices are still >3x higher than pre-Ukraine invasion
3️⃣ in most electricity markets gas sets the price most of the time
26.01.2025 11:05 —
👍 297
🔁 93
💬 9
📌 4