Histograms of lead concentration samples faceted by collector (MDEQ or Virgina Tech); x-axis is lead levels in ppb (log-scale), and y-axis is counts. Two removed samples in MDEQ are colored in red. Dashed and dotted lines show mean excluding and including those removed two.
My submission for #TidyTuesday, Week 44 on lead concentration in Flint water samples in 2015. I compare sample distributions by MDEQ and Virginia Tech.
Code: github.com/mitsuoxv/tid...
04.11.2025 07:18 — 👍 5 🔁 0 💬 0 📌 0

Line chart of 12 prizes; x-axis is decade, and y-axis is man ration in winners.
My submission for #TidyTuesday, Week 43 on Selected British Literary Prizes (1990-2020). I explore man ratio in winners by prize and decade.
Code: github.com/mitsuoxv/tid...
28.10.2025 06:12 — 👍 7 🔁 0 💬 0 📌 0

UK map with 27 points, of which color represents August maximum temperature rise from 1960s to 2020s.
My submission for #TidyTuesday, Week 42 on Historic UK Meteorological & Climate Data. I explore August maximum temperature rise from 1960s to 2020s by station.
Code: github.com/mitsuoxv/tid...
21.10.2025 07:18 — 👍 8 🔁 0 💬 0 📌 0
I have updated my Shiny app to show IMF World Economic Outlook database, October 2025.
mitsuoxv.shinyapps.io/imf-weo/
16.10.2025 09:02 — 👍 8 🔁 2 💬 0 📌 0

Line chart; x-axis is years from 2005 to 2024, and y-axis is prevalence of undernourishment. 4 lines are low, lower-middle, upper-middle and high income economies.
My submission for #TidyTuesday, Week 41 on World Food Day. I explore undernourishment changes by income-level.
Code: github.com/mitsuoxv/tid...
14.10.2025 07:37 — 👍 5 🔁 0 💬 0 📌 0

Scatterplot; x-axis is basketball seasons from 1958 to 2024-25, and y-axis is the championship club.
Correction: I redraw the chart based on the data from Wikipedia.
08.10.2025 06:28 — 👍 1 🔁 0 💬 0 📌 0

Scatterplot; x-axis is non-continuous years from 1992 to 2025, and y-axis is the team-city-country which won the title.
My submission for #TidyTuesday, Week 40 on EuroLeague Basketball. I explore which team won the title each year.
Code: github.com/mitsuoxv/tid...
07.10.2025 08:21 — 👍 12 🔁 0 💬 1 📌 0

Line chart of 2 lines (one for spring, and the other for fall); x-axis is year (1994-2024), and y-axis is max crane observation in each year-season at Lake Hornbogasjon, Sweden.
My submission for #TidyTuesday, Week 39 on Crane Observations at Lake Hornborgasjon, Sweden (1994-2024). I explore max observation in each season (spring and fall).
Code: github.com/mitsuoxv/tid...
02.10.2025 08:17 — 👍 9 🔁 0 💬 0 📌 0

Scatterplots by sex and k factor; x-axis is ratings in August, and y-axis is ratings in September 2025. Each point is colored with year of birth of a player.
My submission for #TidyTuesday, Week 38 on FIDE Chess Player Ratings. I explore rating change from August to September 2025 by sex and k factor.
Code: github.com/mitsuoxv/tid...
23.09.2025 08:34 — 👍 6 🔁 1 💬 0 📌 0

Box plots of calories per serving; x-axis is country, and y-axis is calories per serving.
My submission for #TidyTuesday, Week 37 on Allrecipes. I explore calories per serving by country.
Code: github.com/mitsuoxv/tid...
19.09.2025 12:15 — 👍 8 🔁 0 💬 2 📌 0

Black Screen or Login Issues (Pop!_OS 22.04 LTS)
Are you getting stuck in a login loop, even though your password is correct? Do you see a black screen after you log in?
Ctl+Alt+F5 saved me yesterday, when login screen failed to appear in Pop! OS 22.04. Once in TTY mode, sudo apt update, sudo apt dist-upgrade and sudo reboot. Then login screen appeared as usual.
support.system76.com/articles/log...
19.09.2025 10:03 — 👍 0 🔁 0 💬 0 📌 0

Line chart of 3 countries (Singapore, Japan and the US); x-axis is years from 2006 to 2025, and y-axis is ranking of visa free count.
My submission for #TidyTuesday, Week 36 on Henley Passport Index Data. I explore rank changes among top rank countries.
Code: github.com/mitsuoxv/tid...
09.09.2025 12:56 — 👍 9 🔁 0 💬 0 📌 1

Bar chart filled with frog tribes; x-axis is # of events, and y-axis is four seasons from spring to winter.
My submission for #TidyTuesday, Week 35 on Australian Frogs. I explore frog tribes by season.
Code: github.com/mitsuoxv/tid...
04.09.2025 12:22 — 👍 7 🔁 0 💬 0 📌 0

Bar chart filled with decades to hit Number One; x-axis is # of Number One Songs, and y-axis is top 8 artists.
My submission for #TidyTuesday, Week 34 on Billboard Hot 100 Number Ones. I explore # of Number One Songs by artist.
Code: github.com/mitsuoxv/tid...
27.08.2025 09:36 — 👍 8 🔁 1 💬 0 📌 0

A map of Munros in Scotland, 2021.
My submission for #TidyTuesday, Week 33 on Scottish Munros. I try a map of Munros in 2021.
Code: github.com/mitsuoxv/tid...
20.08.2025 09:25 — 👍 6 🔁 1 💬 0 📌 0

Bar charts faceted by event type like heat or snow; x-axis is years when studies were published, y-axis is number of studies, and bar is filled with climate change impact classification like more severe or less severe.
My submission for #TidyTuesday, Week 32 on Extreme Weather Attribution Studies. I explore climate change impact by event type according to studies.
Code: github.com/mitsuoxv/tid...
12.08.2025 11:29 — 👍 4 🔁 0 💬 0 📌 0

Line charts of 28 European countries faceted by before or after tax; x-axis is years from 1968 to 2023, and y-axis is Gini coefficient.
My submission for #TidyTuesday, Week 31 on Income Inequality Before and After Taxes. I explore before and after tax Gini coefficient movement in European countries.
Code: github.com/mitsuoxv/tid...
06.08.2025 11:44 — 👍 8 🔁 0 💬 0 📌 0

Line chart faceted by top 4 viewed series; x-axis is report period from 2023Jul-Dec to 2025Jan-Jun, and y-axis is hours viewed in millions.
My submission for Week 30 on What have we been watching on Netflix? I explore hours viewed by season in top 4 viewed series.
Code: github.com/mitsuoxv/tid...
01.08.2025 05:18 — 👍 5 🔁 0 💬 0 📌 0

Histogram faced by whether the art is displayed after 2009 global financial crisis or not; x-axis is # of lines going through the station where the art is displayed, and y-axis is # of displayed arts in NYC transit.
My submission for #TidyTuesday, Week 29 on MTA Permanent Art Catalog. I explore distribution of arts by the number of lines of the station.
Code: github.com/mitsuoxv/tid...
22.07.2025 13:10 — 👍 5 🔁 0 💬 0 📌 0

Bar chart; x-axis is years from 1998 to 2023, y-axis is funding in real terms (year 2000 GBP in millions), and each bar is filled with funding sources like grant-in-aid and donation.
My submission for #TidyTuesday, Week 28 on British Library Funding. I explore funding changes from Labour to Conservative administration.
Code: github.com/mitsuoxv/tid...
16.07.2025 07:40 — 👍 6 🔁 0 💬 0 📌 0

2 scatterplots; common y-axis is spam user probability, x-axis in left is # of answers per user, and x-axis in right is max value of RGB difference square sum in case of less than 50 answers.
My submission for #TidyTuesday, Week 27 on The xkcd Color Survey Results. I explore which types of users are most likely to be spam users.
Code: github.com/mitsuoxv/tid...
12.07.2025 06:55 — 👍 5 🔁 0 💬 0 📌 0

2 line charts; common x-axis is date (weekly) from 1994 to 2025, and y-axis is either premium price or rate over regular gasoline. Red line is premium, and blue line is midgrade. Formulation is conventional.
My submission for #TidyTuesday, Week 26 on Weekly US Gas Prices. I explore premium price and rate over regular gasoline (conventional formulation).
Code: github.com/mitsuoxv/tid...
01.07.2025 12:01 — 👍 6 🔁 0 💬 1 📌 0

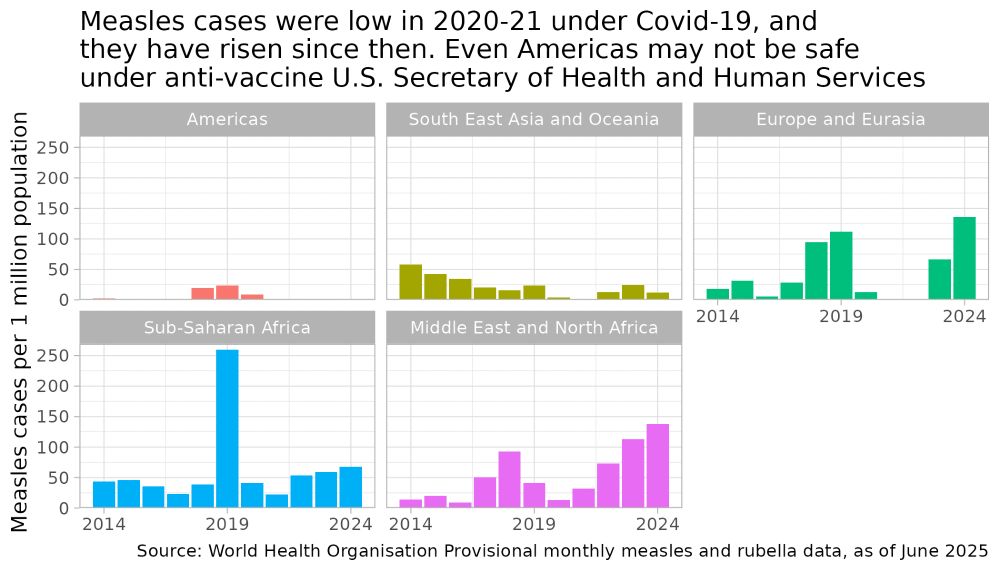
Bar charts faceted by region (basically continent); x-axis is year from 2014 to 2024, and y-axis is measles cases per 1 million population.
My submission for #TidyTuesday, Week 25 on Measles cases across the world. I explore measles incidence rates by region and year.
Code: github.com/mitsuoxv/tid...
25.06.2025 01:18 — 👍 7 🔁 1 💬 0 📌 0

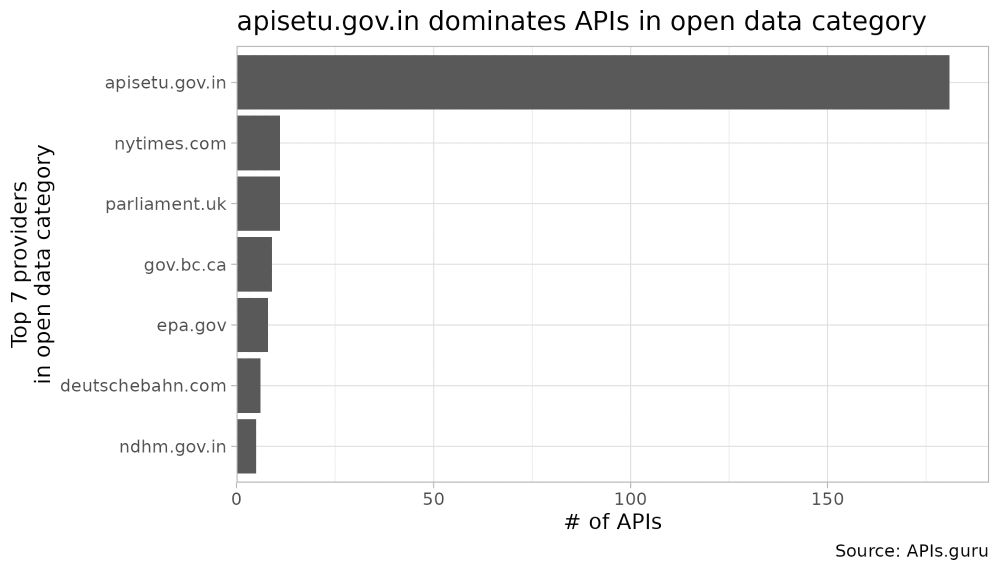
Bar chart; x-axis is # of APIs, and y-axis is top 7 providers in open data category.
My submission for #TidyTuesday, Week 24 on API Specs. I explore who provides largest number of APIs in open data category.
Code: github.com/mitsuoxv/tid...
17.06.2025 12:29 — 👍 4 🔁 0 💬 0 📌 0

Bar charts of counting male or female appointments faceted by president party (Democratic or Republican), and year range (Lincoln to L. B. Johnson, or Nixon to Obama).
My submission for #TidyTuesday, Week 23 on U.S. Judges and historydata R Package. I explore gender appointment tendency by president party, and year range (Lincoln to L. B. Johnson, or Nixon to Obama).
Code: github.com/mitsuoxv/tid...
10.06.2025 06:39 — 👍 3 🔁 1 💬 0 📌 0

Bar chart; x-axis is number of available languages, and y-axis is authors.
My submission for #TidyTuesday, Week 22 on Project Gutenberg. I explore whose work is most widely translated.
Code: github.com/mitsuoxv/tid...
03.06.2025 05:14 — 👍 5 🔁 0 💬 0 📌 0

Boxplot; x-axis is challenge ratings of monsters, and y-axis is monster type.
My submission for Week 21 on Dungeons and Dragons Monsters (2024). I explore which monster type has the broadest range of challenger ratings.
Code: github.com/mitsuoxv/tid...
27.05.2025 06:43 — 👍 3 🔁 0 💬 0 📌 1

Scatterplots faceted by region and decade; x-axis is cumulative rainfall from yesterday (mm, log scale), and y-axis is water quality in CFU per 100 ml (log scale). Points are colored red if y > 200 (unsafe), green if y < 40 (safe), and gray inbetween.
My submission for #TidyTuesday, Week 20 on Water Quality at Sydney Beaches. I explore relationship between rainfall and water quality, by region and decade.
Code: github.com/mitsuoxv/tid...
20.05.2025 11:35 — 👍 5 🔁 1 💬 1 📌 0

Scatterplot; x-axis is depth in km (log scale), and y-axis is Md (long scale), excluding negative value events (microearthquakes).
My submission for Week 19 on Seismic Events at Mount Vesuvius. I explore correlation between depth and Md.
Code: github.com/mitsuoxv/tid...
13.05.2025 06:34 — 👍 1 🔁 0 💬 0 📌 0

Bar charts faceted by in Cruz list or not; x-axis is number of grants terminated, and y-axis is 9 directorates.
My submission for Week 18 on NSF Grant Terminations under the Trump Administration. I explore terminated grants by directorate, expected end year, and in Cruz list or not.
Code: github.com/mitsuoxv/tid...
06.05.2025 05:02 — 👍 1 🔁 0 💬 0 📌 0
The official account of Joseph E. Stiglitz, Nobel laureate economist
at Columbia University. Co-president, Initiative for Policy Dialogue.
Co-chair, ICRICT. Latest books: The Road to Freedom; The Origins of Inequality & Policies to Contain It
Scientist/Author/Speaker; Presidential Distinguished Prof/Director Center for Science, Sustainability & the Media, U. Penn; National Academy of Sciences; Royal Society; Tyler Prize
Director of Engineering at Heap. #rstats fan. Dad x2. He/him
Anthropologist - Bayesian modeling - science reform - cat and cooking content too - Director @ MPI for evolutionary anthropology https://www.eva.mpg.de/ecology/staff/richard-mcelreath/
Our mission: To provide tools and resources to foster a diverse, friendly, and inclusive community of data science learners and practitioners. Join us at https://dslc.io
Emeritus Professor of Economics, Oxford University.
Institute Professor, MIT Economics. Co-Director of @mitshapingwork.bsky.social. Author of Why Nations Fail, The Narrow Corridor, and Power & Progress.
Ezra Klein’s tweets, articles, clips and podcasts on Bluesky.
Join the UseR! at Warsaw!
We’re excited to announce that UseR! Conference in 2026 is being hosted in Warsaw, bringing together data scientists, statisticians, and researchers from across the world.
7-9 July, 2026
https://user2026.r-project.org/
We make free, open-source software for data scientists like the RStudio IDE.
We're formerly known as RStudio. You can always download our open-source IDE here. https://posit.co/download/rstudio-desktop/
Software engineer @posit.co, humane #rstats
R, data, 🐕, 🍸, 🌈. He/him.
Ex NY Times, now author of Substack Paul Krugman. Nobel laureate and, according to Donald Trump, "Deranged BUM"
official Bluesky account (check username👆)
Bugs, feature requests, feedback: support@bsky.app


