So altert das Gehirn
In einer Studie der HU Berlin wurden genetische Ursachen und beeinflussbare Risiken für die Alterung des Gehirns untersucht. Grundlage der Analyse sind die Daten der Britischen UK Biobank. Für die Stu...
Exciting times: Ich durfte bei RBB Radioeins ein paar Minuten über unsere Studie zum biologischen Alter des Gehirns in über 56.000 Teilnehmer:innen der UK Biobank sprechen.
👉 Interview: www.radioeins.de/programm/sen...
👉 Studie: www.nature.com/articles/s43...
30.10.2025 11:28 — 👍 2 🔁 1 💬 0 📌 0
Big thanks to Nature Aging for the shoutout! Curious to dig deeper? We’ve posted a thread with more details and background on the work 👇
Thread: bsky.app/profile/pjaw...
17.10.2025 19:30 — 👍 0 🔁 0 💬 0 📌 0
Largest multi-ancestry genomic study of Alzheimer’s disease led by @euffelmann.bsky.social and @daniposthu.bsky.social et al. — big leap forward for polygenic risk prediction and potential drug target discovery.
Preprint: www.medrxiv.org/content/10.1...
14.10.2025 13:06 — 👍 1 🔁 0 💬 0 📌 0
Great opportunity to reshare the Big Five facets correlation plot I made earlier, showing how the synthetic data from synthpop matches the original dataset (n = 468). Cheers! :-P
09.10.2025 12:44 — 👍 3 🔁 0 💬 1 📌 0
Thanks for the question! Indeed, our phenome scan (Table S2) revealed links with wrist-accelerometer traits — notably fraction acceleration ≤ 1 mg (inactive time) and no-wear bias–adjusted acceleration maximum (peak movement) over 7 days, plus self-report measures like "walking for pleasure". 🏃♀️
07.10.2025 10:48 — 👍 2 🔁 0 💬 0 📌 0
🙌 Thanks to everyone involved — especially colleagues at @humboldtuni.bsky.social, @mpicbs.bsky.social, and @unileipzig.bsky.social for their support and collaboration.
07.10.2025 09:59 — 👍 3 🔁 0 💬 0 📌 0
📚 Take-home:
Brain aging is a complex but quantifiable trait shaped by genes and environment. Our findings suggest that healthier lifestyles are linked to younger-looking brains. Key genes like MAPT and pathways in immunity and neurogenesis give us clues for keeping brains younger for longer.
07.10.2025 09:58 — 👍 3 🔁 0 💬 1 📌 0

Genetic effect-size distribution analysis of BAG. a, Results are shown for combined GM and WM BAG, with neuroticism and standing height included as reference traits; effect-size distributions of the underlying susceptibility variants are shown; wider tails indicate a greater proportion of large-effect variants. b, Predicted number of genome-wide significant loci as a function of sample size. c, Proportion of genetic variance explained by genome-wide significant loci as a function of sample size.
We estimate that ~9–11k common genetic variants contribute to BAG — a level of polygenicity similar to height, but much lower than neuroticism. That’s good news: discovery power scales well, and with ~1 M participants (phew — still quite a way to go!) we could capture most common genetic influences.
07.10.2025 09:56 — 👍 4 🔁 0 💬 1 📌 0

Results of the generalized summary-data-based Mendelian randomization (GSMR) results for 3 risk factors (exposures) and combined brain age gap (outcome). Each plot shows multiple genetic variants serving as instruments to test for causality between the exposure and outcome variable. Under a causal model, variant effects on the outcome (bzy; y-axis) are expected to be linearly proportional to the variant effects on the exposure variable (bzx; x-axis). The ratio between bzy and bzx provides an estimate of the mediation effect of x on y (bxy). Variants flagged for potential horizontal pleiotropy were excluded using the HEIDI-outlier method. s.e. standard error of the mediation effect; pxy P value of the mediation effect.
⚡ Mendelian randomization suggests causal effects:
Higher blood pressure and type 2 diabetes drive accelerated brain aging — each 1 SD increase in blood pressure corresponds to ~0.5 years older brain age.
07.10.2025 09:54 — 👍 4 🔁 2 💬 1 📌 0

Genetic correlations between BAG and a wide range of complex traits. a, Genetic correlation matrix between BAG (columns) and 38 selected phenotypes from different health domains (rows). *P < 0.05 (nominal significance). **FDR < 0.05 (level of significance after correction for multiple testing). b, Volcano plot showing the magnitude (x axis) and significance (y axis) of LDSC-based genetic correlations between GM BAG and 989 traits, whose summary statistics were provided in ref. 80. The dashed horizontal line indicates the FDR-adjusted level of significance. All P values are two-sided. c, Forest plot showing the genetic correlation coefficients and standard errors for a subset of 23 exemplary traits that showed significant genetic correlations with GM BAG.
🔗 Genetic correlations show broad overlap with lifestyle, mental, physical, and socioeconomic traits:
⬆️ blood pressure, diabetes, drinking, smoking, depressed mood
⬇️ lung function, cognition, longevity, education, income
🧠 Brain aging lies at the intersection of body, mind, and environment.
07.10.2025 09:53 — 👍 2 🔁 0 💬 2 📌 0
🔎 Pathway analyses show enrichment for:
• Immune and viral response genes
• Neurogenesis and axon development
• Small GTPase binding – key regulators of cellular timing mechanisms
Brain aging is not just “wear and tear” — it’s tied to immune and developmental biology.
07.10.2025 09:46 — 👍 4 🔁 0 💬 1 📌 0

🧬 A new polygenic score for BAG explains ~10% of variance — a big leap from previous ~2%. Still, prediction in non-European ancestries remains limited, highlighting the urgent need for more diverse genomic data.
07.10.2025 09:44 — 👍 3 🔁 0 💬 1 📌 0

Genome-wide association meta-analyses of BAG traits. Manhattan (a–c) and quantile–quantile (QQ) plots (d–f) showing the results of the European-ancestry GWAS meta-analyses for the three BAG traits (n = 54,890). The Manhattan plots show the P values (−log10 scale) of the tested genetic variants on the y axis and base-pair positions along the chromosomes on the x axis. P values were derived from two-sided linear regression models using PLINK, followed by meta-analysis using inverse-variance weighting in METAL. The solid horizontal line indicates the threshold of genome-wide significance (two-sided P = 5.0 × 10⁻⁸, accounting for multiple testing). Index variants are highlighted by the diamonds. The results of the pseudoautosomal variants have been added to chromosome X. Quantile–quantile plots show the observed P values from the association analysis versus the expected P values under the null hypothesis of no effect (−log10 scale). For illustrative reasons, the y axis has been truncated at P = 1.0 × 10−40. a,d, GM BAG (Manhattan and QQ). b,e, WM BAG (Manhattan and QQ). c,f, Combined GM and WM BAG (Manhattan and QQ).
💥 We identified 59 genomic loci, including 39 never linked before to brain aging. The strongest signal is at MAPT (tau) — a well-known Alzheimer’s gene — confirming its central role in brain structural aging.
07.10.2025 09:42 — 👍 3 🔁 0 💬 1 📌 0

Phenotypic characteristics and associations of combined BAG. a, The blue dots in the first three plots (left to right) show brain-predicted age estimates (combined GM and WM) plotted against chronological age in the UKB discovery sample (n = 32,634), UKB replication sample (n = 21,881, merged across ancestries) and the LIFE-Adult replication sample (n = 1,833). To facilitate comparisons, the results of the UKB discovery sample are also shown as gray dots in the background of the LIFE replication plot. At this stage, brain-predicted age estimates have not yet been bias-corrected for regression dilution, as indicated by the solid linear regression line crossing the dashed identity line. The fourth plot shows the test–retest reliabilities of combined BAG in a subset of the UKB discovery (gray dots, n = 3,751) and UKB replication sample (blue dots, n = 395). BAG was residualized for sex, age, age2, scanner site and total intracranial volume. b, Cross-trait association results between combined BAG and 7,088 UKB phenotypes across several health domains. Analyses were conducted using PHESANT, which applies data-type-specific regression models (linear, logistic, ordered logistic or multinomial logistic regression). All models included sex, age, age2, scanner site and total intracranial volume as covariates. The horizontal lines indicate the Bonferroni-adjusted (solid) and FDR-adjusted (dashed) two-sided level of significance. The top associations per category are annotated. c, Surface plots showing the correlations between combined BAG and 220 FreeSurfer brain structure variables. The colors reflect the strength and direction of partial product-moment correlations (sex, age, age2, scanner site and total intracranial volume served as covariates). ICC, intraclass correlation coefficient (C, 1); rho, product-moment correlation coefficient.
🧠 The brain age gap (BAG) = your brain’s predicted MRI age minus your actual age.
A higher BAG means your brain looks “older” than expected. We show BAG is substantially heritable (~23–29% due to common variants), meaning genes do play a big role — but environment and lifestyle matter too.
07.10.2025 09:41 — 👍 2 🔁 0 💬 1 📌 1
She gently reminded us that every primate — just like us — has their own personality, emotions, relationships, and individuality. Because of her, we see our place more clearly among the other beings we share this world with.
01.10.2025 19:34 — 👍 1 🔁 0 💬 0 📌 0
The funnel plot suggests a formidable publication bias—excellent material for class discussions! You can find my R script on OSF (osf.io/u6hsn/) and adapt it for your own purposes. 2/2
#OpenScience #Reproducibility #BehavioralGenetics
23.09.2025 15:01 — 👍 0 🔁 0 💬 0 📌 0
A while ago, when I was in my first semester teaching behavioral genetics, I was eager to discuss candidate gene controversies. I created an interactive funnel plot based on the meta-analysis by Karg et al. (2011), who reported strong evidence for an effect of 5-HTTLPR × stress on depression. 1/2
23.09.2025 14:58 — 👍 0 🔁 0 💬 1 📌 0
Fantastic work on Personality Genetics—absolutely love it! 🚀 Curious if applying SBayesRC with 7M variants could push polygenic score performance even further 🤔
16.09.2025 17:08 — 👍 0 🔁 0 💬 0 📌 0

Welcome to the Bluesky account for Stand Up for Science 2025!
Keep an eye on this space for updates, event information, and ways to get involved. We can't wait to see everyone #standupforscience2025 on March 7th, both in DC and locations nationwide!
#scienceforall #sciencenotsilence
12.02.2025 17:04 — 👍 11525 🔁 5466 💬 291 📌 675
GitHub - MichelNivard/awesome-complex-trait-genetics: A list of awesome tools for complex trait genetics.
A list of awesome tools for complex trait genetics. - MichelNivard/awesome-complex-trait-genetics
🚨 This will become a curated list of awesome tools for complex trait genetics, **add yours**! it may become a review in which case those who contribute are invited as co-authors.
28.11.2024 09:21 — 👍 80 🔁 44 💬 7 📌 4
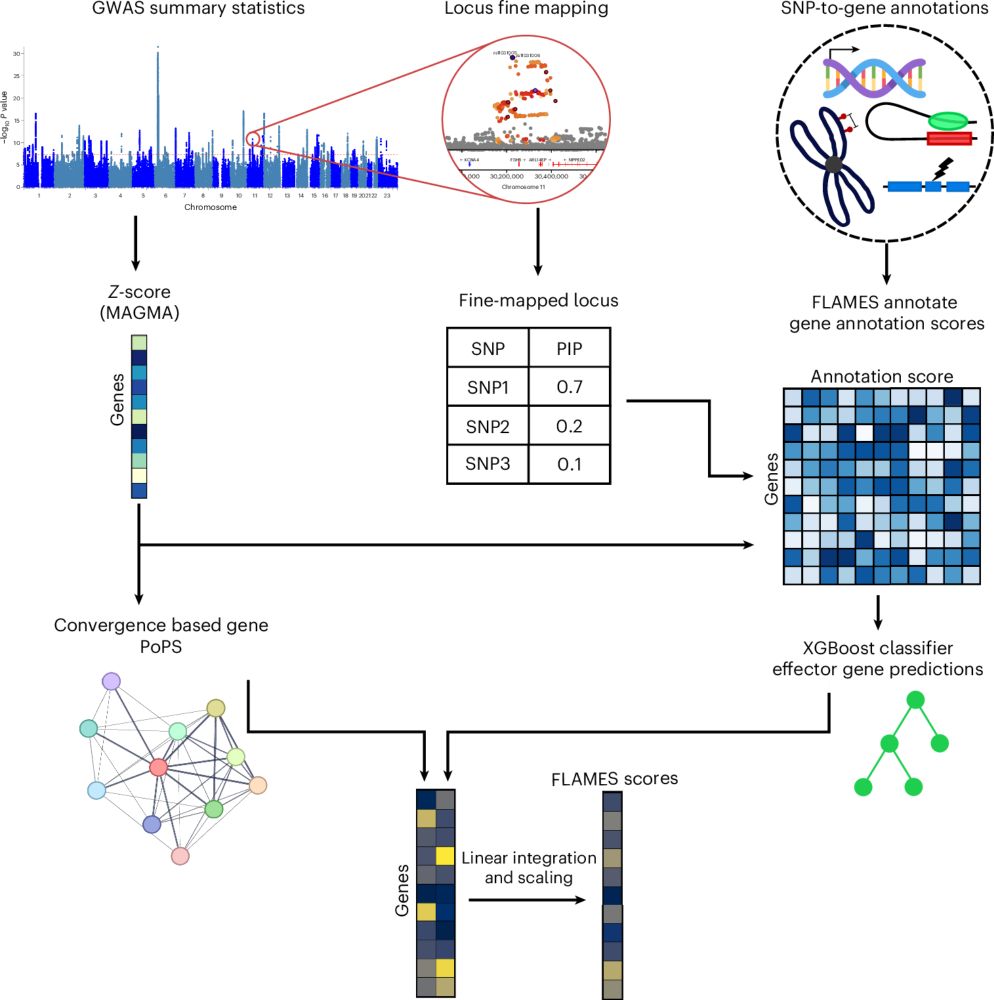
Prioritizing effector genes at trait-associated loci using multimodal evidence
Nature Genetics - FLAMES is a machine learning approach combining variant fine-mapping, SNP-to-gene annotations and convergence-based gene prioritization scores to identify candidate effector genes...
Incredibly proud to see our latest work out in Nature Genetics: www.nature.com/articles/s41...
Here we share our FLAMES framework, which predicts the effector genes in GWAS loci with state-of-the-art precision🔥
Special thanks to @daniposthu.bsky.social
A full thread describing findings below!
11.02.2025 09:58 — 👍 16 🔁 8 💬 1 📌 0

OHBM 2024 in Seoul - Impressions from the conference and the city
This is "OHBM 2024 in Seoul - Impressions from the conference and the city" by Philippe on Vimeo, the home for high quality videos and the people who love…
#OHBM2024 in Seoul was an unforgettable experience! Met brilliant minds, engaged in heated discussions, and partied with incredible people. ⬇️ Impressions from the conference and the city! 🏙️ Massive thanks to the USC team for the stunning drone footage of the ENIGMA rooftop party. vimeo.com/980726262
08.07.2024 16:18 — 👍 6 🔁 1 💬 1 📌 0
PhD student in statistical genetics at Vrije Universiteit Amsterdam
Research Group Leader MPRG Biosocial | Max Planck Institute for Human Development | Jacobs Foundation Fellow
Medical statistician, work with genetic data to disentangle causation from correlation. Author of book on Mendelian randomization.
The Enhancing NeuroImaging Genetics through Meta-Analysis Consortium is a network of 2500+ scientists across 47 countries working to discover factors that help or harm the brain. http://enigma.usc.edu
NeuroCure is a Cluster of Excellence in the neurosciences funded since 2007. The focus of the Cluster is on investigating neurological and psychiatric disorders.
Professor of behavioral genetics with my own twins. I mix behaviour and genetics at Tartu & McGill to understand obesity. I also mix global music as a DJ.
Die Alexander von Humboldt-Stiftung fördert Wissenschaftskooperationen zwischen exzellenten ausländischen und deutschen Forschenden. https://www.humboldt-foundation.de
Nature Aging is a thematic journal from the Nature Portfolio that serves the broad aging research community. Follows & posts ≠ endorsements.
Head of Virology at Charite - Universitätsmedizin Berlin
https://abdelrahmanlab.com/
https://www.psychology.hu-berlin.de/de/prof/neuro
Brain imaging research, Oxford
EiC, Imaging Neuroscience https://bsky.app/profile/imagingneurosci.bsky.social
Neuroscientist, professor
AI guided tour - https://www.youtube.com/watch?v=fOORfzGjCTA
ENIGMA guided tour - https://www.youtube.com/watch?v=YNjP5nZsJyQ
Diffusion MRI of Brain Diseases - https://www.youtube.com/watch?v=i2jHFm0wcN0
Psychiatry, Genetics, Epidemiology, Precision Medicine. Author of The Other Side of Normal. 3% Neanderthal.
A multidisciplinary community of researchers with the mission to better understand the roots of disease and narrow the gap between new biological insights and impact for patients. Broadinstitute.org
Nature Portfolio’s high-quality products and services across the life, physical, chemical and applied sciences is dedicated to serving the scientific community.
Genomicist, computational biologist. Assistant professor @ MGH, HMS. Associate member @ Broad Institute
https://klab.is
Physics/Biology/Education. Postdoc at HU-Berlin. Bacterial GeneRegulation, Evolution, Ageing, Biophysical & Mathematical Modelling, and many more.
Behavioral Geneticist, Associate Professor at Middlebury College
Cognitive, brain & mind scientist @mpicbs.bsky.social & Max Planck Dahlem Campus of Cognition (Berlin) | head of @mbe-lab.bsky.social (he/him)
brain-body coupling | emotion & stress | 3D & XR for naturalistic psychology, neuroscience, & medicine
PostDoc at MPI CBS Leipzig & University of Bordeaux
Interested in healthy (vascular) brain aging - MRI - post Covid - Open Science
**** mostly private opinion posts here ****
#FCKAFD