The DFG is a state-funded but private association (e.V.). Its core principle is therefore self-governance - and hardly any of our fellow DFG colleagues seems to be paritculary concerned with revising their infrastructure to improve usability
10.11.2025 09:17 — 👍 2 🔁 0 💬 1 📌 0
Albert Ellis who was the first to introduce Cognition into Behavioural Therapy in 1957. (Rational psychotherapy and individual psychology. Journal of Individual psychology, 13) received 707 cites so far according to Google Scholar
07.11.2025 20:12 — 👍 1 🔁 0 💬 0 📌 0
.. because it adheres to the closure principle. However I am not completely sure if that generalizes to the intersection hypotheses evaluated by equivalence testing? The additional evaluation of absent super-superiority might result in error inflation?
02.11.2025 07:18 — 👍 0 🔁 0 💬 0 📌 0
Question: is there multiplicity when performing equivalence in conjunction with superiority testing? Equivalence is established by the intersection of present non-inferiority and absent super-superiority (term sucks I know). CHMP guidance says switch from non-inferiority to superiority is ok.. (1/2)
02.11.2025 07:15 — 👍 0 🔁 0 💬 1 📌 0
Exactly. If more participants are enrolled than needed, a study becomes inherently unethical. If significance and relevance are conceptually collapsible, there is no need for a competition among the different decision frameworks. What's the utility of a "significant" result if it's not relevant?
01.11.2025 05:57 — 👍 1 🔁 0 💬 1 📌 0
During the last years, I've started to reframe the problem as a question of relevance that is attributable to significance. A properly planned prospective study ensures that both, significance and relevance coincide. Otherwise any test decision (e.g. for superiority) becomes practically meaningless.
31.10.2025 12:15 — 👍 1 🔁 0 💬 1 📌 0
Sorry d = 3
14.10.2025 09:12 — 👍 1 🔁 0 💬 0 📌 0
Having taken into consideration, that the variability of the feces ratings will probably be close to 0 (and so will be the correlation), I'd stick to the d = 0.3 ;)
14.10.2025 09:12 — 👍 0 🔁 0 💬 0 📌 0
Jingle-jangle detection!
23.09.2025 13:00 — 👍 3 🔁 2 💬 1 📌 0
If mean diff is standardized by between-participant variability and the sample is pop-representative, my guess is d = 3 SD
14.10.2025 08:34 — 👍 0 🔁 0 💬 0 📌 0

The image presents a bar graph illustrating the smoking rates among adults aged 15 years and older across various countries in Western Europe for the year 2022. The bar heights represent the percentage of adults who used any form of tobacco, excluding e-cigarettes.
France has the highest smoking rate at 35%, followed closely by Greece at 33%. Spain follows with 28%, then Belgium at 27%, and Portugal, Switzerland, and Austria, all at 26%. Sweden reports a rate of 23%, while both Italy and Finland have rates of 22%. The Netherlands and Germany each have a smoking rate of 21%. Ireland reports 19%, Denmark at 16%, and the UK and Norway both have the lowest rates at 14%.
Additionally, a note indicates that the smoking rates in France and Greece are more than twice as high as those in Denmark, the UK, or Norway.
The data source is the World Health Organization, specifically the Global Health Observatory, and the information is labeled as "CC BY," indicating it is licensed for reuse.
Smoking rates vary a lot across Western Europe
06.10.2025 10:39 — 👍 48 🔁 11 💬 1 📌 7
At least to my mind.. Anyway - if you like, we might a deep dive into this at the upcoming FGME conf
27.09.2025 19:45 — 👍 0 🔁 0 💬 0 📌 0
Indeed. Those serious adverse events (SAE) are extreme manifestations of MDD morbidity. Thus, nocebo treatments (ie waitlists) increase the likelihood of SAE compared to standard of care. Given this risk, a non-inferiority trial against psychotherapy would have been more ethical and informative..
27.09.2025 19:44 — 👍 1 🔁 0 💬 0 📌 0
The NEJM article is paywalled, which complicates detailed inspection. Yet, I'd argue that MDD treatments yield potentially fatal adverse events.
27.09.2025 15:25 — 👍 1 🔁 0 💬 1 📌 0
Notwithstanding compliance with the WMA Declaration of Helsinki 2000, which requires that participants in therapeutic trials must receive the best proven, non-experimental intervention. Which is certainly not a waitlist..
27.09.2025 14:50 — 👍 0 🔁 0 💬 1 📌 0
AI4Psychology Training 2025 — AI4PSychology KI-Kompetenz Training @ ScaDS.AI, September 2025
Wir hatten heute am Institut ein hervorragendes KI-Training für die Psychologie mit vielen praktischen Tipps, durchgeführt von @haesleinhuepf.bsky.social 👌🏼 Die Materialien sind online verfügbar, falls jemand reinschauen möchte: scads.github.io/ai4psycholog...
26.09.2025 14:00 — 👍 11 🔁 2 💬 1 📌 0

Terrific @scientificdiscovery.dev post on randomized controlled trials in @ourworldindata.org.
Including this important chart on the impact of pre-registration.
Magically, when people had to pre-register outcomes, many of the benefits disappeared.
ourworldindata.org/randomized-c...
24.09.2025 17:52 — 👍 40 🔁 13 💬 1 📌 0
I'd go even further: Psychological placebo conditions, specifically waitlists which serve as nocebos, are inherently unethical (cf WMA Declaration of Helsinki, 2000). Active comparators incl. the simple A/B scheme are the way to go if we are actually into proving the superiority of psychotherapies
15.09.2025 17:56 — 👍 0 🔁 0 💬 0 📌 0
37 Performance – Model to Meaning
The new {marginaleffects} release for #RStats (0.30.0) comes with two new vignettes:
1. Speed up computation with automatic differentiation (often 10x gains) marginaleffects.com/bonus/perfor...
2. Power analyses with {marginaleffects} and {DeclareDesign}. marginaleffects.com/bonus/power....
13.09.2025 18:37 — 👍 145 🔁 34 💬 3 📌 3

Models as Prediction Machines: How to Convert Confusing Coefficients into Clear Quantities
Abstract
Psychological researchers usually make sense of regression models by interpreting coefficient estimates directly. This works well enough for simple linear models, but is more challenging for more complex models with, for example, categorical variables, interactions, non-linearities, and hierarchical structures. Here, we introduce an alternative approach to making sense of statistical models. The central idea is to abstract away from the mechanics of estimation, and to treat models as “counterfactual prediction machines,” which are subsequently queried to estimate quantities and conduct tests that matter substantively. This workflow is model-agnostic; it can be applied in a consistent fashion to draw causal or descriptive inference from a wide range of models. We illustrate how to implement this workflow with the marginaleffects package, which supports over 100 different classes of models in R and Python, and present two worked examples. These examples show how the workflow can be applied across designs (e.g., observational study, randomized experiment) to answer different research questions (e.g., associations, causal effects, effect heterogeneity) while facing various challenges (e.g., controlling for confounders in a flexible manner, modelling ordinal outcomes, and interpreting non-linear models).

Figure illustrating model predictions. On the X-axis the predictor, annual gross income in Euro. On the Y-axis the outcome, predicted life satisfaction. A solid line marks the curve of predictions on which individual data points are marked as model-implied outcomes at incomes of interest. Comparing two such predictions gives us a comparison. We can also fit a tangent to the line of predictions, which illustrates the slope at any given point of the curve.

A figure illustrating various ways to include age as a predictor in a model. On the x-axis age (predictor), on the y-axis the outcome (model-implied importance of friends, including confidence intervals).
Illustrated are
1. age as a categorical predictor, resultings in the predictions bouncing around a lot with wide confidence intervals
2. age as a linear predictor, which forces a straight line through the data points that has a very tight confidence band and
3. age splines, which lies somewhere in between as it smoothly follows the data but has more uncertainty than the straight line.
Ever stared at a table of regression coefficients & wondered what you're doing with your life?
Very excited to share this gentle introduction to another way of making sense of statistical models (w @vincentab.bsky.social)
Preprint: doi.org/10.31234/osf...
Website: j-rohrer.github.io/marginal-psy...
25.08.2025 11:49 — 👍 978 🔁 286 💬 47 📌 20

In an experiment, Pew Research Center demonstrated that opt-in and probability-based surveys produced very different results about young adults' views of the Holocaust and abortion.
Remember, if you encounter what seems like an implausible survey finding, ask:
1. Were survey respondents selected randomly or was this an opt-in poll?
2. Could the results, especially for young adults, be driven by bogus respondents?
Keep this post in mind: www.pewresearch.org/short-reads/... 🧪
08.09.2025 18:42 — 👍 259 🔁 115 💬 6 📌 5

GAMLSS, NHANES, and my own personal hell – Notes from a data witch
Fiiiiiiinally she writes the cursed GAMLSS post. Oh and it’s also about the NHANES data set I guess
It’s been a little overshadowed by the slightly unexpected mental health issues that hit me very hard yesterday afternoon, but for what it’s worth here’s the GAMLSS regression post I’ve been working on for the past month #rstats
blog.djnavarro.net/posts/2025-0...
08.09.2025 23:13 — 👍 56 🔁 15 💬 3 📌 3
 27.08.2025 06:57 — 👍 1 🔁 0 💬 1 📌 0
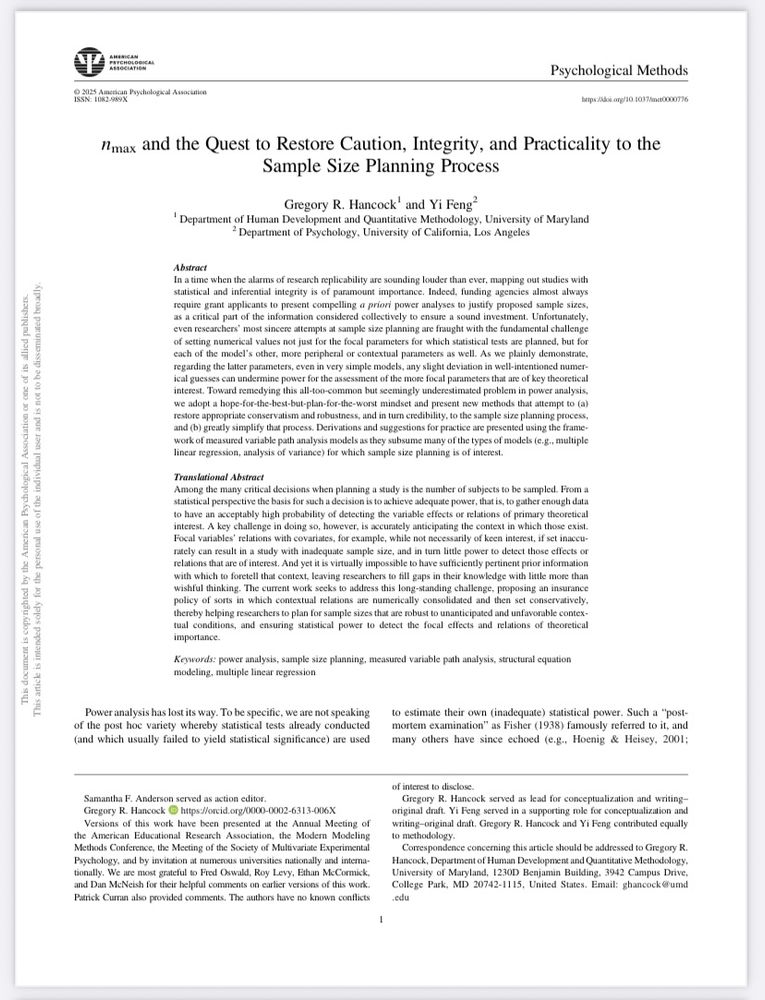
For those interested, here is a link to a new power paper:
Hancock, G. R., & Feng, Y. (2026). nmax and the quest to
restore caution, integrity, and practicality to the sample size planning process. Psychological Methods.
yifengquant.github.io/Publications...
19.08.2025 01:04 — 👍 63 🔁 24 💬 4 📌 2
How about using the term "assurance" to this end, as proposed in medical biometry?
15.08.2025 17:07 — 👍 0 🔁 0 💬 1 📌 0

New blog post! Why experiments are the gold standard for answering causal questions (pedermisager.org/blog/why-exp...). Many text books insist on experimental evidence to draw causal inferences bvut don't fully explain exactly what gives experiments their special powers.
08.08.2025 10:33 — 👍 24 🔁 8 💬 3 📌 1
Natural Language Processing in Behavioral Science
Postdoctoral Researcher @unileipzig.bsky.social
Personnel Selection & Assessment Technology at magnolia psychometrics https://www.magnolia-psychometrics.com/
Professor for Differential Psychology, Personality Psychology and Psychological Diagnostics - Head of "Networks of Behavior and Cognition" >> www.kirstenhilger.com
Postdoc position @University of Kassel | interests in personality psychology | construct validation | measurement | statistical modeling
PhD Student in Psychological Methods (University of Marburg)
Interested in time series, simulation studies & open science
https://bsiepe.github.io
Professor of Biostatistics • BMJ Deputy Chief Stats Editor • Books: "Prognosis Research in Healthcare: concepts, methods & impact" & "IPD Meta-Analysis: A Handbook for Healthcare Research.." • Websites: www.ipdma.co.uk & www.prognosisresearch.com • Whovian
Professor of Biostatistics
Vanderbilt University School of Medicine
Expert Biostatistics Advisor
FDA Center for Drug Evaluation and Research
https://hbiostat.org https://fharrell.com
The International Society for Bayesian Analysis (ISBA), est. 1992 to promote the development and application of Bayesian analysis, provides an international community for those interested in Bayesian analysis and its applications.
https://bayesian.org
Clinical Psychologist, Psychotherapist Professor @Medical School Hamburg
Interested in traumatic experiences, emotion regulation, psychotherapy research and research methods
Doctoral Researcher @isnlab.bsky.social | part of @mps-cognition.bsky.social | previously @mpicbs.bsky.social, @mpi-nl.bsky.social & @univie.ac.at
https://cognition.maxplanckschools.org/en/doctoral-candidates/ole-goltermann
Taking Registered Reports to the next level. A free, supra-journal platform that reviews & recommends Registered Reports preprints across all fields
https://rr.peercommunityin.org/
Quant Psyc professor at Arizona State. Into clustered data, latent variables, psychometrics, intensive longitudinal data, and growth modeling.
https://sites.google.com/site/danielmmcneish
Assistant Professor at the University of Amsterdam
statistics, science, software
https://www.zeileis.org/
Asst Prof UZH Psychology - quant methods, dynamic systems, human development, psychology. @CharlesDriverAU
Professor in computational Bayesian modeling at Aalto University, Finland. Bayesian Data Analysis 3rd ed, Regression and Other Stories, and Active Statistics co-author. #mcmc_stan and #arviz developer.
Web page https://users.aalto.fi/~ave/
not very committed to sparkle motion
Professor, Statistical learning in molecular medicine. Director Oslo Centre for Biostatistics and Epidemiology @ocbe.bsky.social, @uio.no & Oslo University Hospital. Posting in my own capacity. (Bio)statistics, climate breakdown, train journeys.
Psychiatrist, Cognitive-behavioural therapist, Clinical epidemiologist, who does systematic reviews, runs randomized clinical trials, performs meta-epidemiological studies and develops smartphone apps.