Screenshot of paper titled “A Priest, a Rabbi, and an Atheist Walk Into an Error Bar: Religious Meditations on Uncertainty Visualization” by Michael Correll and Lane Harrison. Below the title, an eye in a winged triangle is encircled by shapes and a ribbon with religious symbols. Text at the bottom reads “BE NOT CERTAIN.”
Find out what happens when “A Priest, a Rabbi, and an Atheist Walk Into an Error Bar 🍸”. Join @birdbassador.jorts.horse.ap.brid.gy & @laneh.bsky.social for their religious meditations on uncertainty visualization at alt.VIS, Sunday 9 AM - 12:30 PM!
#ieeevis #uncertaintyvis
arxiv.org/abs/2509.08213
01.11.2025 21:38 — 👍 1 🔁 1 💬 1 📌 0

Home | ReVISit
reVISit: Reproducible and Powerful Visualization User Studies
Revisit by @laneh.bsky.social and team is an excellent option. It requires some configuration and setup, but it works beautifully and all your data stays on your server. (revisit.dev)
12.10.2025 18:10 — 👍 7 🔁 3 💬 0 📌 0
here's a preprint of the unhinged paper i wrote with @lane
we stop just short of saying that the unthinking use of frequentist statistics puts your very soul at hazard
https://arxiv.org/pdf/2509.08213
11.09.2025 13:33 — 👍 6 🔁 2 💬 0 📌 2

The reVISit team will be hosting an open hackathon at TU Graz in Austria, immediately after IEEE VIS from Monday November 10 to Wednesday November 13. Anyone interested in contributing to reVISit is invited to participate!
10.09.2025 18:43 — 👍 3 🔁 1 💬 1 📌 0
@hrbrmstr.dev thanks for the ping!
@erickapitanski.bsky.social very cool project (poking around now) -- I'll be in CA in a few weeks to advise student projects, would be happy to swing by if doable
02.09.2025 14:28 — 👍 0 🔁 0 💬 0 📌 0

dithered hypercard-style picture of a winged all-seeing eye being orbited by bar charts with cross error bars, flanked by discrete gaussian distributions
spent a chunk of today making biblically accurate error bars
31.07.2025 23:41 — 👍 8 🔁 2 💬 1 📌 0
Super love seeing regional datavis events making a comeback (and happy to be in town!) ->
22.07.2025 02:20 — 👍 1 🔁 0 💬 0 📌 0
So modest! Had an AVD-inspired hour+ long convo just the other week 😁
04.07.2025 18:04 — 👍 3 🔁 0 💬 0 📌 0
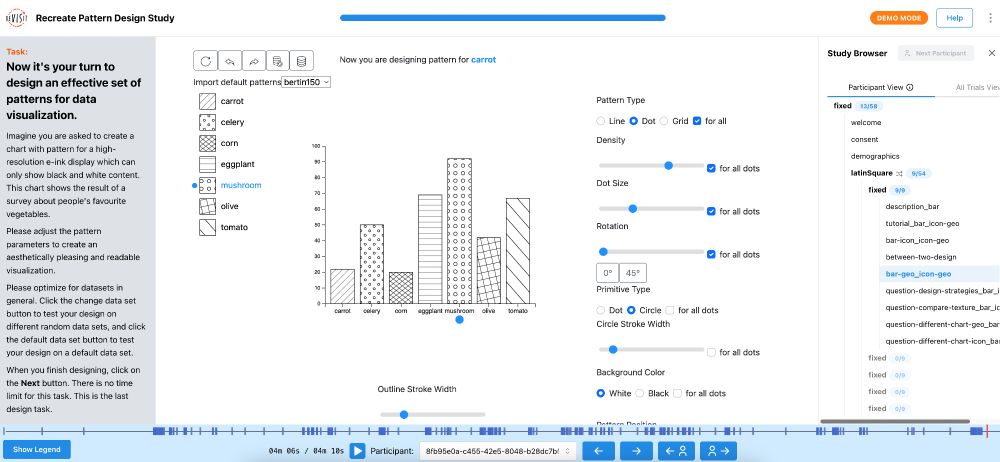
A screenshot of the reVISit interface showing the answers and provenance from a participant who completed the question. The study shown is a replication of He et al.’s pattern design study.
Going to #CHI2025 in Japan? Interested in running user studies?
Sign up for our virtual CHI 2025 course that teaches you how to use reVISit, a new, open-source user study tool reducing the tedium of study design. Come learn through some practical examples.
cvent.me/g5mx2w
revisit.dev
11.04.2025 14:02 — 👍 6 🔁 3 💬 2 📌 0
A new way to make graphs more accessible to blind and low-vision readers
Designed to help blind and low-vision readers understand graphics, the “Tactile Vega-Lite” system from MIT CSAIL converts data into a standard visual graph and a tactile chart. Accessibility standards...
Tactile charts are an important tool for conveying data to blind and low vision people via embossed paper. However, tactile charts require high levels of time and expertise to design.
Introducing Tactile Vega-Lite, new work at #CHI2025 led by MIT SM student Katie Chen
news.mit.edu/2025/making-...
31.03.2025 18:49 — 👍 33 🔁 15 💬 2 📌 0
behold the CONNECTED SPLATTERPIE
kneel before my works, ye mighty, and despair
30.03.2025 21:00 — 👍 397 🔁 69 💬 35 📌 23
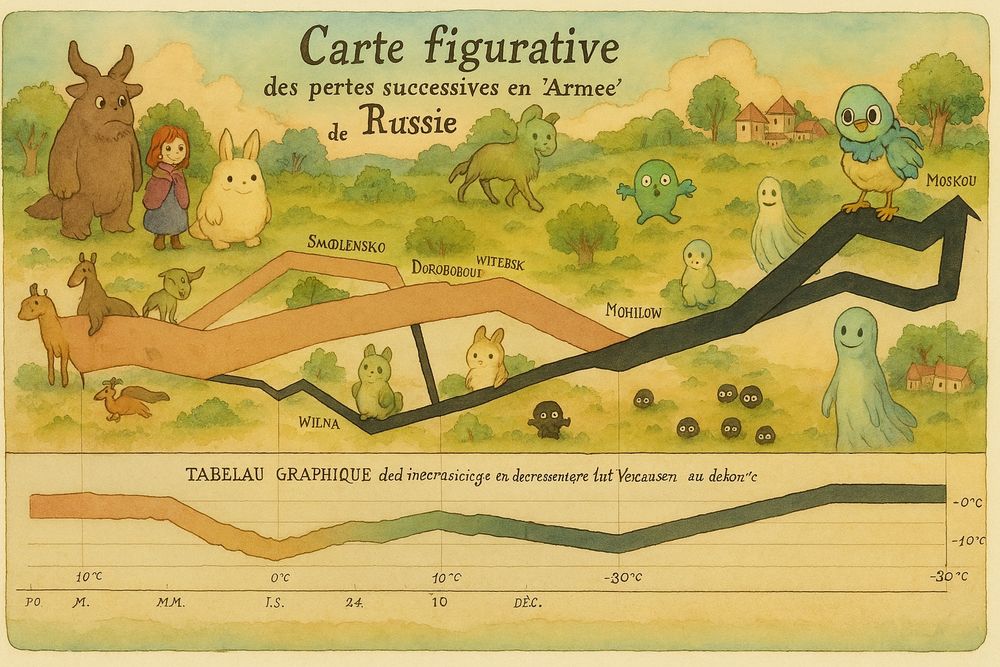
AI-generated parody of Minard‘s famous visualization of Napoleon‘s march to Moscow, embellished with all kinds of Studio Ghibli-inspired characters
The future of #datavis
28.03.2025 11:56 — 👍 20 🔁 11 💬 0 📌 3
1) Cool VIS study, 2) Help our replication effort! ->
19.03.2025 14:13 — 👍 0 🔁 2 💬 0 📌 0
Also curious about what might be driving this. Are folks with less experience diving into more complex tool ecosystems thanks to AI? Kind of what @mjskay.com was getting at... 🤔
Pre-AI, maybe folks learned better norms for asking for help, etc. over time?
07.03.2025 17:33 — 👍 1 🔁 0 💬 1 📌 0
design constraints good
22.02.2025 13:26 — 👍 2 🔁 0 💬 0 📌 0
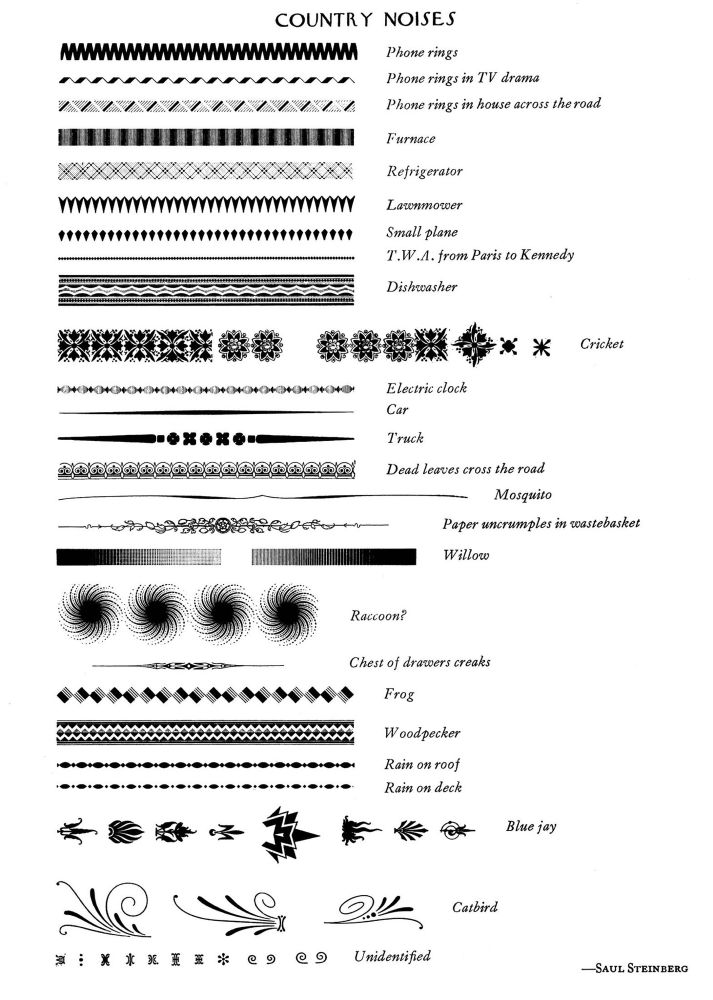
A chart of country noises (lawnmower, rain on roof, frog, mosquito and more) presented to look like sound waves whereas they are more like ornamental border patterns - especially like old letterpress and printing pieces. This is probably what was used for them.
Country Noises.
(Saul Steinberg, 1979)
saulsteinbergfoundation.org
21.02.2025 17:54 — 👍 227 🔁 58 💬 2 📌 3
There be dragons: dataviz in the industry
I started being serious about data visualization around 2005, when the field was still pretty niche and people like Martin Wattenberg, Ben…
"…there’s one nut we have not been able to crack: anchoring bespoke data visualization as a full fledged profession in corporate settings."
Re-reading this article from 2017 (medium.com/visualizing-...), I wonder — where are we at 8 years on?
14.02.2025 11:11 — 👍 30 🔁 9 💬 6 📌 0
Slightly annoying when a paper describing an experiment doesn't include a screenshot of the actual task participants performed.
(I wrote the paper in question 🫠...)
13.02.2025 19:05 — 👍 0 🔁 0 💬 0 📌 0
Cool possibilities for interaction studies ->
10.02.2025 17:26 — 👍 0 🔁 0 💬 0 📌 0
This ggplot chart was generated without any theming support, *at all*.
08.02.2025 16:54 — 👍 24 🔁 5 💬 2 📌 3
Any freelance Svelte/data visualization developers among my followers? Looking for someone with some availability, starting in a couple of months
03.02.2025 12:53 — 👍 23 🔁 17 💬 9 📌 0
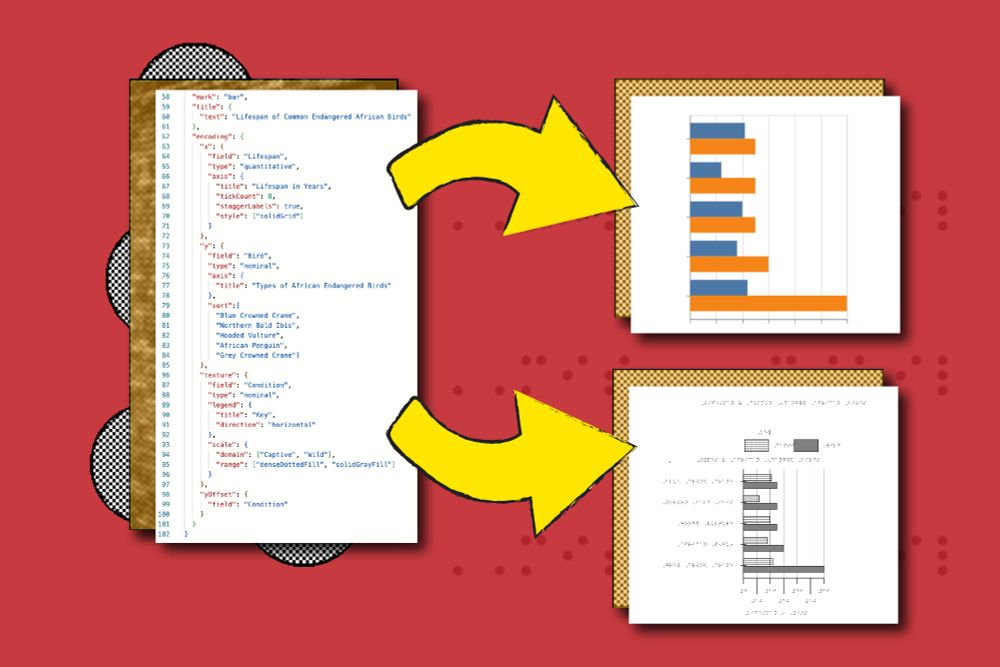
🛫 You can pilot and iterate on the experiment instantly from within a notebook environment.
📈 You can even test data collection and prototype your analyses in the same notebook!
31.01.2025 18:18 — 👍 1 🔁 0 💬 1 📌 0
ReVISit 2.0 (revisit.dev) reached several exciting milestones recently:
📁 You can now define an entire experiment in a single file— from trial data, stimuli (visualizations and interactions, thanks to Vega-Altair), study blocks/sequences and randomization, questionnaires, etc.
31.01.2025 18:18 — 👍 4 🔁 3 💬 1 📌 0
Crowdsourced Think-aloud Studies w/ full interaction provenance+rehydration, auto voice transcription, and correlation between timelines.
That plus a pile of new features and capabilities in the reVISit 2.0 release.
Check it out & let us know what you think!
23.01.2025 16:45 — 👍 3 🔁 1 💬 0 📌 0
More LLM reflections
I think a useful model is "everything that in-house counsel is not"
In-house counsel doesn't know how to say yes to you; they're entirely made of blood-soaked wisdom.
LLMs are excitable improv comedy partners with more memory than wisdom; they don't know how to say no to you.
18.01.2025 16:32 — 👍 43 🔁 8 💬 3 📌 0
Still buzzing about the progress the team has made on reVISit over this workshop.
Looking forward to sharing new features for creating & instrumenting vis experiments in our upcoming 2.0 release 👀
15.01.2025 22:00 — 👍 6 🔁 1 💬 0 📌 0
does anybody have pointers for good papers/blog posts (other than @tamara process&pitfalls + dsm papers, which we [gratefully!] use already) on "how to teach people to write academic hci/vis research papers that don't suck"?
14.01.2025 17:51 — 👍 1 🔁 1 💬 0 📌 0
(why was this the best show?!)
10.01.2025 18:43 — 👍 1 🔁 0 💬 1 📌 0
Researching data visualization @Utah and @SCI
Sr. Research Software Engineer @uusci.bsky.social
A space to connect and create with data.
🎉 India’s first data viz conference | 📍 June 27-28 in Bengaluru | 🐣 Early bird tickets are live
Get your tickets here: https://hasgeek.com/VizChitra/2025/#tickets
Expressive probabilistic programming language for writing statistical models. Fast Bayesian inference. Interfaces for Python, Julia, R, and the Unix shell. A rich ecosystem of tools for validation and visualization.
Home https://mc-stan.org/
LightScope! Free, open source threat intelligence. https://lightscope.isi.edu University of Southern California Information Sciences Institute.
Professor of Interactive Computing at Georgia Tech, visualization researcher, Atlanta sports fan, and not-frequent-enough golfer
Data vis researcher and teacher at Davidson College
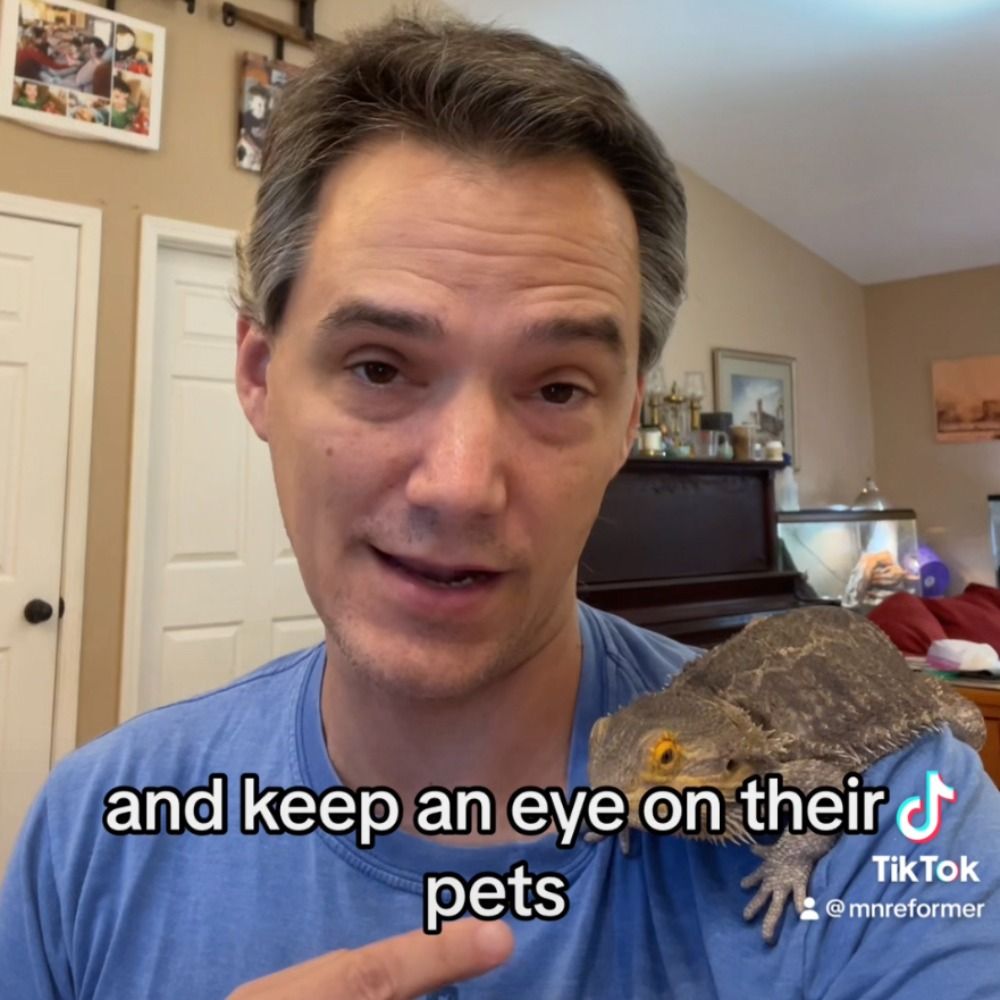
Writing stuff in upstate New York. Formerly: Minnesota Reformer, Washington Post, Brookings, Pew. Orange cat evangelist. Ask me about my swamp.
A Mathematician dabbling in Data Science, especially unsupervised learning and data exploration. UMAP, HDBSCAN, PyNNDescent, DataMapPlot. (He/Him)
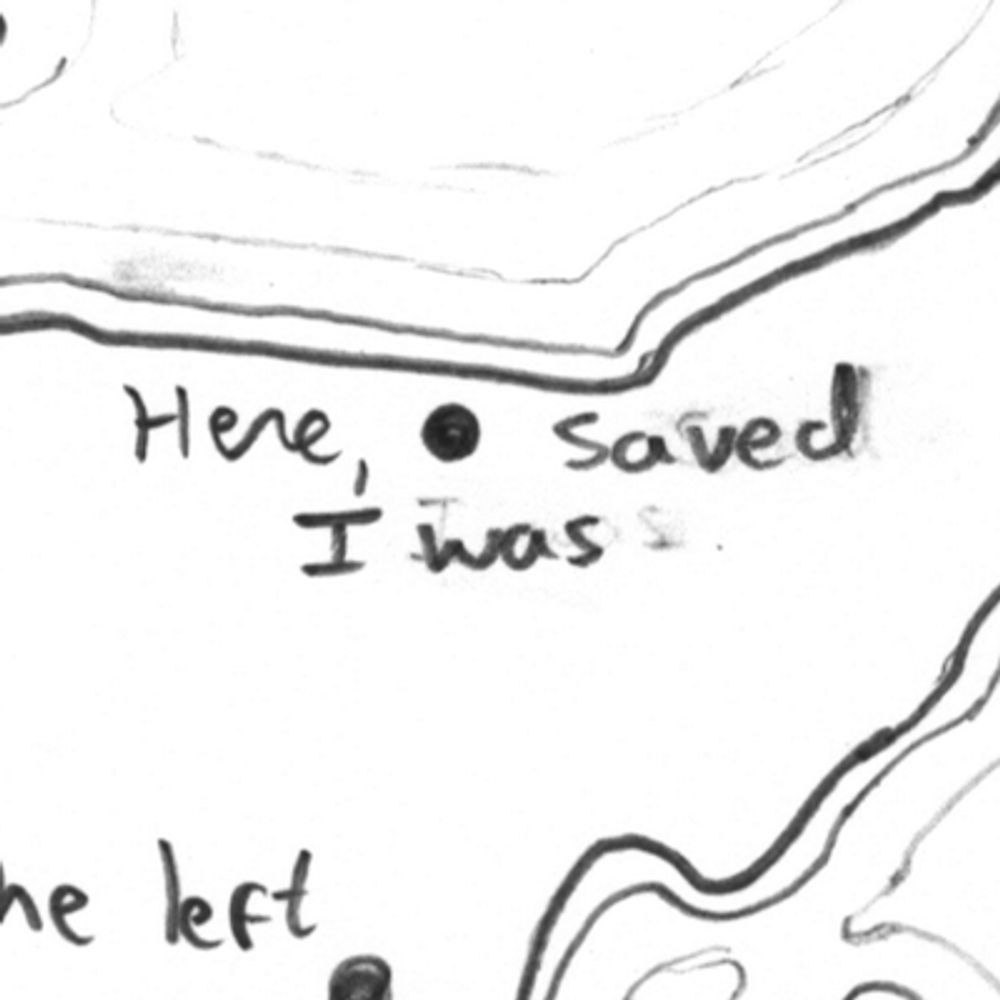
An arboreal, poly, gender non-participant mapmaker.
• Portfolio & tutorials: somethingaboutmaps.com.
• Prints: https://somethingaboutmaps.com/Storefront
• You can support my art & teaching at http://patreon.com/pinakographos.
Making government data make sense. No partisanship, no bias — just facts as clear as blue skies.
🔗: usafacts.org
Personality psych & causal inference @UniLeipzig. I like all things science, beer, & puns. Even better when combined! Part of http://the100.ci, http://openscience-leipzig.org
Assistant professor at Georgia State University, formerly at BYU. 6 kids. Study NGOs, human rights, #PublicPolicy, #Nonprofits, #Dataviz, #CausalInference.
#rstats forever.
andrewheiss.com
Signal: andrewheiss.01
information science prof at cu boulder
https://jonathanzong.com/
https://www.data-and-design.org
@data-and-design.org
Clinical psychology researcher | applied statistics geek | so called #RStats influencer
Putting science on the map at Woodwell Climate Research Center | Cartographer | Analyst | Senior Research Associate | Fly fisher | located in Woods Hole, MA, USA
Associate Professor at University of Chicago, Computer Science. Runs the Human-Computer Integration Lab (https://lab.plopes.org) & also a musician.
Principal Engineer at Confluent. Ex-Noteable, Apple, Netflix, Stanford. I write sometimes and talk too much.