Yup, detailed at the bottom of this blog from last year
blog.gridstatus.io/caiso-batter...
29.07.2025 00:29 — 👍 4 🔁 0 💬 0 📌 1
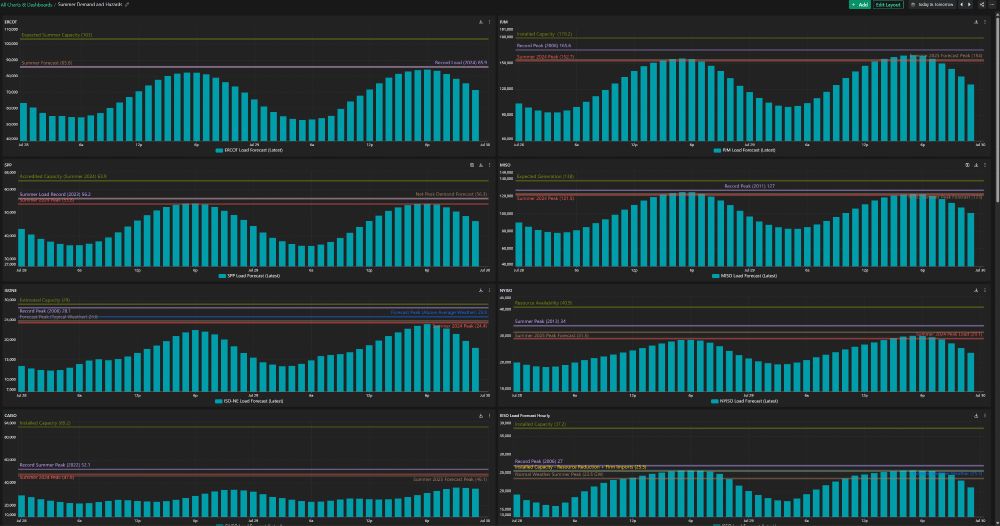
bar charts with load forecasts and demand records across markets
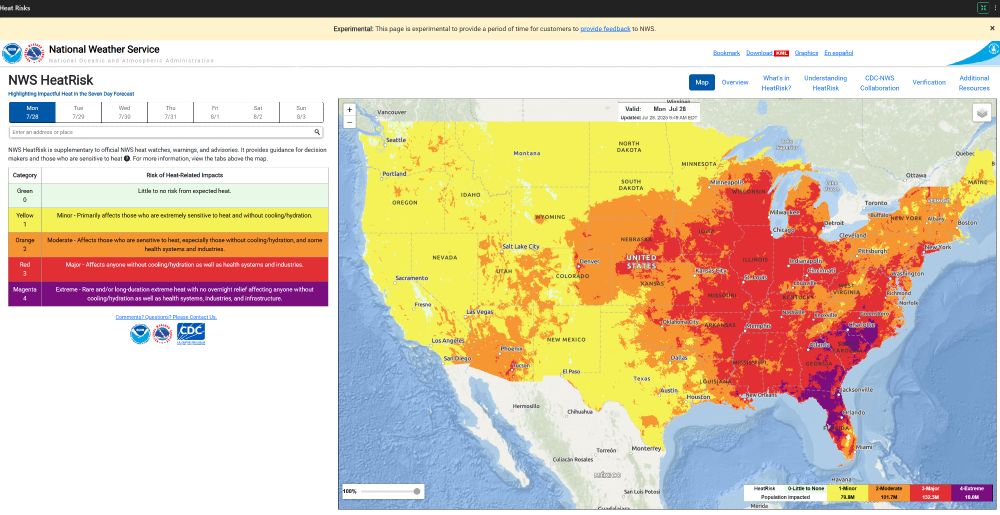
NOAA's HeatRisk map, hot in the east
Another hot week across the eastern interconnection 🔌💡
~5 markets look to beat last summer's peak, while 3 seem likely to exceed this summer's forecast peak
You can track the outlook on our summer hazards dashboard: www.gridstatus.io/dashboards/e...
28.07.2025 14:35 — 👍 4 🔁 1 💬 0 📌 0
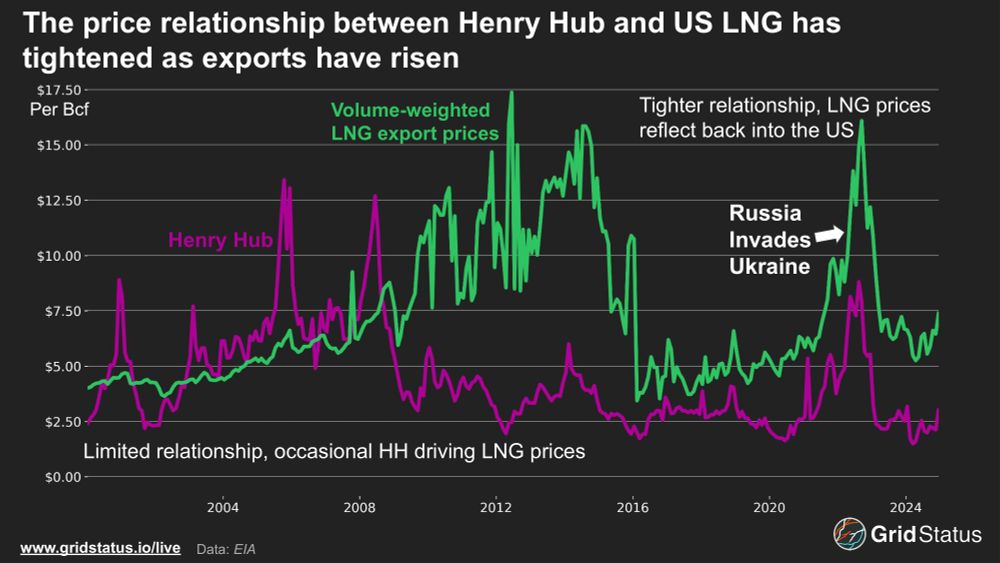
HH and LNG prices over time
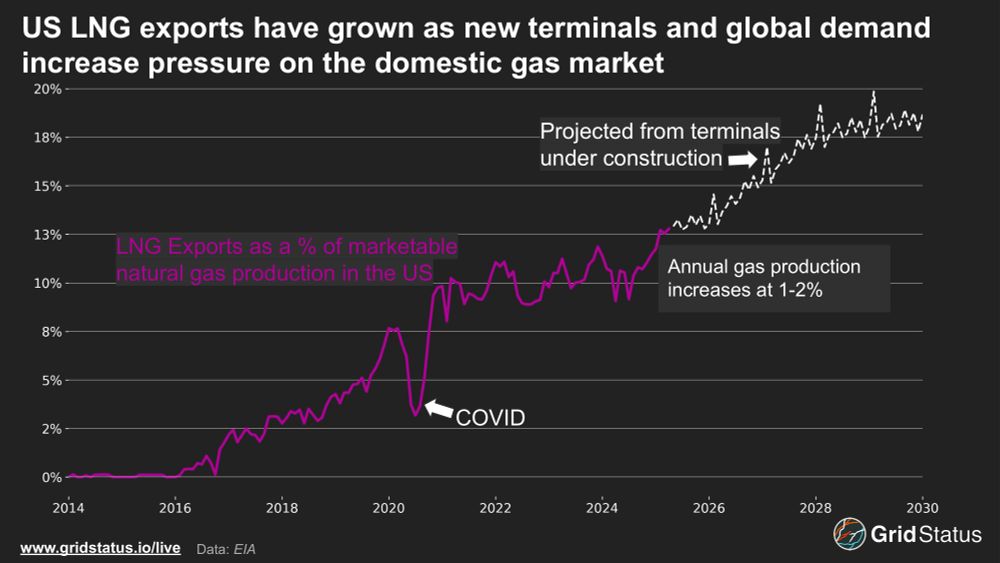
LNG exports as a share of marketable gas
Beyond turbine supply, the future of gas is not all bright as domestic prices have exposure to global price shocks via LNG exports, which are set to resume growth and continue becoming a greater share of US gas production
tighter supply and increased volatility, another ratepayer stressor
25.07.2025 13:00 — 👍 5 🔁 2 💬 1 📌 1
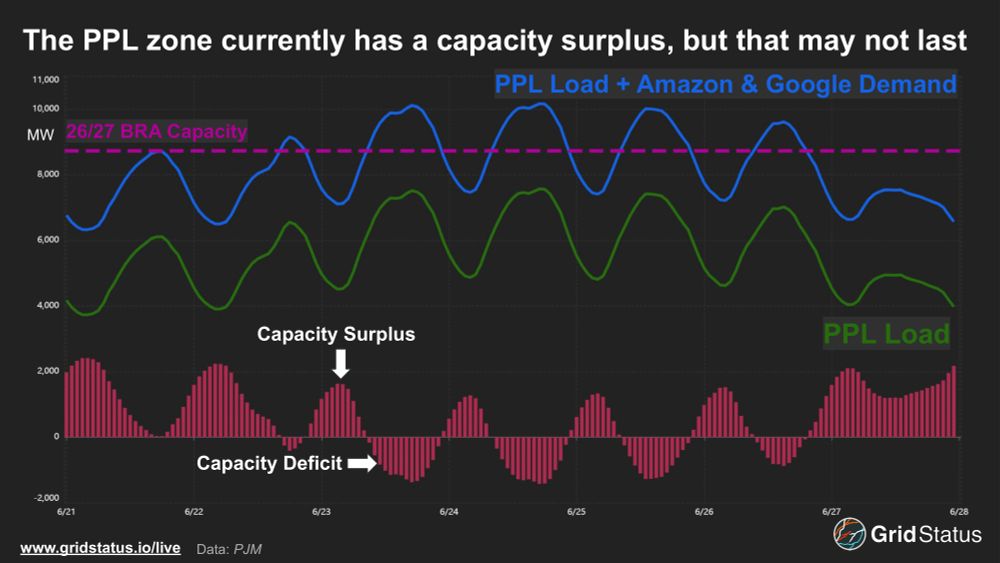
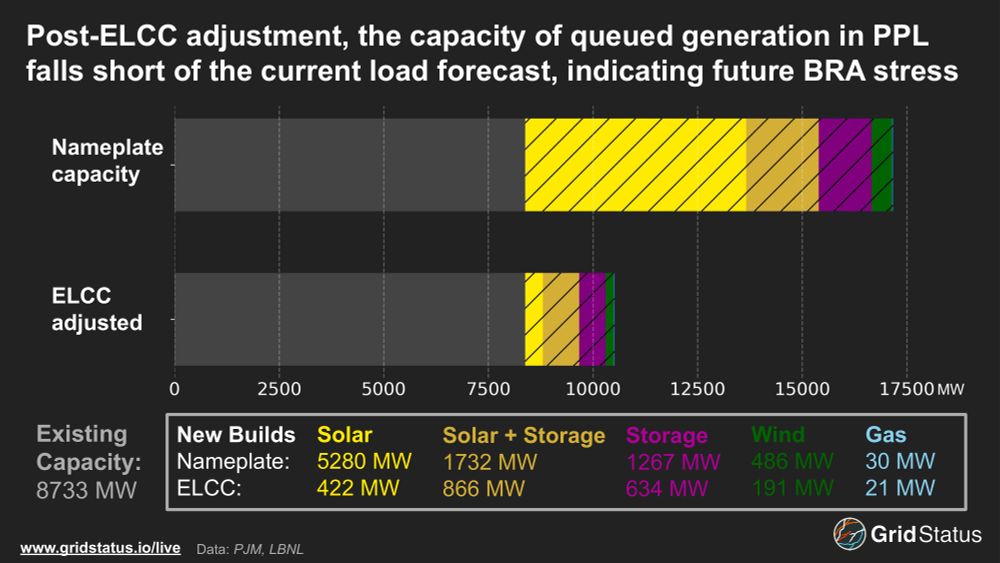
PPL demand, demand + Google and Amazon, capacity deficit
Adding in new Amazon and Google demand to the zone shows that PPL demand would have regularly exceeded internal generating capacity during the June heatwave
25.07.2025 13:00 — 👍 2 🔁 1 💬 1 📌 0
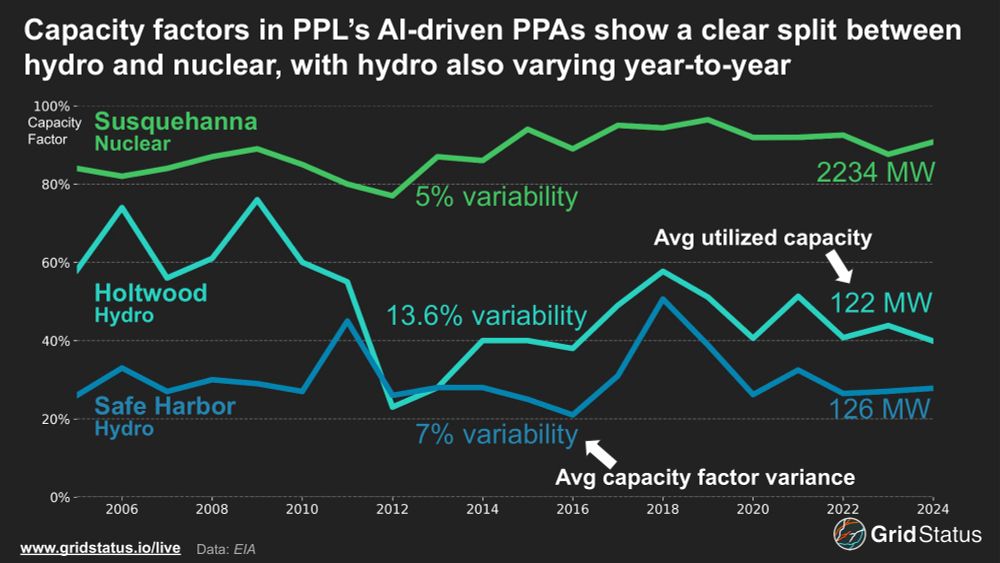
capacity factors for holtwood, safe harbor, and susquehanna
Google and Brookfield announced a 670 MW deal for two hydro plants in PPL, but even at their peak output over the last 20 years their actual output was far lower than 100%
coupled with legacy capacity carveouts to serve Amtrak's 25Hz system, it's unclear what the real terms of this deal are
25.07.2025 13:00 — 👍 1 🔁 0 💬 1 📌 0
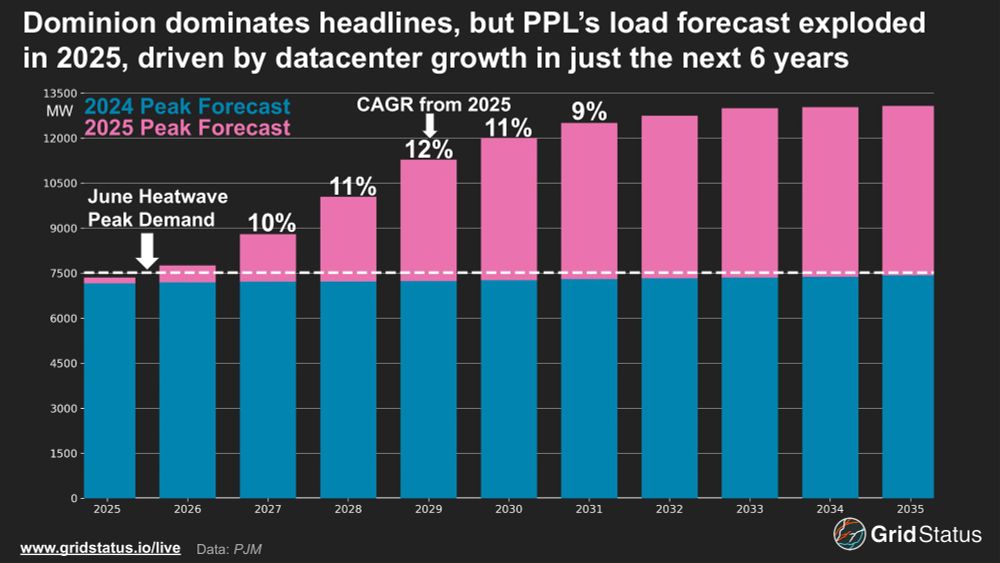
bar chart showing what the post says
PPL demand went from essentially flat in the 2024 load forecast to 70% growth in 6 years in the 2025 forecast.
Despite that, the 2025 report still under-forecast peak demand for this summer, as assumed growth doesn't really come online until next year.
25.07.2025 13:00 — 👍 1 🔁 0 💬 1 📌 0
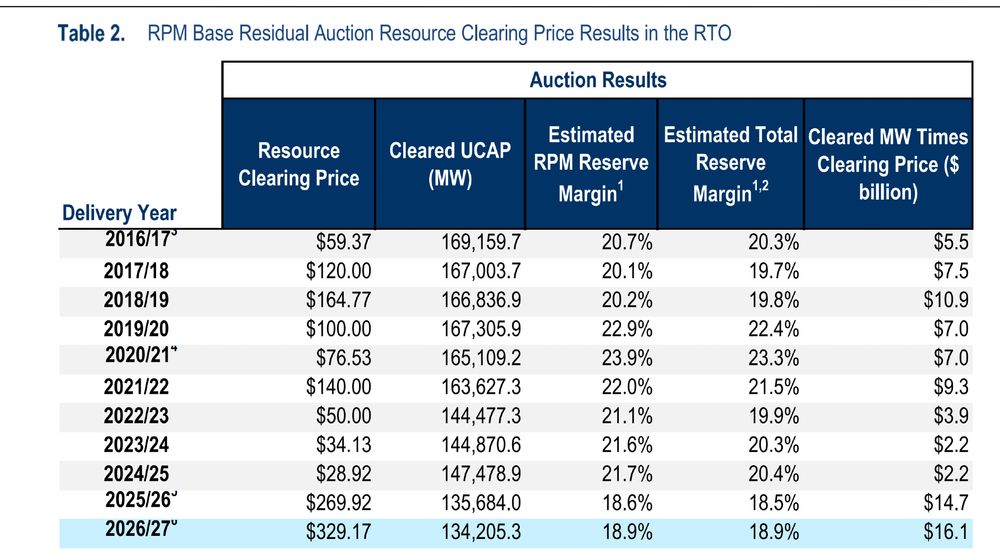
PJM’s 2026/27 BRA cleared at the market cap across the entire RTO,
signaling no end to Big Tech’s insatiable demand for datacenter power
Look for a blog from us later this week on recent PPA action in PPL and PJM's tight capacity conditions. 🔌💡
22.07.2025 21:28 — 👍 1 🔁 1 💬 0 📌 0
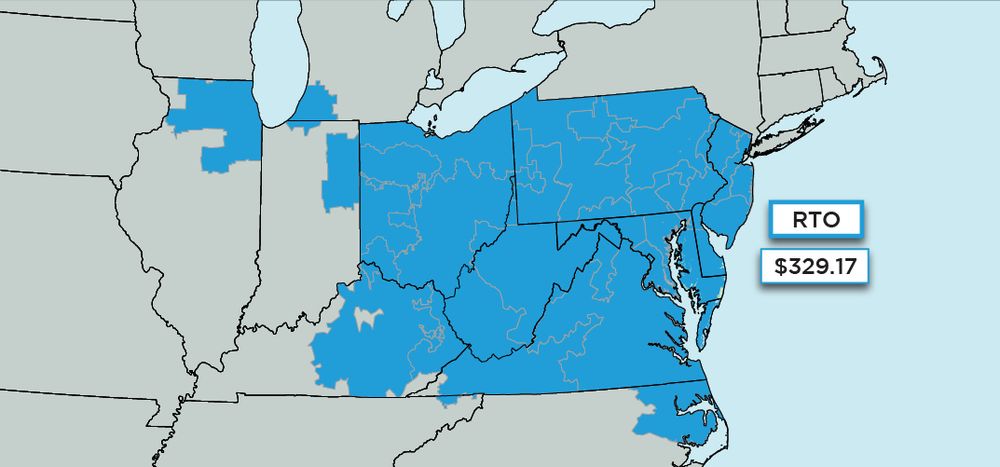
ayyy DOM prices are lower in the 26/27 BRA than last year's auction!
oh, wait, the entire RTO cleared at the cap 🥴
funny map from PJM 🔌💡
22.07.2025 20:28 — 👍 13 🔁 2 💬 2 📌 2
These deals come at an already challenging time for PJM. While PPL cleared ~8.6 GW in the recent 2025/2026 Base Residual Auction (BRA) and only hit a peak load of 7.6 GW during late June’s record-breaking heat wave, these PPAs tie into existing generation, exacerbating PJM’s growing supply imbalance and cutting into supply.
Many saw the 25/26 BRA as a flashing alarm that the balance between supply and demand was tightening fast. PJM has faced tens of GWs in generation retirements while load growth, driven by data centers in Dominion, has taken off. Capacity prices hit record highs, driving double-digit rate hikes and even prompting some states to threaten to leave PJM entirely.
At the same time, generation buildouts have lagged. The RTO’s now-infamous interconnection freeze slowed generation additions, and the bulk of new capacity has been intermittent renewables without storage. Queue reforms are expected to accelerate new additions relative to the status quo, but starting from a low point means there is a long way to go.
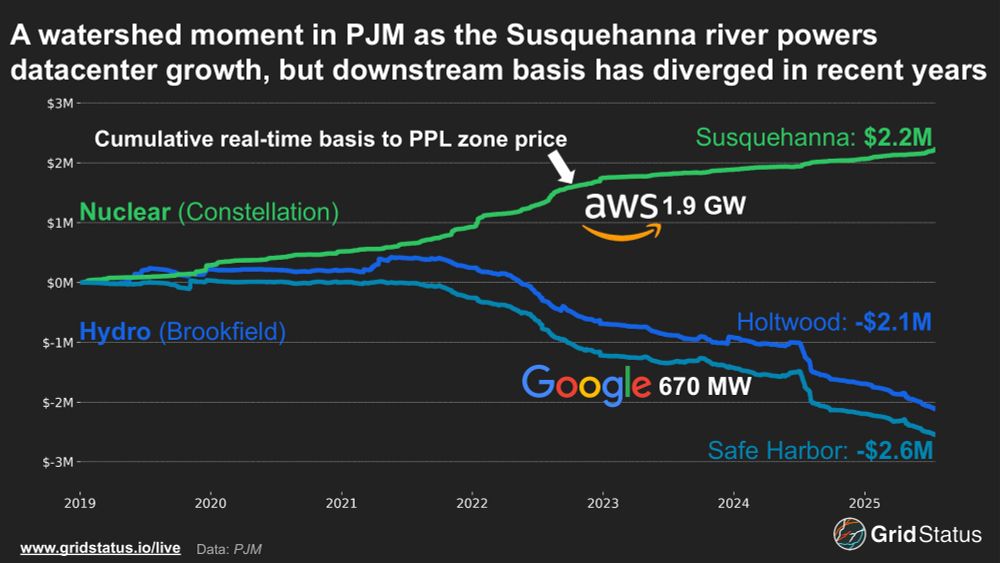
While all three plants may rely on the Susquehanna River, their real-time basis exposure has diverged sharply in recent years. Unlike new plants relying on modeling to provide benchmarks, these facilities have decades of operation to inform the contours of a PPA. As tech companies ramp up power consumption, they have become savvy buyers, likely factoring in basis hedges while at the same time paying a premium for firm, clean power when it is increasingly hard to come by.
Google’s 670 MW hydroelectric PPA with existing Brookfield hydropower in PJM is a sign of the times.
Also in the PPL zone, Amazon’s attempt to take Talen’s Susquehanna nuclear plant behind-the-meter has been in the news since last year
Over 2.5 GW of data center PPAs signed in a single zone
🔌💡
17.07.2025 14:09 — 👍 4 🔁 2 💬 0 📌 1

During the June heatwave, behind-the-meter solar in New England shifted peak demand by 2 hours and nearly 3 GW. Without BTM solar, ISO-NE may have broken its nearly 20 year-old demand record, challenging assumptions about load growth in the region.
Stephen King’s foreboding New England is not the first place you’d think of as a leader in solar generation, but the region’s heavy concentration of behind the meter (BTM) solar was able to meet nearly 6 GW of load over the afternoon of June 24th while utility scale solar produced only 750 MW.
Even during the shifted evening peak, BTM is estimated to have reduced hourly load by over 800 MW. BTM helped keep prices under control during solar hours, shifting volatility to the evening net load peak when expensive oil generators ramped up to meet ~3.5 GW of load.
While BTM solar had a notable impact during the heatwave, it was nowhere to be found during this year’s winter peak. On January 21st, load peaked after sunset, meaning BTM systems were unable to offset demand. The lack of BTM generation coincides with operational challenges from pipeline constraints during the winter as gas is utilized for direct heating.
ISO-NE is currently a summer peaking region, but heating and transportation electrification is expected to shift the peak to winter in the 2030s. The adoption of these technologies has been slower than expected, leading to weaker load forecasts in recent years. Despite BTM’s growing role in shaping summer demand, the transition to a winter-peaking region without distributed battery adoption alongside BTM solar presents new challenges.
While the heatwave at the end of June certainly drove attention, summer is not over yet, and factoring BTM solar into decision-making is increasingly important. Track this, along with wider grid dynamics, with our live pages for New England and beyond.
During the June heatwave, behind-the-meter solar in New England shifted peak demand by 2 hours and nearly 3 GW. Without BTM solar, ISO-NE may have broken its nearly 20 year-old demand record, challenging assumptions about load growth in the region.
🔌💡
08.07.2025 13:10 — 👍 16 🔁 5 💬 0 📌 0
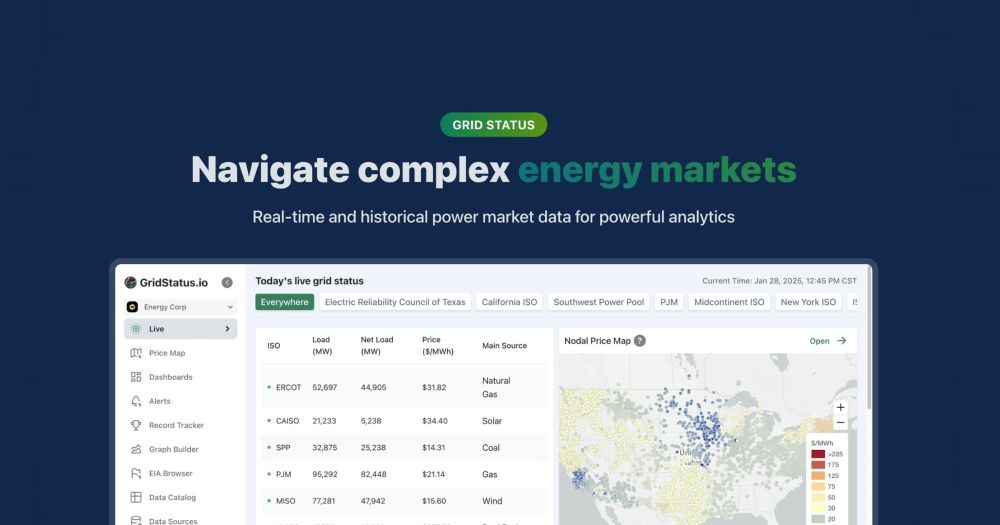
Home | Grid Status
National overview of the US Electrical Grid conditions. Includes data from ERCOT, CAISO, PJM, SPP, MISO, ISO-NE, and NYISO
We’ll be tracking developments closely on our live pages and using our new Forecast Analysis app to monitor how projections evolve in real time
www.gridstatus.io/live
23.06.2025 15:22 — 👍 1 🔁 0 💬 0 📌 0
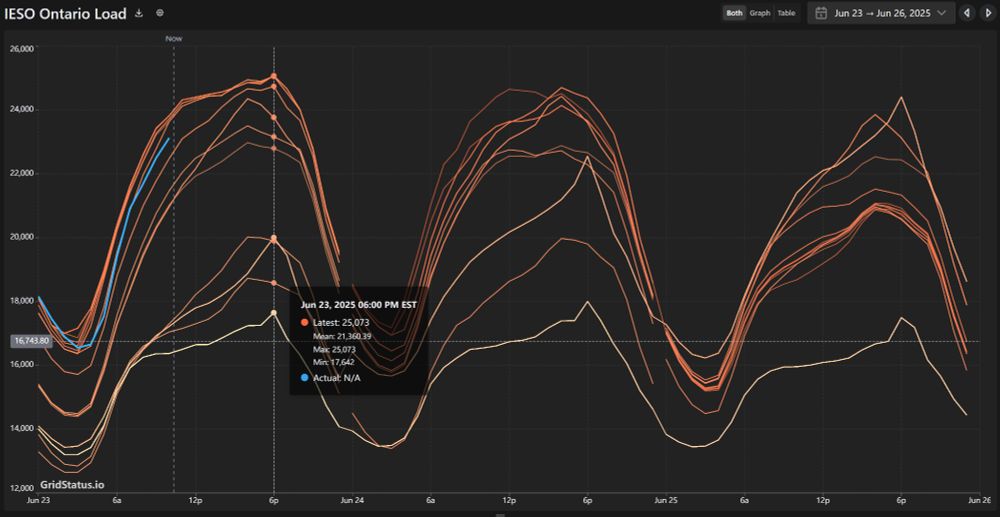
In Canada, Independent Electricity System Operator (IESO)'s latest forecast exceeds 25 GW, 1.5 GW above the normal summer peak, and approaching their 25.7 GW extreme summer benchmark. Well within their installed capacity, Ontario is also able to lean on its winter-peaking neighbor, Québec
23.06.2025 15:22 — 👍 0 🔁 0 💬 1 📌 0
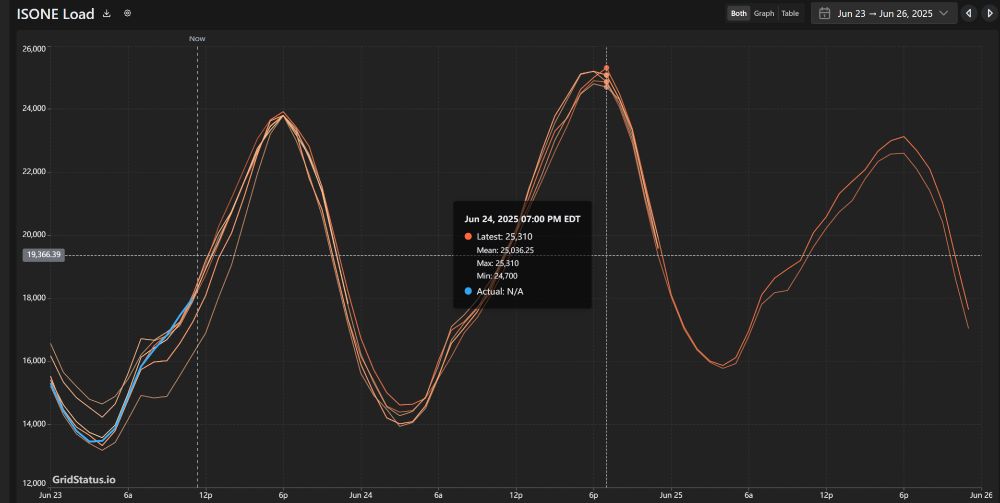
ISO-NE is expected to see load peak at 25.3 GW on Tuesday evening. While the ISO estimates that BTM solar may shave up to 1,700 MW off the peak itself, the retirement of Mystic last year and stalled offshore wind projects add challenges to a system already strained by gas pipeline limitations.
23.06.2025 15:22 — 👍 0 🔁 0 💬 1 📌 0

NYISO is anticipated its highest load since July 2022.
Upgrades to the Central East Interface help reduce intrastate congestion, but >600 MWs of downstate peakers retired in the intervening years, so limited thermal generation in Zone J and high temps in all neighboring BA’s will complicate ops
23.06.2025 15:22 — 👍 0 🔁 0 💬 1 📌 0
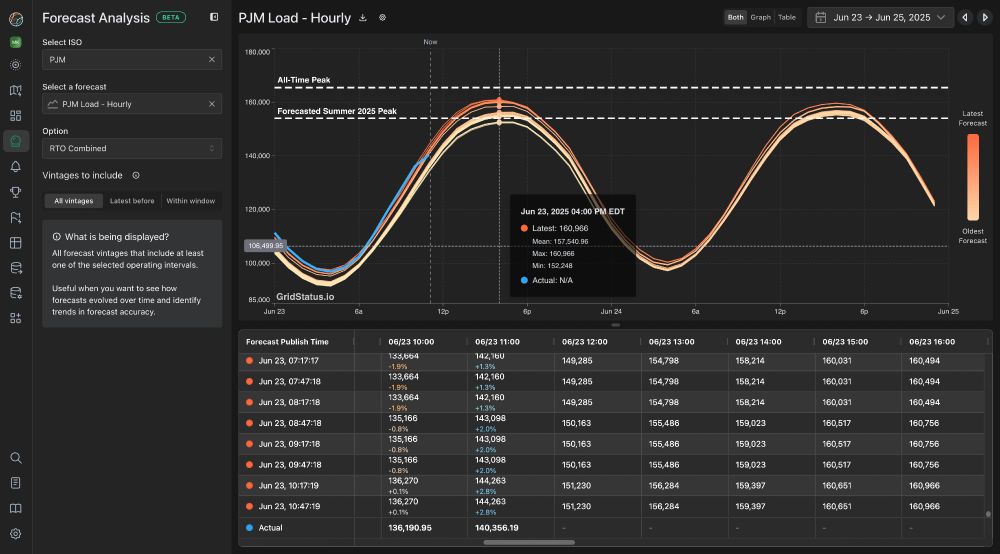
PJM forecast some of the highest demand in over a decade and record-breaking peaks in zones like Dominion. Since last year, PJM has had a net loss of 800 MW of thermal generation capacity. Solar generation has grown, but PJM does not have the storage to shift it into a steeper net load peak
23.06.2025 15:22 — 👍 1 🔁 0 💬 1 📌 0

This week, a historic early-season heat wave means grids across the Eastern US and Canada will face record demand 🔌💡
With triple-digit heat indices from the Gulf of Maine to the Gulf of Mexico, here’s what we expect to see across the different grid operators this week:
23.06.2025 15:22 — 👍 8 🔁 3 💬 1 📌 0
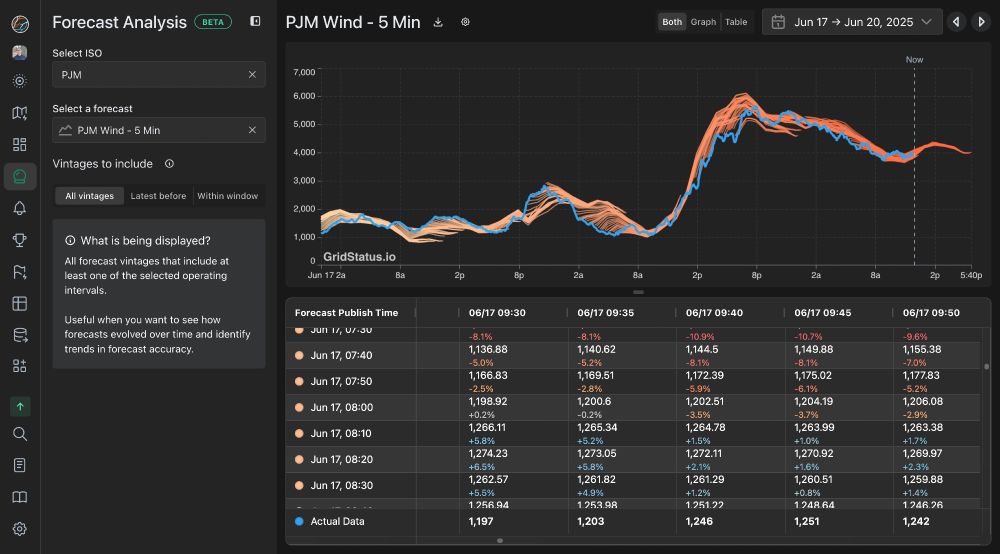
wind forecasts and actual in PJM
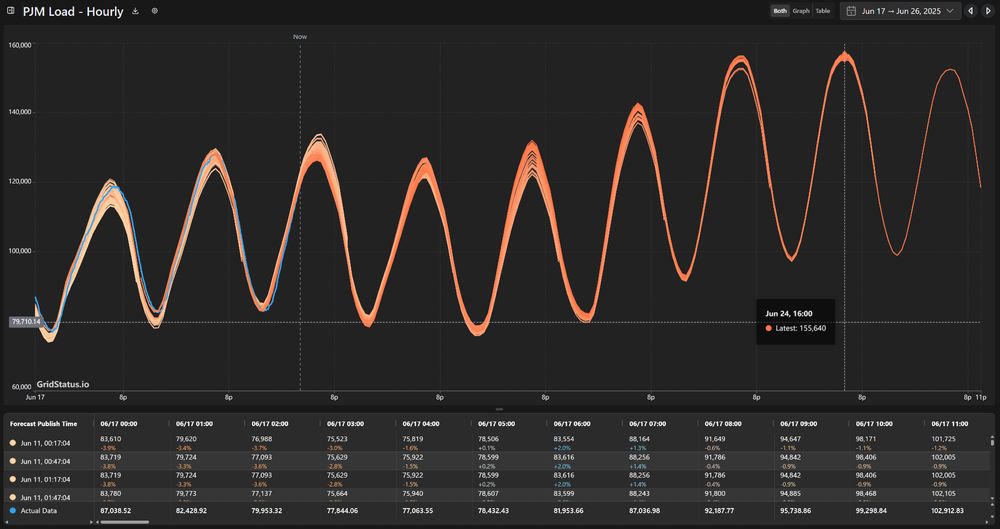
pjm load forecasts going out to next week
We’re about to release a new Forecast Analysis app, and we're looking for users to test it out!
If you have experience analyzing forecasts or enjoy beta testing new data tools, comment or shoot us a DM for the link 🔌💡
we've been using it to watch PJM's load forecasts for the heatwave next week
19.06.2025 16:12 — 👍 5 🔁 4 💬 1 📌 0
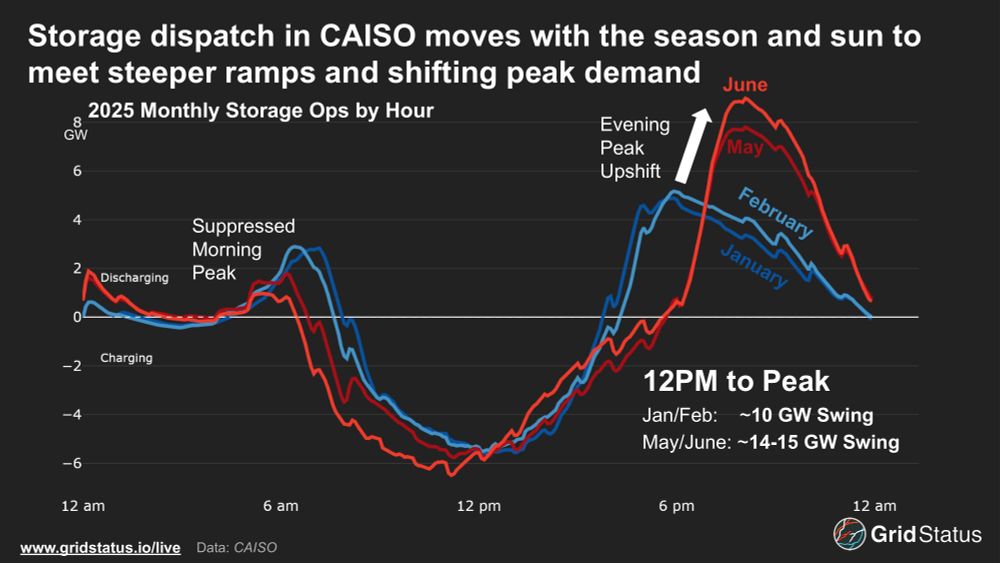
This week, CAISO broke its battery discharge record 2x, jumping more than 800 MW 🔌💡
As the battery fleet has grown, the seasonal operations shift has become more pronounced. From winter into summer, the morning discharge peak declines and the evening peak shifts later with a steeper ramps
19.06.2025 14:17 — 👍 27 🔁 7 💬 1 📌 1
Grid Status
Comprehensive data and tools for understanding the US Electric Grid
We’ve got a new blog on 4CP outcomes and interactions coming later in the week, but for now you can track the estimated peaks in real time with our public June dashboard
www.gridstatus.io/dashboards/e...
17.06.2025 14:06 — 👍 1 🔁 0 💬 0 📌 0
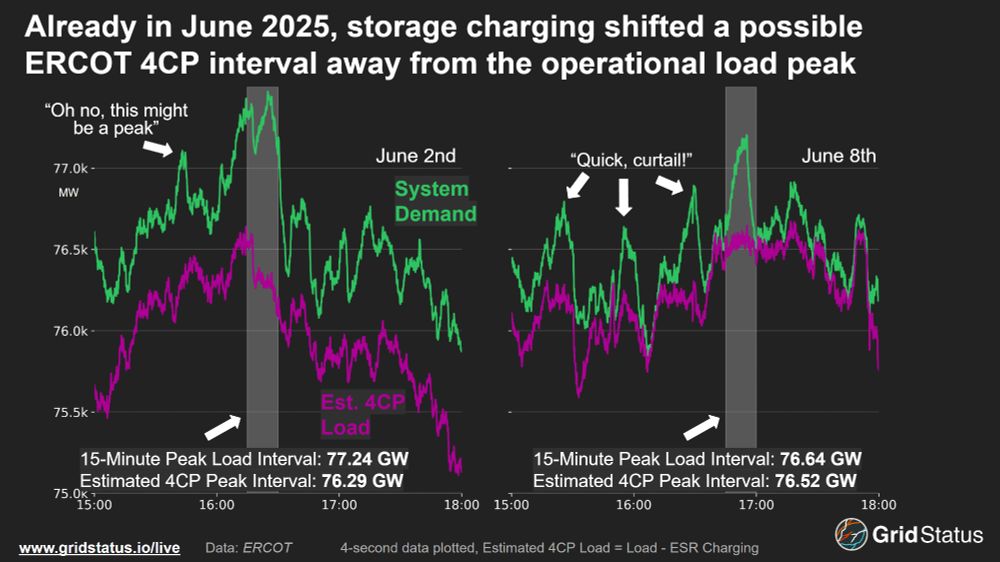
ERCOT's 4CP season is in full swing with systemwide load set to push into the high 70 GWs this week 🔌💡
Already batteries shifted a peak interval as the 6/2 max is lower than 6/8's once storage load is factored in
June 8th was a Sunday, showing that with growing demand, peaks can happen on any day
17.06.2025 14:06 — 👍 2 🔁 1 💬 1 📌 1
This growth previews more records and volatile congestion in the coming months and lays bare the potential for threats to grid stability like last summer’s near miss
Since 2019, off-peak load has grown by 4 GW, reflecting the 24/7 power needs of most traditional data center operators
11.06.2025 14:24 — 👍 2 🔁 0 💬 0 📌 0
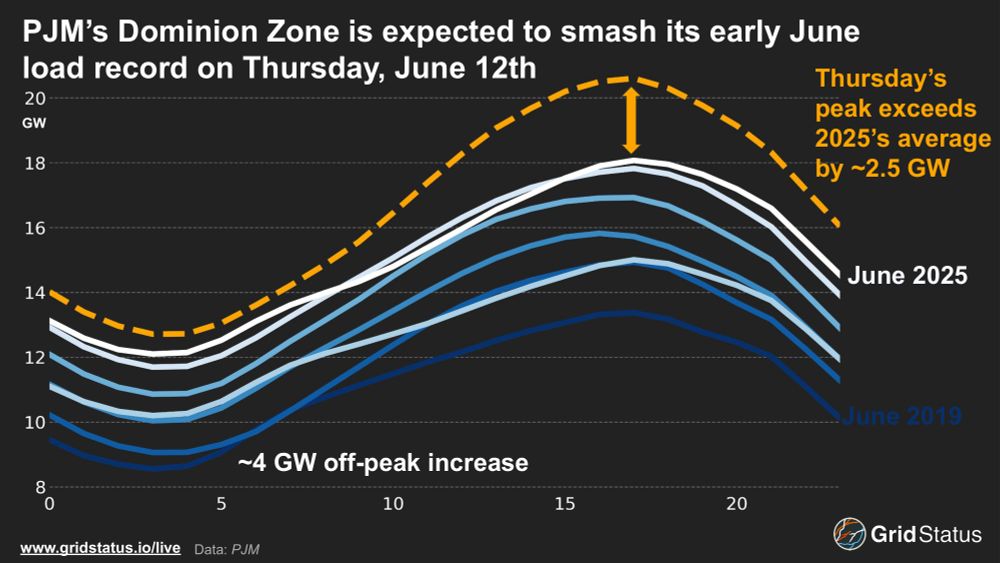
Tomorrow, Dominion, the epicenter of data center load growth in the US, is forecasted to smash its previous early-June load record by almost 2 GW.
Already in 2025, the zone set a new all-time demand record, reaching 24.6 GW on the morning of January 23rd. Now, before even reaching the solstice, demand is projected to surpass the peak of 2022’s entire summer. This continued growth indicates we may be in store for more record demand and volatile congestion in the coming months and lays bare the potential for threats to grid stability like last summer’s near miss.
With temperatures expected to surge into the 90s across Virginia, PJM’s latest forecast has Dominion exceeding 21 GW across the midafternoon, peaking over 21.4 GW during HE 18.
Dominion’s rapid load growth, fueled by hyperscale data center developments in Northern Virginia, is even clearer during the off-peak. Since 2019, off-peak load has grown by 4 GW, reflecting the 24/7 power needs of most traditional data center operators.
Follow the latest forecasts and real-time updates on our PJM live page and stay tuned for more coverage of major summer load events and trends across the US and Canada.
Tomorrow, Dominion, the epicenter of data center load growth in the US, is forecasted to smash its previous early-June load record by almost 2 GW.
Already in 2025 the zone set a new all-time record, reaching 24.6 GW in January. This forecast peak would surpass the peak of 2022’s entire summer 🔌💡
11.06.2025 14:23 — 👍 8 🔁 1 💬 1 📌 1
And here's the whole blog! 🔌💡
blog.gridstatus.io/caiso-solar-...
04.06.2025 20:13 — 👍 10 🔁 5 💬 0 📌 2
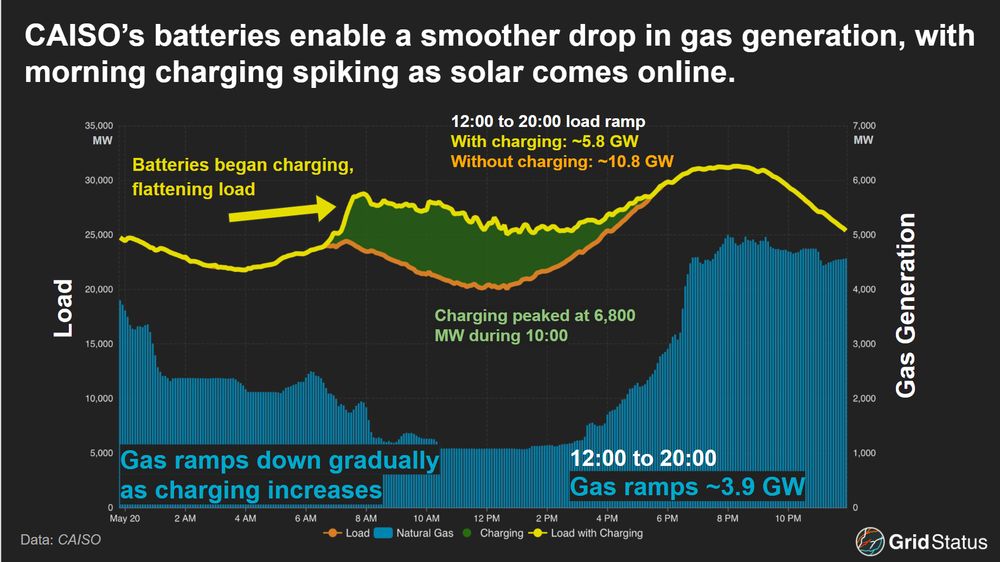
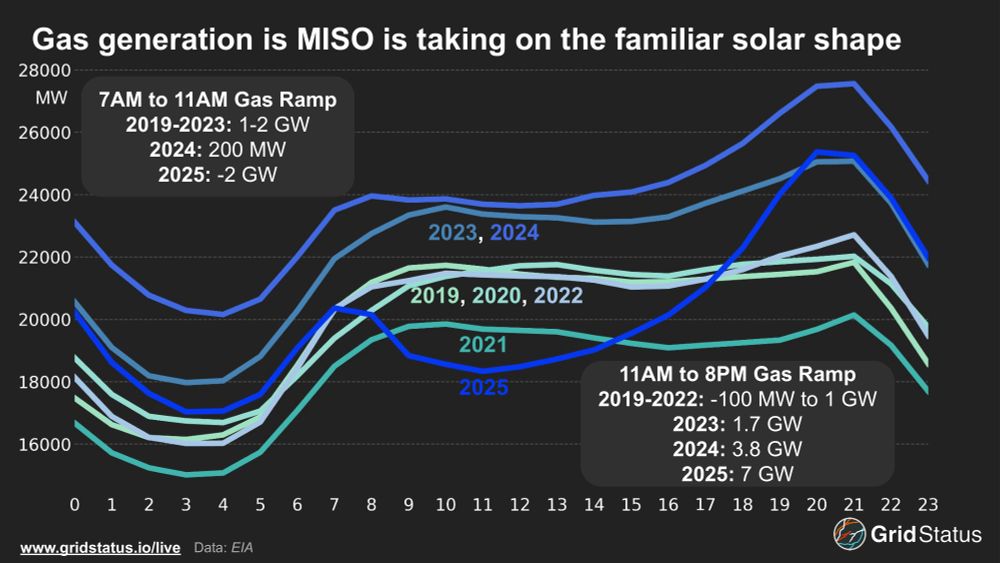
Little sneak preview of what we're thinking about for a forthcoming blog, looking at CAISO load, batteries, and gas ramps on May 20th, the current record-holding battery discharge day in California
🔌💡
03.06.2025 16:27 — 👍 11 🔁 2 💬 0 📌 1
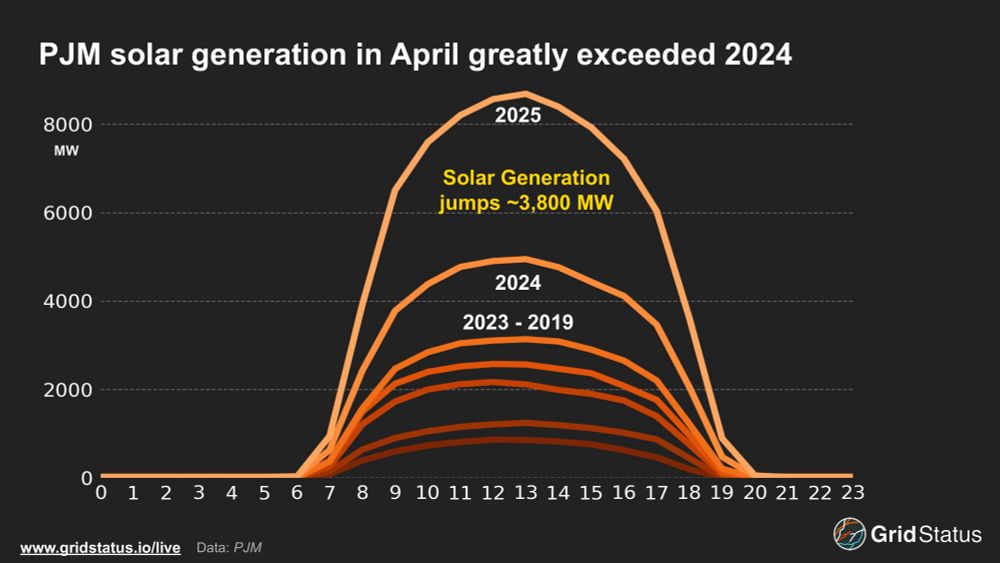
average hourly april solar output over years

average hourly april solar output over years
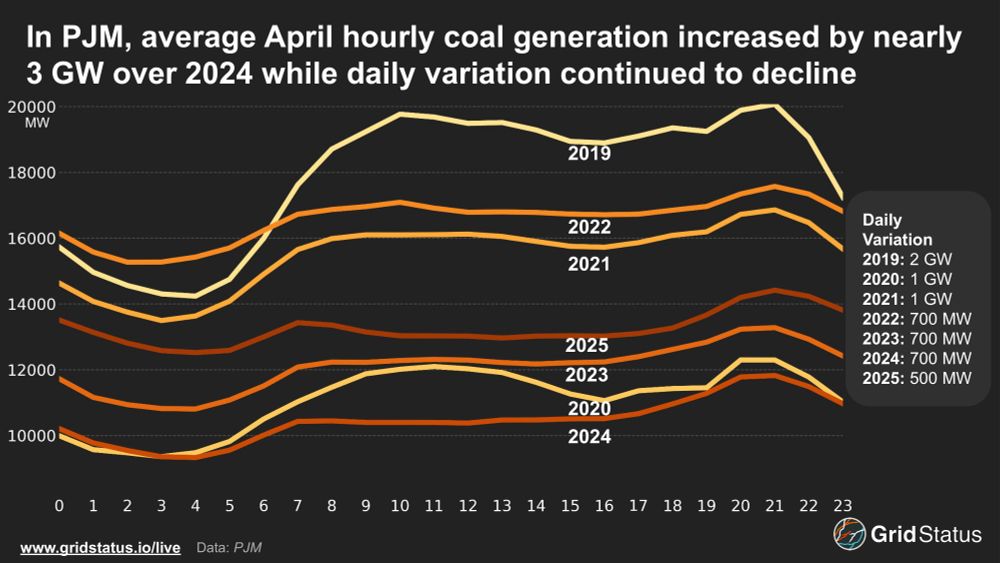
average hourly april coal output over years
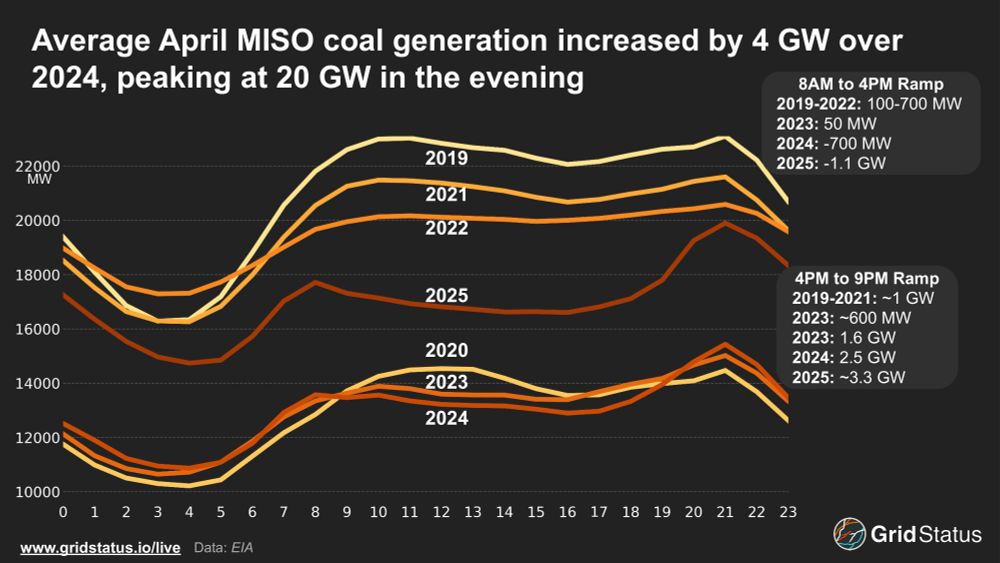
average hourly april coal output over years
peak solar output made a large jump in both MISO and PJM this year, but coal is also up relative to recent years
30.05.2025 15:20 — 👍 3 🔁 1 💬 0 📌 1
The Sun Also Rises in the Eastern Interconnection
MISO and PJM have finally seen substantial solar growth over the past year, but this new generation resource is also affecting the existing stack, altering the operations of coal and gas.
Put out a new blog earlier this week on the rise of solar in MISO and PJM - how it's impacting operations across the stack, why geographic diversity matters, and what looks like an uptick in emissions as coal rebounded in both markets 🔌💡
blog.gridstatus.io/pjm-miso-sol...
30.05.2025 15:17 — 👍 8 🔁 3 💬 2 📌 2
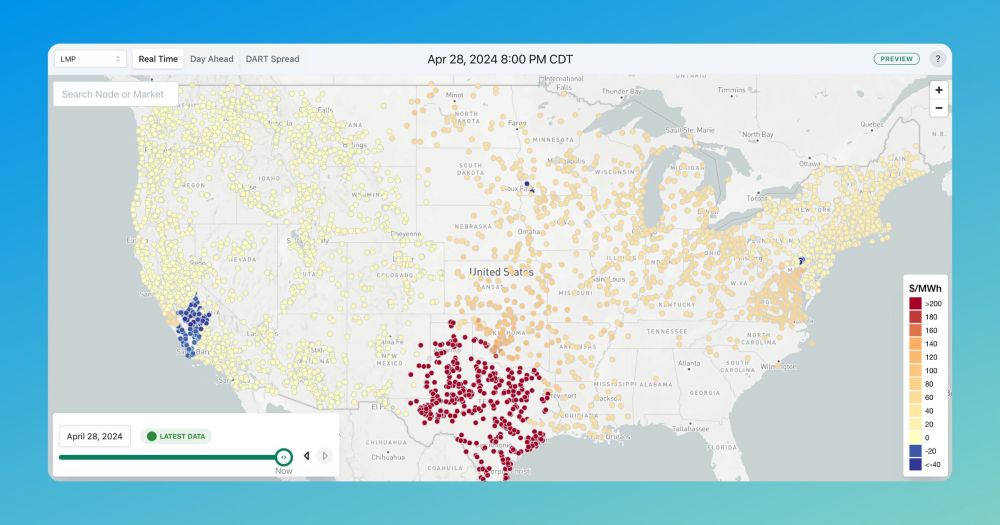
New blog looking at the first week of IESO's new nodal market in Ontario! 🔌💡
we also made a price map animation, looking at spreads from the first half of this week
blog.gridstatus.io/one-week-of-...
09.05.2025 16:09 — 👍 6 🔁 1 💬 0 📌 1
Nodal LMP Price Map | Grid Status
View Nodal LMPs in ERCOT, CAISO, PJM, SPP, MISO, ISO-NE, and NYISO
IESO's Market Renewal went live this morning, with moderate prices and varied losses until the afternoon
You can track prices in real time on our nodal map: www.gridstatus.io/map
We also have a data guide that will be expanded as more elements launch: docs.gridstatus.io/data-guides/... 🔌💡
01.05.2025 19:52 — 👍 6 🔁 0 💬 0 📌 0
IESO's market renewal goes live early tomorrow morning
unless things go a bit sideways, you'll see a refresh of our IESO live page tomorrow www.gridstatus.io/live/ieso
& the price map will have hundreds of new locations in Ontario 🔌💡
30.04.2025 16:35 — 👍 8 🔁 0 💬 0 📌 1