Want to write faster programs?
Start with the backbone of performance: the memory allocator
Last year, @apas.tel took us deep into an often overlooked topic and made it impossible to forget. Watch it again👇🏼
05.08.2025 11:49 — 👍 1 🔁 1 💬 1 📌 0
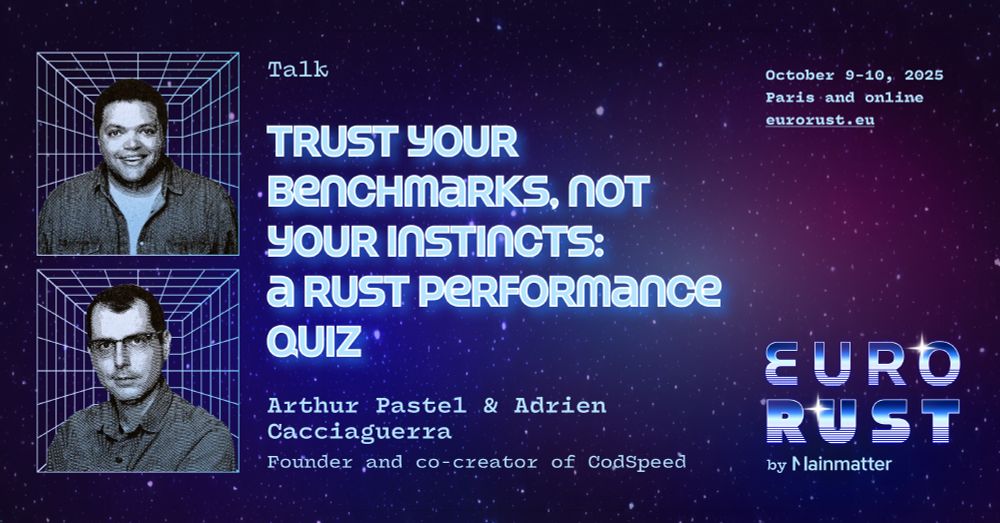
What’s faster in Rust? 🦀 Your instinct says one thing. The benchmark says something else.
@apas.tel and @adriencaccia.bsky.social are bringing a live Rust performance quiz to #EuroRust25. You don’t want to miss it!
🧵1/3
01.07.2025 12:21 — 👍 3 🔁 1 💬 1 📌 1
Announcing p99.chat, the assistant for software performance optimization 🚀
Describe your performance challenge, share your code, and p99 will analyze, instrument, and visualize the results, cutting the traditional setup overhead down to seconds!
05.06.2025 12:48 — 👍 4 🔁 1 💬 1 📌 2
We’re at @pyconit.bsky.social with @adriencaccia.bsky.social!
We’ll quizz you on Python performance again tomorrow! See you in room lasagna at 11:45!
30.05.2025 20:56 — 👍 1 🔁 0 💬 0 📌 0
YouTube video by EuroRust
The Impact of Memory Allocators on Performance: A Deep Dive - Arthur Pastel | EuroRust 2024
🦀 @apas.tel - The Impact of Memory Allocators on Performance
Memory allocators are often overlooked. But Arthur makes the case that they’re a key lever for performance in Rust. Learn how they work and when to care.
🧵 5/11
📺 Watch: youtu.be/pJ-FRRB5E84
15.05.2025 08:20 — 👍 1 🔁 1 💬 1 📌 0
We just released support for C++ benchmarks, enabling the use of our google benchmark compatibility layer to measure the performance of C++ codebases!
Learn more: codspeed.io/changelog/20...
27.03.2025 14:54 — 👍 0 🔁 1 💬 0 📌 0

Free Plan and Macro Runners Now Globally Available - Changelog - CodSpeed
New updates and improvements released to Codspeed.
Now, even small teams and indie devs can get reliable, high-precision performance insights without breaking the bank.
Learn more: codspeed.io/changelog/20...
04.03.2025 15:56 — 👍 0 🔁 0 💬 0 📌 0
Super excited about our latest changes to make performance testing more accessible! Two significant changes:
✅ The Free plan now includes private repositories (up to 5 users)
✅ Macro Runners are now globally available (bare-metal ARM64, 16 cores, 32GB RAM) with 120 min/month included for free
04.03.2025 15:56 — 👍 0 🔁 0 💬 1 📌 0
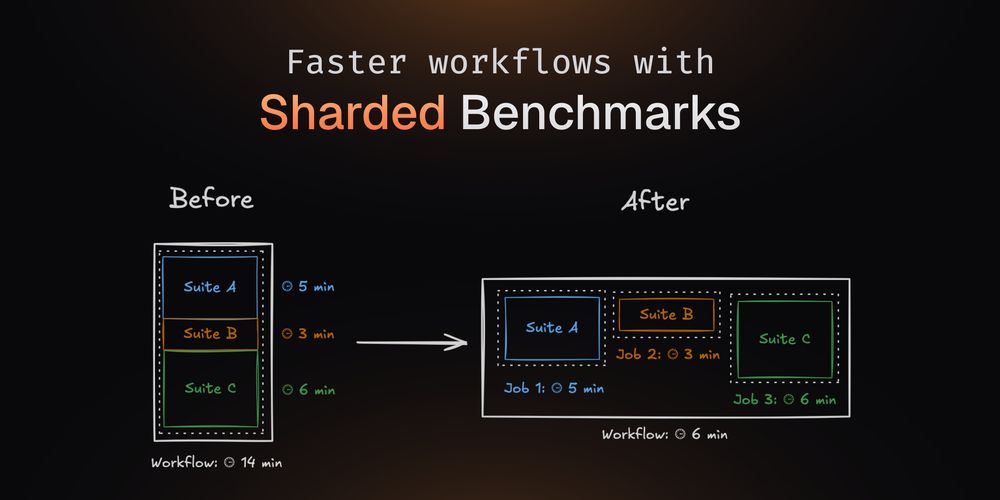
We now support sharded benchmark execution to provide even faster performance feedback!
28.02.2025 15:24 — 👍 2 🔁 1 💬 1 📌 0
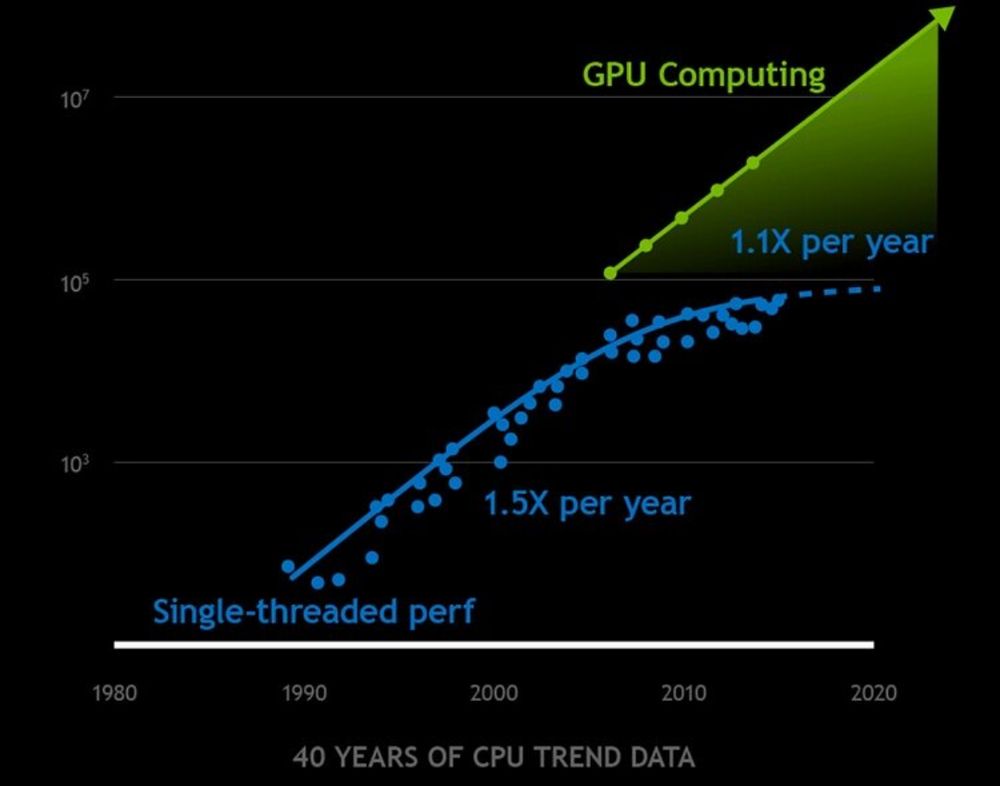
But physics is catching up. As transistors shrink, heat and power constraints limit clock speed gains. But to keep Moore’s Law going, we stack more cores. GPUs push this further with thousands of parallel cores, mentioning exponential performance increase but omitting the implementation complexity.
19.02.2025 09:48 — 👍 0 🔁 0 💬 1 📌 0
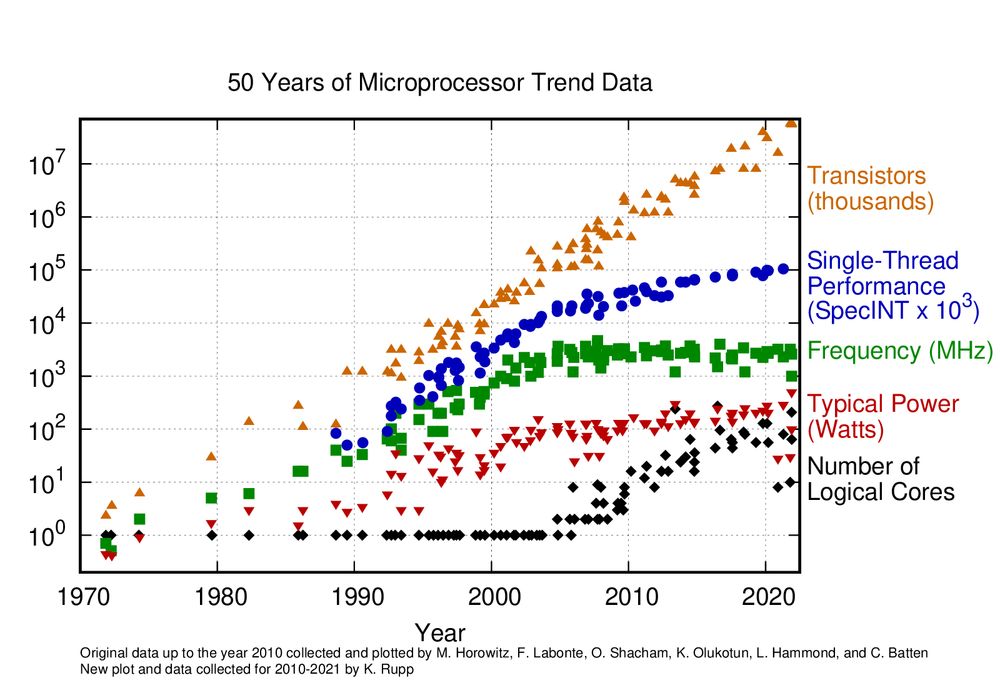
Single-core performance gains have largely plateaued. That means no more relying on “free” hardware speed boosts. CPUs haven't stopped improving, but we must actively tap into new architectures. Concurrency, SIMD, and thoughtful optimizations can still unlock impressive speedups.
19.02.2025 09:48 — 👍 0 🔁 0 💬 1 📌 0
We can expect the same for most compiled languages. Though, when dealing with an interpreted language, this becomes much harder to optimize before any specialization or JIT compilation.
17.02.2025 14:48 — 👍 0 🔁 0 💬 0 📌 0
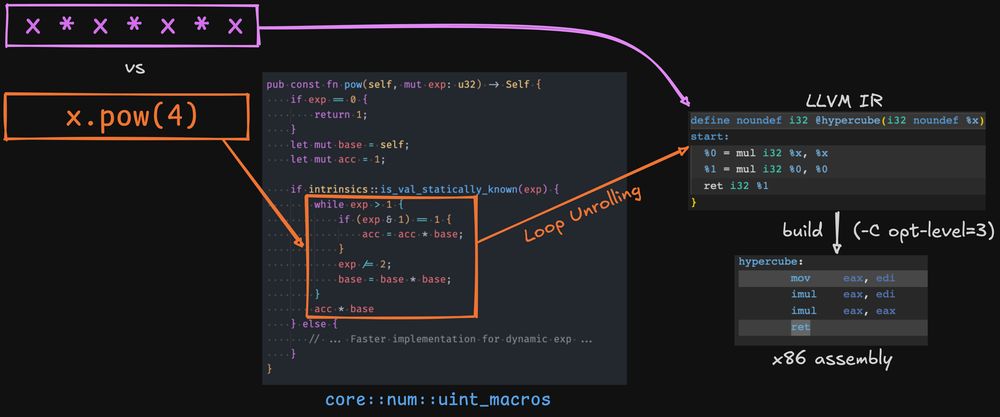
`x * x` generates exactly the same assembly as `x.pow(2)` in Rust and this goes even beyond powers of 2, thanks to LLVM loop unrolling and exponentiation by squaring.
17.02.2025 14:48 — 👍 1 🔁 0 💬 1 📌 0
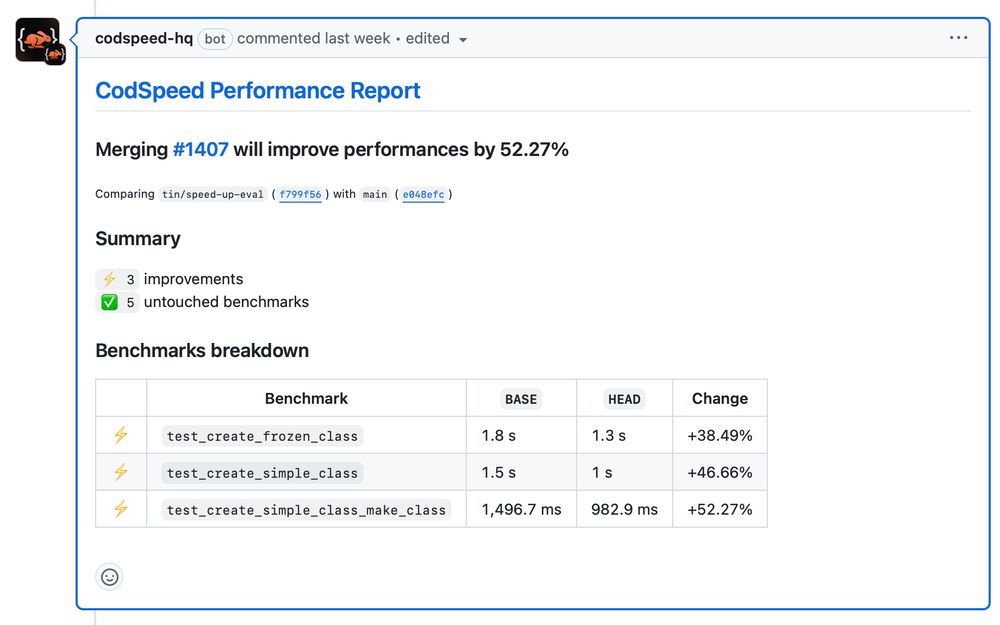
CodSpeed showing PR performance improvements between 38% for frozen class to 52% for make_class.
https://codspeed.io is pretty cool and class creation will be 38–52% faster in attrs 25.2.0
https://github.com/python-attrs/attrs/pull/1407
16.02.2025 09:50 — 👍 13 🔁 2 💬 3 📌 0
So for VM bytecode instrumentation, external execution path like native FFI calls need specific handling. Just like system calls need specific handing for performance measurement with native binary instrumentation.
13.02.2025 23:46 — 👍 0 🔁 0 💬 0 📌 0
The big issue with such an approach is that the instrumentation is limited to the interpreter itself while for native binary instrumentation the boundary is system calls and only the user space can be instrumented.
13.02.2025 23:46 — 👍 1 🔁 0 💬 1 📌 0
Kudos to Nikolai Vazquez for building such an intuitive benchmarking framework. We hope to contribute as much as we can to the project!
13.02.2025 15:59 — 👍 0 🔁 0 💬 0 📌 0
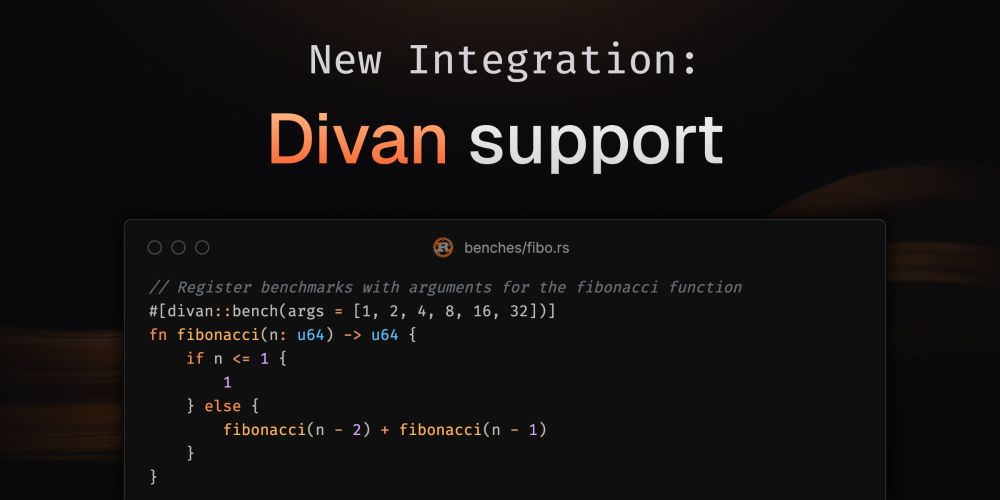
Divan Support for Rust - Changelog - CodSpeed
New updates and improvements released to Codspeed.
We just released a Divan 🛋️ integration. So far, this is the best developer experience you can hope for building performance tests in Rust 🦀!
codspeed.io/changelog/20...
13.02.2025 15:59 — 👍 3 🔁 2 💬 1 📌 0
Yes. First time but it was quite simple getting started
13.02.2025 07:06 — 👍 1 🔁 0 💬 1 📌 0
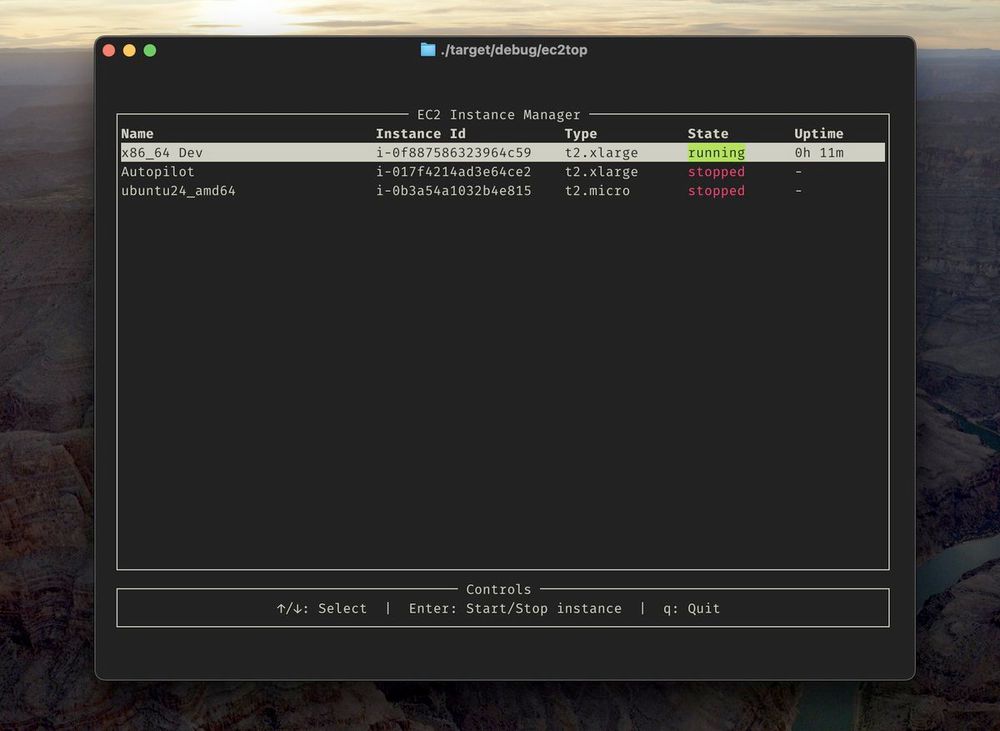
Started hacking on a small TUI for managing EC2 instances and SSH connections. Can’t wait to ditch AWS Console's clunkiness.
12.02.2025 22:21 — 👍 0 🔁 0 💬 1 📌 0
Measure outside the VM, and you’re profiling the interpreter, not your code. Probably not what you actually care about.
11.02.2025 21:34 — 👍 0 🔁 0 💬 0 📌 0
For languages running on a VM (Python, Java, JS, etc.), performance instrumentation should happen at the VM level. Execution environments vary, but the interpreter is the single source of truth for performance behavior.
11.02.2025 21:34 — 👍 0 🔁 0 💬 1 📌 1
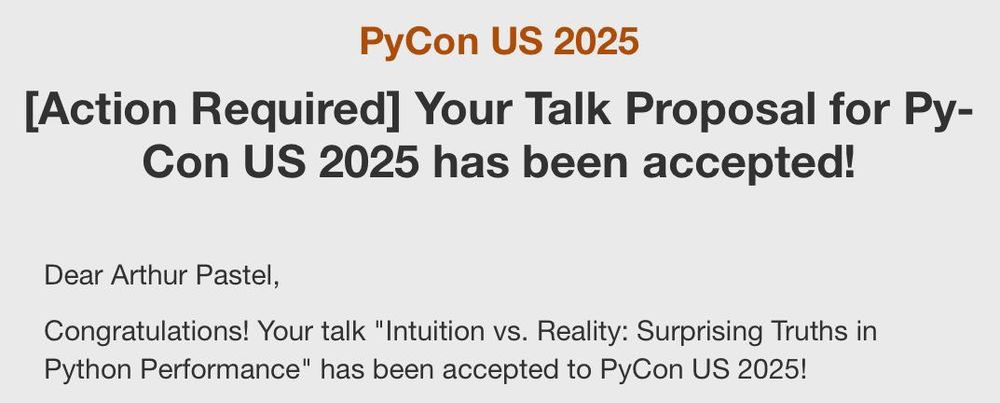
Lets go! I’ll be in Pittsburgh again in may for PyCon US 2025! Super excited to try a new interactive talk format this year!
10.02.2025 22:44 — 👍 0 🔁 0 💬 0 📌 0
Improvements of the Benchmark and Branch pages - Changelog - CodSpeed
New updates and improvements released to Codspeed.
We've just released some new changes, improving the UX for large-scale results display and sharing results when there are many benchmarks!
Check out the demos:
17.12.2024 09:48 — 👍 2 🔁 0 💬 0 📌 0
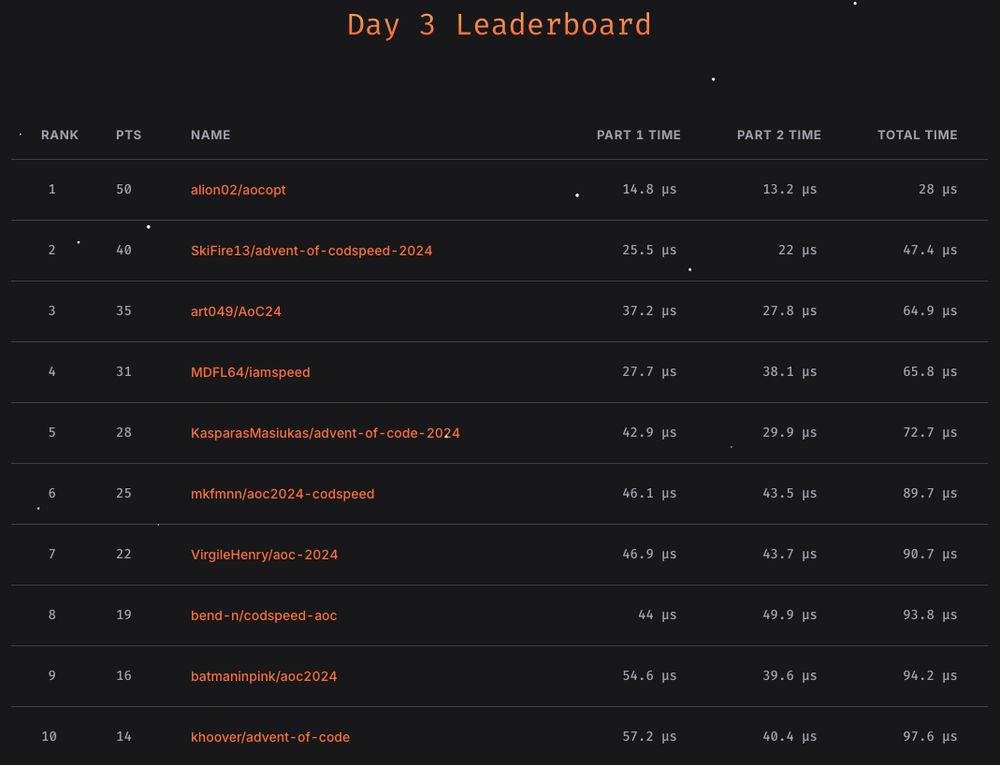
Day 3 of the Advent of CodSpeed is done!
You can still be a part of it and test your code's performance against the other participants at codspeed.io/advent
04.12.2024 17:30 — 👍 2 🔁 2 💬 0 📌 0

Advent of CodSpeed - CodSpeed
A performance challenge based on the Advent of Code problems.
[Sponsored post]
This December, @codspeed.io is hosting an epic Rust Performance Leaderboard for the Advent of Code! 🦀 The fastest solutions win amazing prizes like a MacBook, Nintendo Switch, and more!
➡️ codspeed.io/advent
#rust #rustlang #eurorust24 #adventofcode #codspeed #programming
04.12.2024 13:48 — 👍 11 🔁 4 💬 0 📌 0
hi, I'm amos! 🍃 they/them 🫐 open-source witch & maker of snappy videos and articles at @bearcove.eu ✨ be kind, be curious
articles: https://fasterthanli.me
videos: https://youtube.com/@fasterthanlime
podcast: https://sdr-podcast.com
Building @joggr.bsky.social
🗽 I live in #nyc, currently trudging around Manhattan 🏙️
🏃 I'm the CTO & Co-Founder of @joggr.bsky.social
🧑💻 I write code with #JavaScript, #TypeScript, #rust & ☕️
🦄 I love building #devtools
🌐 https://zrosenbauer.com/
A documentation platform for modern software teams.
#rtfm #doc4devs #rubberduckie
visit us @ https://joggr.io
For app and game teams - store and manage all your builds, share with your team, distribute to testers, manage rollouts, and deploy to stores 🚀
https://buildstash.com
Pythonista & PSF fellow 🐍🏆, Gopher 🐹, blogger 📝, speaker 📢, YouTuber 📺. ❤️ nuance & outcomes, 🗣️🇨🇿🇩🇪🇺🇸
• https://hynek.me/
• https://github.com/hynek
• https://www.youtube.com/@The_Hynek
• https://mastodon.social/@hynek
• https://x.com/hynek
Make things. Into digital + human rights. Sometimes I write words and then post them here, and if you follow me you can read them.
#gamedev #film #opensource #tech #gigs ❤️
founder @buildstash.com
🌍🏴🏳️🌈
he/him
Developing PyO3 to bring Rust 🦀 and Python 🐍 together.
Working with the team at Pydantic to build software that developers love.
Building Pydantic Logfire - uncomplicated observability for Python. Sequoia Scout.
Software engineer. @biomejs.dev creator and core - @astro.build core and TSC. Follow the 🦀
Maintainer at @astro.build 🚀
Maker of 👜 Bags of Tricks ✨for view transitions @vtbag.dev
Developer, maker of @pnpm.io
Works on dependency management at bit.dev
Python Core Developer. F"Yes!" 🐍🇨🇦
#PyPodcats
#PyCon US Chair 2023-2024.
PSF Fellow Member & Community Service Award recipient.
Keynote speaker.
Foodie. Traveler. Picky eater.
Opinions are mine.
#Python #PyLadies #kdrama
Security and Fellow, Python Software Foundation 🐍 Minnesoootan, he/him, #Python, #opensource, #security
🌐 https://sethmlarson.dev
Open source developer building tools to help journalists, archivists, librarians and others analyze, explore and publish their data. https://datasette.io […]
[bridged from https://fedi.simonwillison.net/@simon on the fediverse by https://fed.brid.gy/ ]
Infra, Rust, and motorcycles 🏳️🌈
Building @atuin.sh
they/them — building Python developer tools in Rust at Astral
the most authentic person you know
@sentry.io @syntax.fm @peated.com
EuroRust is a 2 day conference for the European Rust community. We cover all things Rust. Presented by @mainmatter.com
October 9th+10th 2025, Paris & online
Python, Boston, mathy fun, juggling, autism parenting. https://nedbat.com
Strawberry GraphQL 🍓 / PyCon Italia - London