#Wildfires in #Canada have emitted massive amount #smoke that is clearly visible in GOME-2 (B+C) #AAI observations. Long range transportation over northern #Atlantic. AAI data either from #EUMETCast or SAF archive acsaf.org/products/arp...
02.06.2025 15:13 —
👍 26
🔁 6
💬 1
📌 0
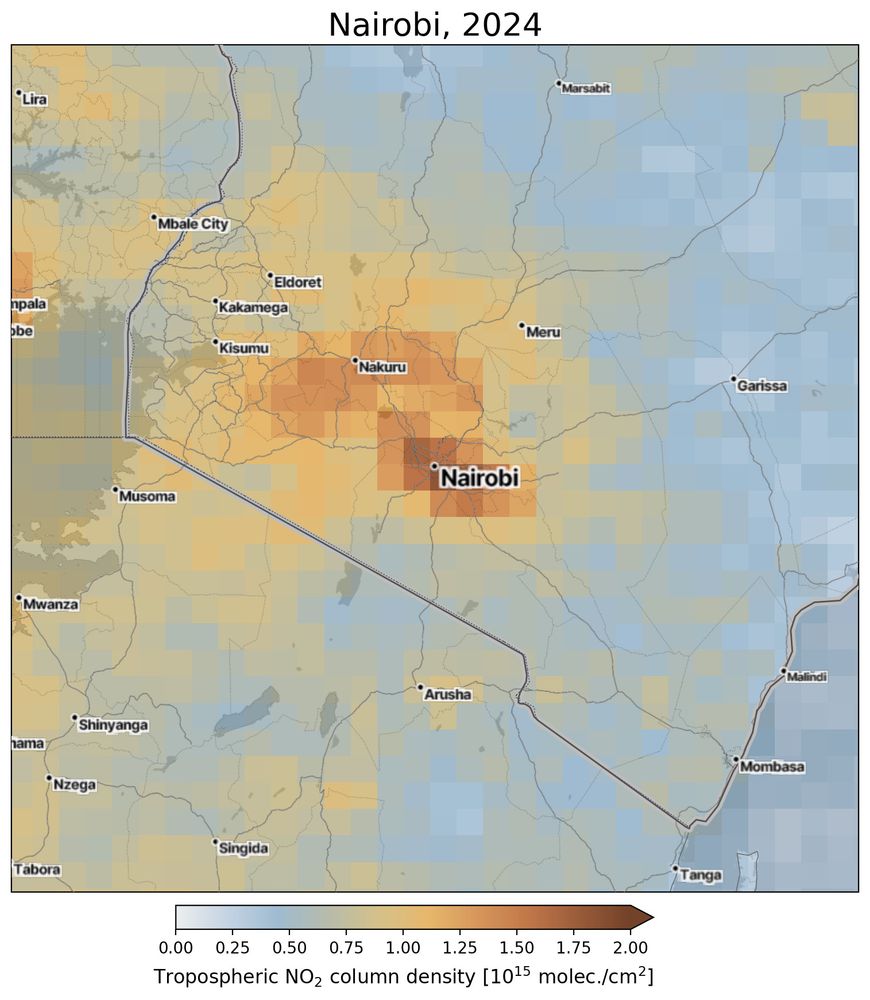
Nairobi and it's surrounding area. The high NO2 values are over the city itself and the other heavily populated areas near Nairobi. The NO2 values over countryside are much smaller due to lacking traffic.
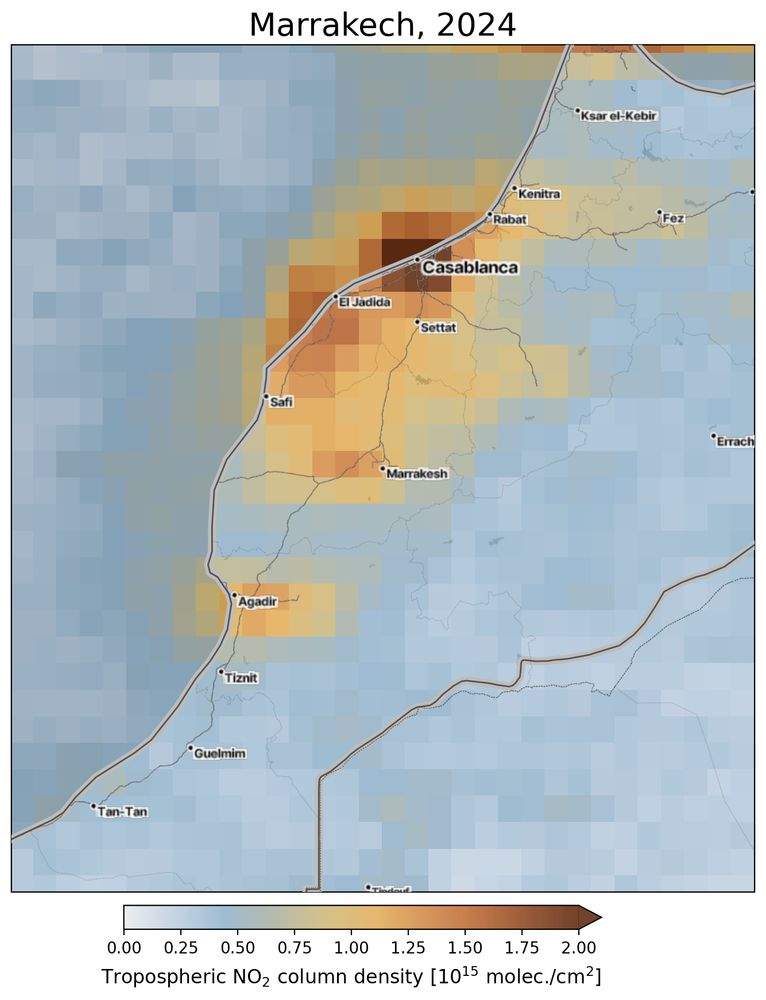
Casablanca, Marocco, and it's surrounding area. The high NO2 values are over the city itself and the other main cities along the coast like Rabat, Agadir and inland cities like Marrakesh. The NO2 values over countryside and Atlantic sea are much smaller.
Here are examples of GOME-2 B&C Level 3 Tropospheric NO2 for two African cities, Nairobi and Casablanca, annual mean 2024. NO2 is produced mainly in combustion of fossil fuels (coal, gas and oil) and especially fuel used in cars. Click images to get larger view.
29.04.2025 10:06 —
👍 3
🔁 1
💬 0
📌 0
@eumetsat.int
10.03.2025 15:23 —
👍 0
🔁 0
💬 0
📌 0
What are we seeing here? Could that black plume in the #EUMETSAT #MTG RGB images be from the ship collision near Hull on the UK coast? This animation shows observations from today, 09:50–12:50 UTC. 🚢🌫️ #MarineIncident
10.03.2025 15:19 —
👍 2
🔁 0
💬 1
📌 0

Testing my #MTG #satellite python scripts over Europe today.
28.02.2025 20:24 —
👍 4
🔁 0
💬 0
📌 0
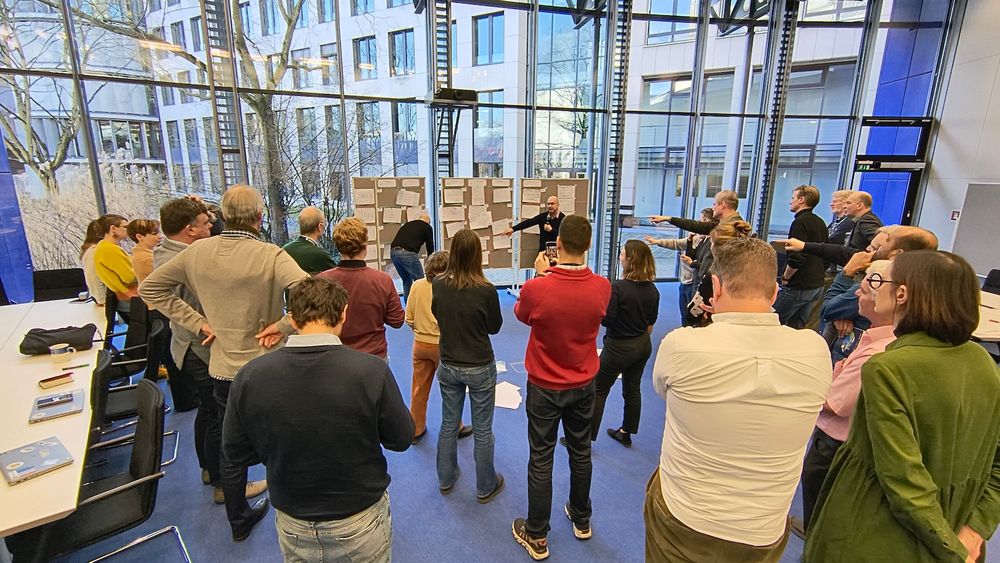
People standibng in front of screens in Open Space excercise and having ideas for the next sessions
@eumetsat.bsky.social
SAF Network meeting to plan the next phase for 2027-2032. New products, new services.
19.02.2025 13:53 —
👍 6
🔁 3
💬 0
📌 0
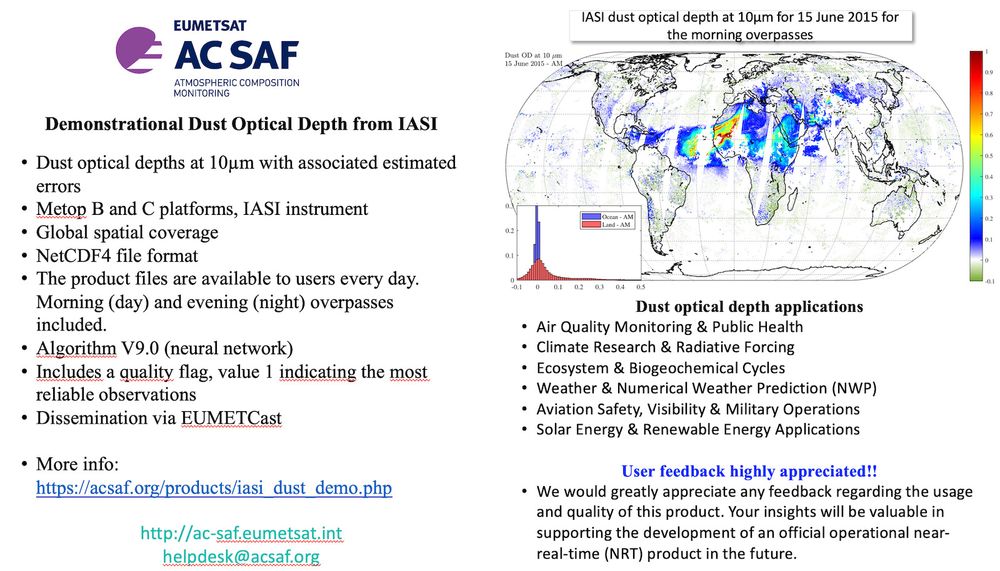
Short text with an image telling that the Demonstrational Dust Optical Depth from IASI is available:
Dust optical depths at 10µm with associated estimated errors
Metop B and C platforms, IASI instrument
Global spatial coverage
NetCDF4 file format
The product files are available to users every day. Morning (day) and evening (night) overpasses included.
Algorithm V9.0 (neural network)
Includes a quality flag, value 1 indicating the most reliable observations
Dissemination via EUMETCast
Contact: helpdesk@acsaf.org
Demonstrational IASI dust optical depth available via EUMETCast. More info and instructions: acsaf.org/products/ias...
05.02.2025 07:23 —
👍 8
🔁 4
💬 0
📌 0

The first day of Winter Satellite Workshop has started in Otaniemi with very interesting sessions. This year we celebrate many milestones, e.g. Finland's 30 yr membership in ESA #WSW25
21.01.2025 08:53 —
👍 5
🔁 1
💬 0
📌 0
A dire situation is unfolding tonight as wildfires rage in Southern California.
Communities continue to be significantly impacted by the Palisades and Eaton Fires.
08.01.2025 06:35 —
👍 42
🔁 16
💬 2
📌 4

Nice example how volcanic emissions shape (here water) cloud microphysical properties. Probably secondary aerosols acting as CCN causing cloud droplet size to drop? Image is from #EUMETSAT #MTG #cloudphase product on 1.12. Pink => larger, yellow => smaller water cloud droplets.
12.12.2024 15:03 —
👍 20
🔁 7
💬 1
📌 0
Volcanic eruption 🌋 in Iceland clearly visible in EUMETSAT geostationary MSG observations in the past 12 hours. Signal (green plume) is coming from emitted SO2 #EUMETSAT #volcaniceruption
21.11.2024 07:39 —
👍 4
🔁 2
💬 0
📌 0

Wind gust chart for Fennoscandian domain, showing high wind gust values for Thursday 00 UTC.

4-panel map chart for northeastern Europe showing the probability of 25 m/s wind gusts based on ECMWF ENS forecasts.
The forecasts related the incoming storm have at least not weakened.
The ENS ensemble forecast now has a non-zero probability of 25 m/s gusts in central parts of the country, combined with heavy snowfall.
18.11.2024 08:40 —
👍 40
🔁 12
💬 0
📌 1

NASAn Terra-satelliittin ottama satelliittikuva Etelä-Suomesta 6.11.2024. Tampere noin kuvan keskellä.

NASAn Terra-satelliittin ottama satelliittikuva Etelä-Suomesta 6.11.2024. Tampere noin kuvan keskellä. Punakeltaisella värillä esitetty pilvipisaran koko. Tampereelta lähtee vana, jonka alueella pilvipisarat ovat selvästi ympäristöään pienempiä.

NASAn Terra-satelliittin ottama satelliittikuva Etelä-Suomesta 6.11.2024. Tampere noin kuvan keskellä. Kuvassa mitattu pienempien pilvipisaroiden vanan pituudeksi 76,2 km.
Tiesitkö, että #pienhiukkaset vaikuttavat pilviin? Tampereella on käynnissä tulipalo. Savuhiukkaset toimivat pilvipisaroiden tiivistymisytiminä. Koska ytimiä on enemmän savun vaikutusalueella, muodostuu enemmän pilvipisaroita ja ne ovat pienempiä. Satelliittikuva 6.11. MODIS/Terra.
07.11.2024 18:17 —
👍 20
🔁 4
💬 4
📌 1


