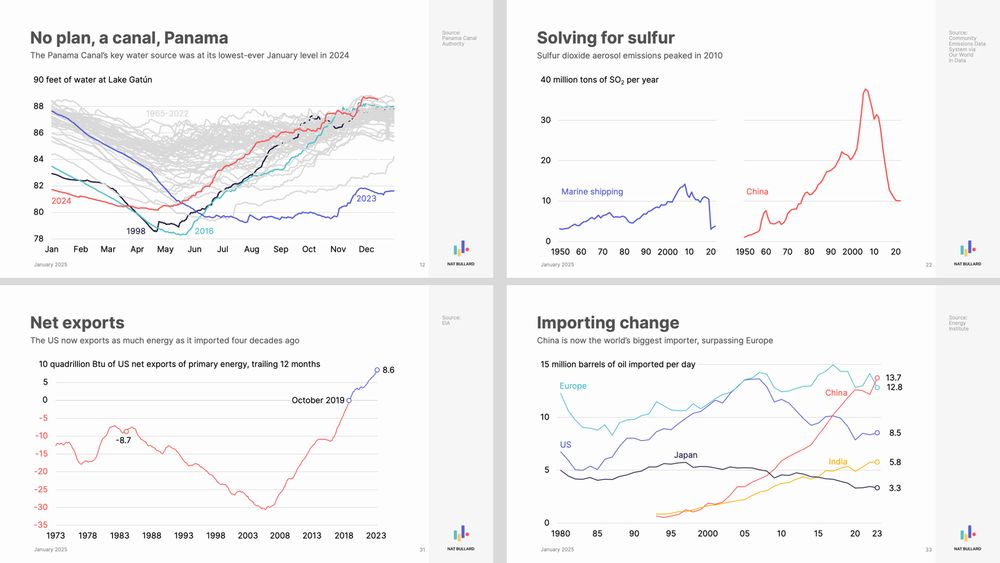
This graphic shows four line graph time series and each are monthly from January 1984 through January 2026. The first graph is a 12-month running mean of global mean surface temperature anomalies. Anomalies are computed relative to a 1991-2020 baseline using ERA5 data. The second graph is monthly carbon dioxide abundance. The CO2 graph is the Keeling Curve. Current levels are 429 ppm. The third graph is monthly global methane abundance. Current levels are 1946 ppb. The fourth graph is monthly global nitrous oxide abundance. Current levels are 339 ppb. The three greenhouse gases show seasonal cycles and long-term increasing trends using data from NOAA GML. The global mean surface temperature anomaly record also exhibits decadal variability and a long-term increasing trend. All graphs are rising and shown in four different colors, including white, yellow, orange, and pink.
End of month climate change check-in: 🫣
+ Global temperature: 📈
+ Carbon dioxide (CO₂): 📈
+ Methane (CH₄): 📈
+ Nitrous oxide (N₂O): 📈
Graphic by zacklabe.com/climate-chan...
28.02.2026 18:46 —
👍 131
🔁 57
💬 4
📌 11
Support my favorite podcast if you love hearing about how Climate-Tech is being deployed across the US and globally. David Roberts @volts.wtf is a hero that I constantly learn from. I was starstruck meeting him at NY Climate Week ‘25, thanks to a free ticket for subscribers ;).
24.02.2026 04:07 —
👍 41
🔁 4
💬 1
📌 0
Electrification of heavy industry feels inevitable, but US and European electricity prices are surging. So: are you more bullish on hybrid approaches combining electrotech with biology or chemistry to cut energy intensity, or do fully electrified companies still win long-term w/ short term $ parity?
18.02.2026 15:05 —
👍 0
🔁 0
💬 0
📌 0
What does wildfire smoke do to normal HVAC filters and what air filters actually work with wildfire present?
01.11.2025 11:38 —
👍 0
🔁 0
💬 0
📌 0

Global Investors Are Pouring More Money into Climate Tech
Clean energy companies, EV makers and other green firms attracted $56 billion in the first nine months of 2025 — more than in all of 2024.
"Global investment in green technology for the first three quarters of the year has already surpassed all of 2024. The fortunes of the sector have been in decline for three years, but explosive energy demand fueled by data centers has sparked a reversal."
17.10.2025 18:29 —
👍 114
🔁 42
💬 6
📌 3
@volts.wtf we can certainly learn a lot from Taiwan. You can come out for DC Climate Week and celebrate Earth Day organizing around climate in DC.
12.10.2025 02:35 —
👍 2
🔁 0
💬 0
📌 0

Air pollution from oil and gas causes 90,000 premature US deaths each year, says new study
Study analyzed health impacts of fossil fuels from exploration to end use, and found communities of color bear brunt of harm
"Air pollution from oil and gas causes more than 90,000 premature deaths and sickens hundreds of thousands of people across the US each year, a new study shows..."
If MAHA were anything other than dipshit reactionary fantasies & conspiracy theories, it would focus overwhelmingly on air pollution.
27.08.2025 20:25 —
👍 496
🔁 194
💬 20
📌 7
Fermented tomatoes is my favorite summer treat! 2% salt by weight and a bunch of garlic. Let sit at room temp for a while and enjoy!
21.08.2025 00:16 —
👍 0
🔁 0
💬 0
📌 0

Chemical pollution a threat comparable to climate change, scientists warn
More than 100 million ‘novel entity’ chemicals are in circulation, with health impact not widely recognised
"a lot of people assume that there’s really great knowledge and huge due diligence on the chemical safety of these things. But it really isn’t the case.”
We are swimming in a toxic soup of chemicals, + we know very little about what they're doing to us:
www.theguardian.com/environment/...
06.08.2025 17:04 —
👍 117
🔁 61
💬 6
📌 5
What novel processing techniques are exciting and what are the under appreciated resources that we are now able to economically tap into. Also, when will bio-mining scale?
25.05.2025 01:42 —
👍 1
🔁 0
💬 0
📌 0
Liftoff Reports – Yardsale Energy
In case anyone needs to reference the DOE's liftoff reports, which no longer appear on the official website: yardsale.energy/liftoff-repo... 🔌💡
18.05.2025 21:32 —
👍 89
🔁 20
💬 6
📌 5
@nicholas-gilbert.bsky.social
18.05.2025 11:46 —
👍 1
🔁 0
💬 0
📌 0
🙋♂️🙋♂️🙋♂️🙋♂️ I’m so sad to miss the canary live event, but I’m in town the rest of the week.
18.05.2025 11:45 —
👍 0
🔁 0
💬 0
📌 0
Thanks for coming to DC Climate Week, sorry I missed you! What did you think of the week?
03.05.2025 02:50 —
👍 1
🔁 0
💬 1
📌 0
We are up to 140 events!
24.04.2025 10:58 —
👍 0
🔁 0
💬 0
📌 0

DC Climate Week · Events Calendar
View and subscribe to events from DC Climate Week on Luma.
DC Climate Week is heating up 📣 🔥 🎉 ! We have over 100 events on the public calendar and more than 2,000 people participating across the week! If you haven't checked the calendar lately, now is the time. Some extremely exciting events have been added!
DCCW Calendar: lu.ma/dcclimateweek
22.04.2025 16:35 —
👍 3
🔁 0
💬 1
📌 0

DC Climate week is happening April 28 – May 2, 2025. Attendees will engage with policymakers, learn from world-renowned experts and help make the nation’s capital a sustainable model for other cities.
Learn more here: ow.ly/IgZN50VAN9a
#Partner
15.04.2025 15:15 —
👍 2
🔁 2
💬 0
📌 1
👋🙋♂️🙌
21.04.2025 03:09 —
👍 0
🔁 0
💬 0
📌 0
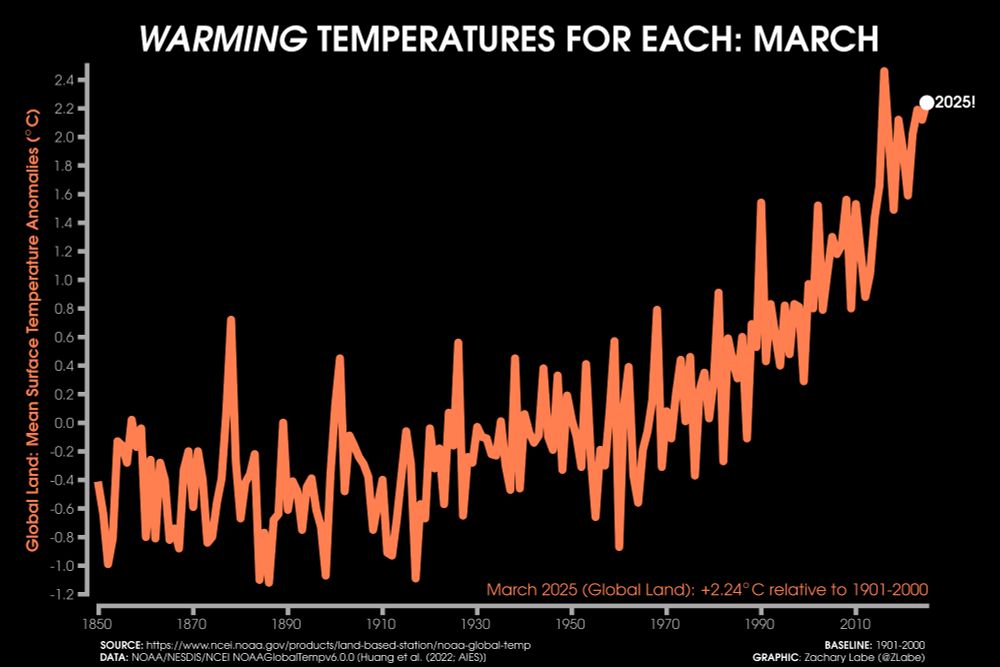
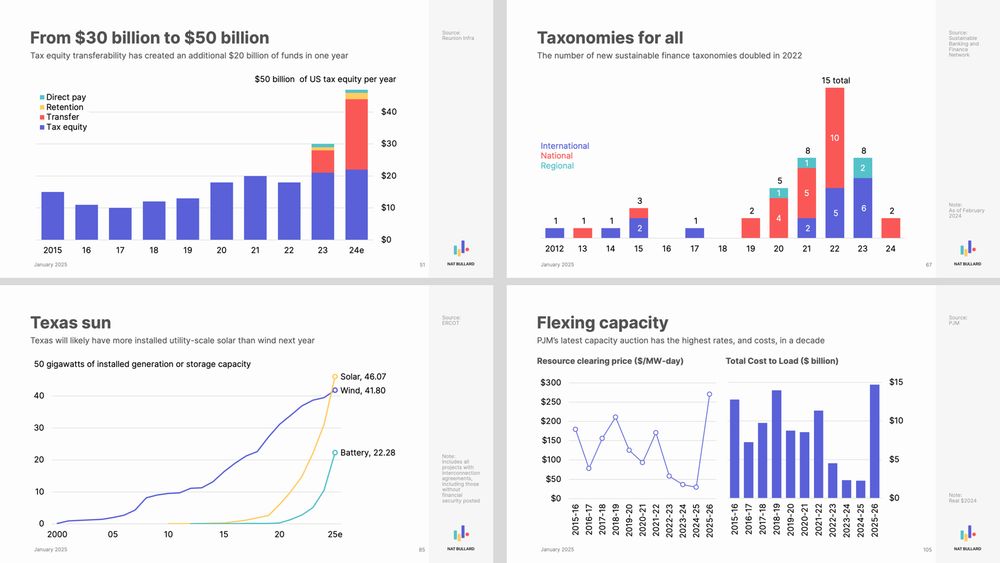
Line graph time series of global land mean surface temperature anomalies for each March from 1850 through 2025. There is a long-term increasing trend and large year-to-year variability. The mean surface temperature anomaly averaged for March 2025 was 2.24°C for global land areas. Anomalies are computed relative to a 1901-2000 climate baseline. Data from NOAA/NESDIS/NCEI NOAAGlobalTemp v6.0.0.
Last month was the 2nd warmest March on record for land areas around the world...
Data provided by @noaa.gov NOAAGlobalTemp v6.0.0 (www.ncei.noaa.gov/products/lan...).
19.04.2025 01:51 —
👍 270
🔁 83
💬 6
📌 6

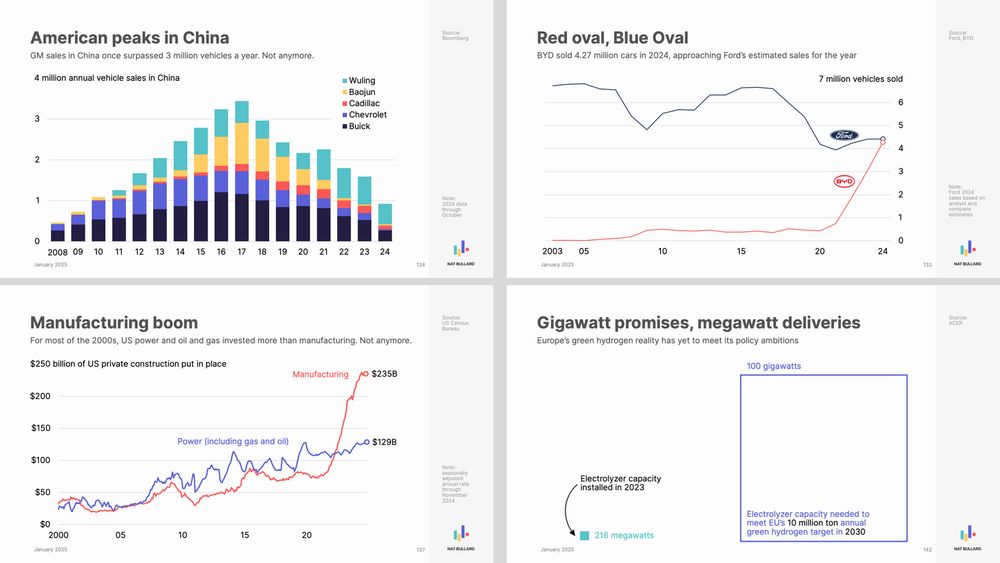
This graphic shows four line graph time series and each are monthly from January 1984 through 2025. The first graph is a 12-month running mean of global mean surface temperature anomalies. Anomalies are computed relative to a 1991-2020 baseline using ERA5 data. The second graph is monthly carbon dioxide abundance. The CO2 graph is the Keeling Curve. Current levels are 427 ppm. The third graph is monthly global methane abundance. Current levels are 1943 ppb. The fourth graph is monthly global nitrous oxide abundance. Current levels are 338 ppb. The three greenhouse gases show seasonal cycles and long-term increasing trends using data from NOAA ESRL. The global mean surface temperature anomaly record also exhibits decadal variability and a long-term increasing trend. All graphs are rising and shown in four different colors, including white, yellow, orange, and pink.
Update - my monthly climate change dashboard...
Higher resolution graphic available at zacklabe.com/climate-chan...
09.03.2025 13:40 —
👍 315
🔁 111
💬 11
📌 12

Climate change is not linear: why we need to update the Paris Agreement
For a few years, scientists have been warning that even if we hit Paris targets, we could cross several tipping points that could trigger a cascade into total climate breakdown.
‘A clust...
Scientists think there's a decent chance that, if global temps rise 2 degrees above pre-industrial levels, it could trigger a cascade of tipping points that further accelerate warming, up to 5 or 6 degrees.
AKA: "A cluster of abrupt shifts occur in ESMs [Earth system models] at 1.5 to 2ºC."
14.02.2025 18:51 —
👍 696
🔁 280
💬 24
📌 35

Just a quick head's up on the global f&%kery that's unfolding.
In the middle of a La Nina, the global surface temperature anomaly year-to-date (Jan. 1 - Feb. 6) for 2025 is currently at 1.74°C above the 1850-1900 IPCC pre-industrial average.
That's 1.74°C.
08.02.2025 14:05 —
👍 181
🔁 50
💬 14
📌 3
If DOGE really wants to save taxpayers money, they would deal with climate change because that shit’s gonna cost us trillions of dollars.
08.02.2025 00:25 —
👍 479
🔁 77
💬 11
📌 3

One mile on a bike is a $.42 economic gain to society, one mile driving is a $.20 loss
Copenhagen, the bicycle-friendliest place on the planet, publishes a biannual Bicycle Account, and buried in its pages is a rather astonishing fact.
“One mile on a bike is a $.42 economic gain to society, one mile driving is a $.20 loss.”
“Which means that Copenhagen, a city of 1.2 million people, saves $357 million a year on health costs because something like 80% of its population commutes by bike.” #CityMakingMath
grist.org/biking/one-m...
30.01.2025 07:10 —
👍 730
🔁 249
💬 9
📌 22