Understanding error bars in charts
Error bars illustrate the margin of error for a survey estimate by showing how precise that estimate is. Here are some answers to common questions that might help you better understand charts with error bars.
In our charts, we sometimes illustrate the margin of error through error bars, also called confidence intervals. But what do they mean? How should they be interpreted?
Here are some answers to common questions that might help you better understand charts with error bars.
17.09.2025 20:44 —
👍 28
🔁 10
💬 2
📌 2
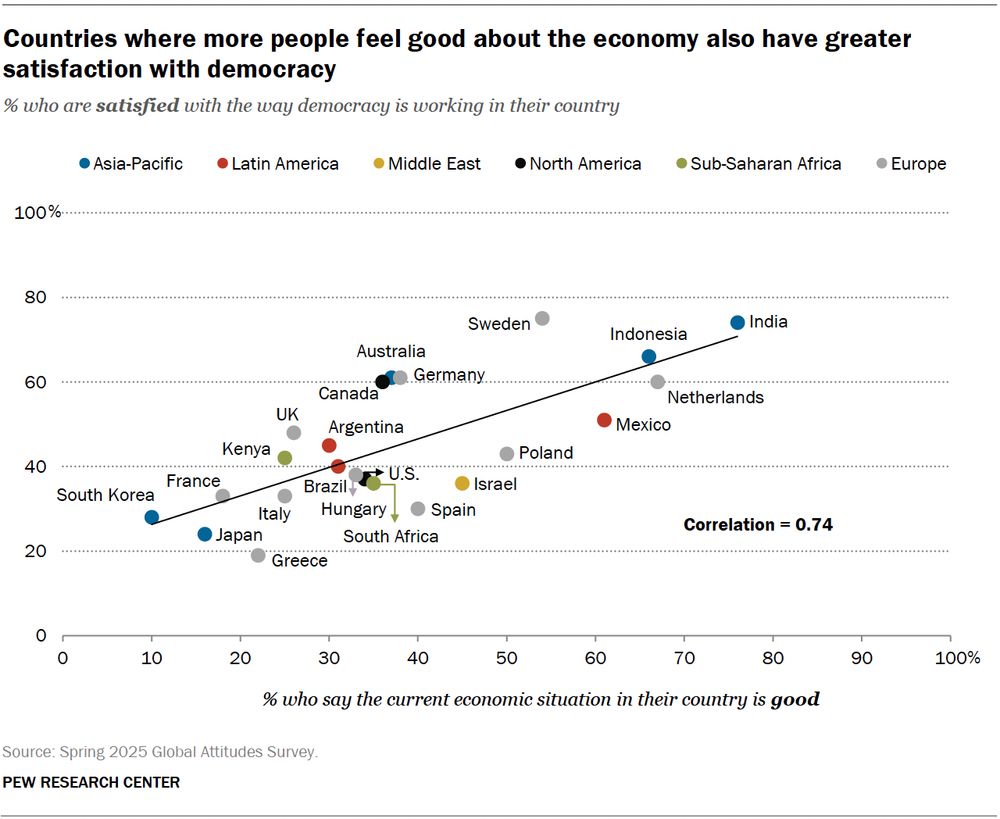
Chart that shows that countries where more people feel good about the economy also have greater satisfaction with democracy
Countries where large shares of the public say the economy is in good shape also tend to have large shares who are satisfied with democracy. www.pewresearch.org/...
02.07.2025 17:30 —
👍 15
🔁 7
💬 1
📌 0
Congrats to you both!
01.07.2025 21:39 —
👍 1
🔁 0
💬 0
📌 0
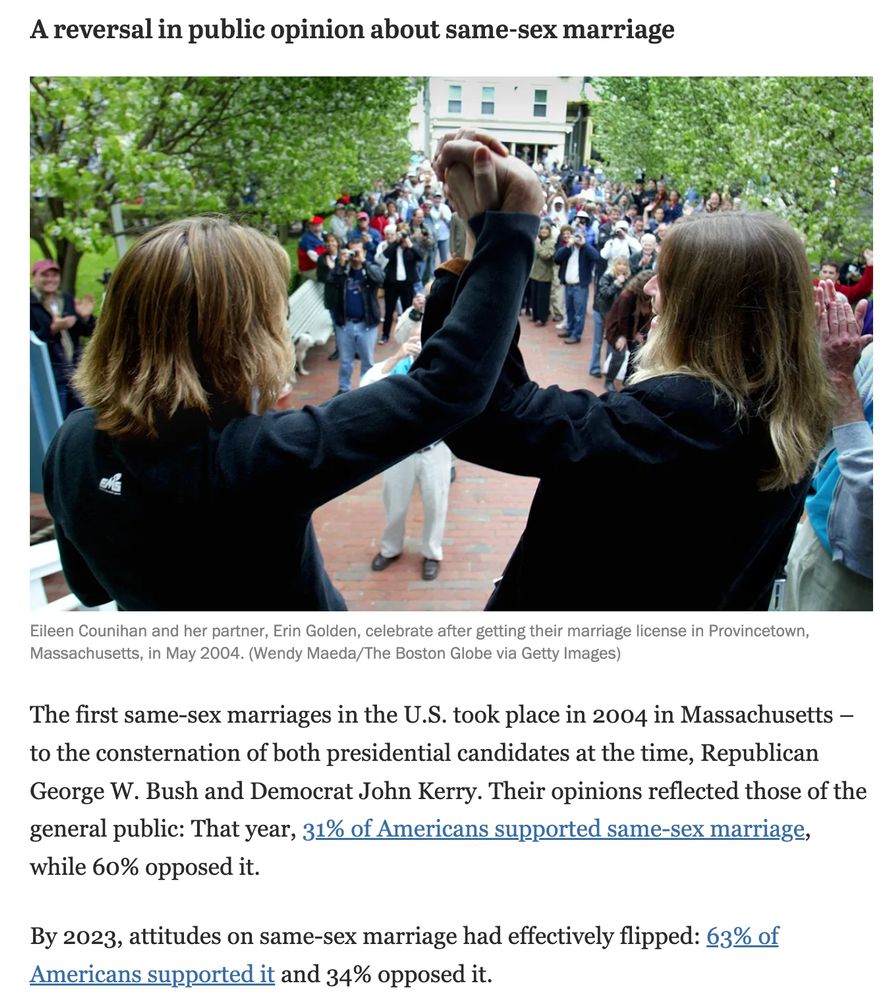
Screenshot from a Pew Research Center article showing that public opinion about same-sex marriage in the United States changed dramatically between 2004 and 2023.
On today's 10th anniversary of the Obergefell ruling, it's worth noting that same-sex marriage is among a small number of issues to see a complete reversal of public opinion in a relatively short span: 60% opposed it in 2004; 63% favored it by 2023. www.pewresearch.org/2024/09/13/h...
26.06.2025 13:35 —
👍 42
🔁 10
💬 0
📌 2
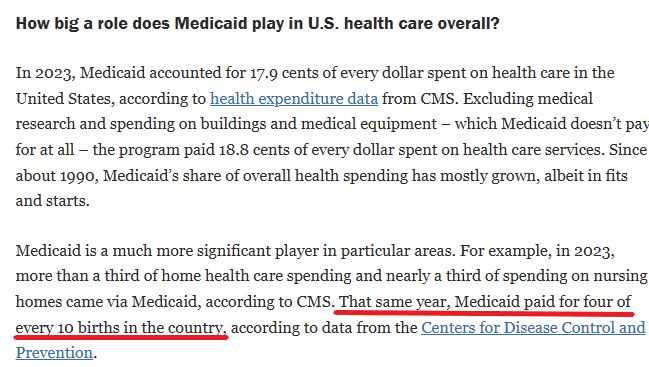
Screenshot of a Pew Research Center analysis about Medicaid.
Quite a stat: Medicaid paid for 4 out of every 10 births in the United States in 2023. www.pewresearch.org/short-reads/...
24.06.2025 21:19 —
👍 24
🔁 6
💬 1
📌 0
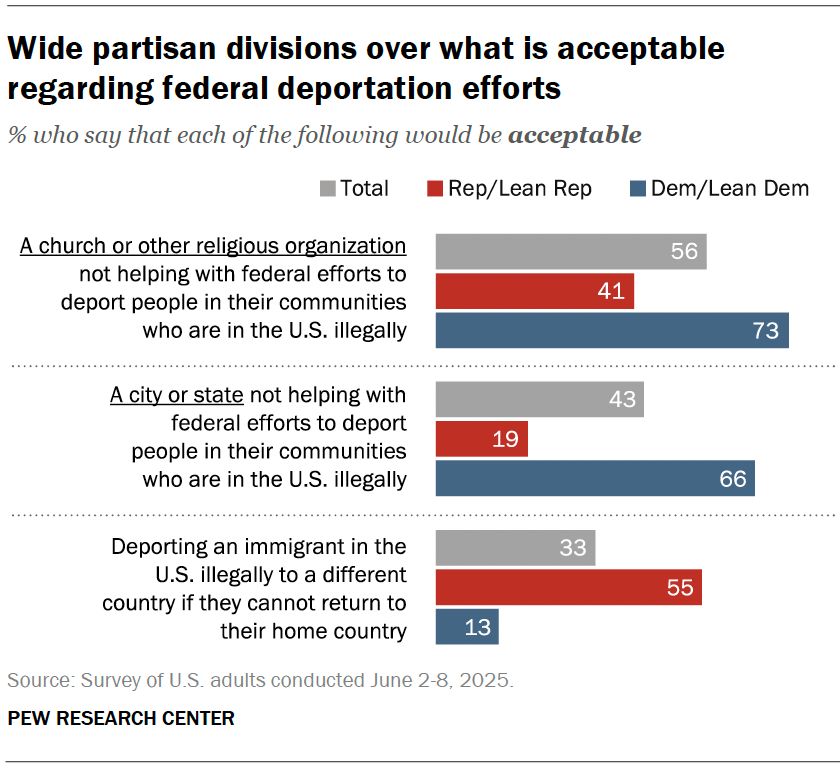
A bar chart showing the percentage of U.S. adults, Rep/Lean Rep and Dem/Lean Dem who say it would be acceptable for three actions to happen regarding federal deportation efforts
Title: Wide partisan divisions over what is acceptable regarding federal deportation efforts
Subtitle: % who say that each of the following would be *acceptable*
Item 1: A church or other religious organization not helping with federal efforts to deport people in their communities who are in the U.S. illegally. 56% acceptable among U.S. adults, 41% among Rep/Lean Rep and 73% among Dem/Lean Dem
Item 2: A city or state not helping with federal efforts to deport people in their communities who are in the U.S. illegally. 43% acceptable among U.S. adults, 19% among Rep/Lean Rep and 66% among Dem/Lean Dem
Item 3: Deporting an immigrant in the U.S. illegally to a different country if they cannot return to their home country. 56% acceptable among U.S. adults, 41% among Rep/Lean Rep and 73% among Dem/Lean Dem
A June 2025 Pew Research Center survey found that 55% of Republicans (incl. leaners) say it would be acceptable to deport immigrants to a different country if they cannot return to their home country.
By comparison, 13% of Democrats say this would be acceptable.
pewrsr.ch/446QJwe
23.06.2025 21:15 —
👍 2
🔁 0
💬 1
📌 0
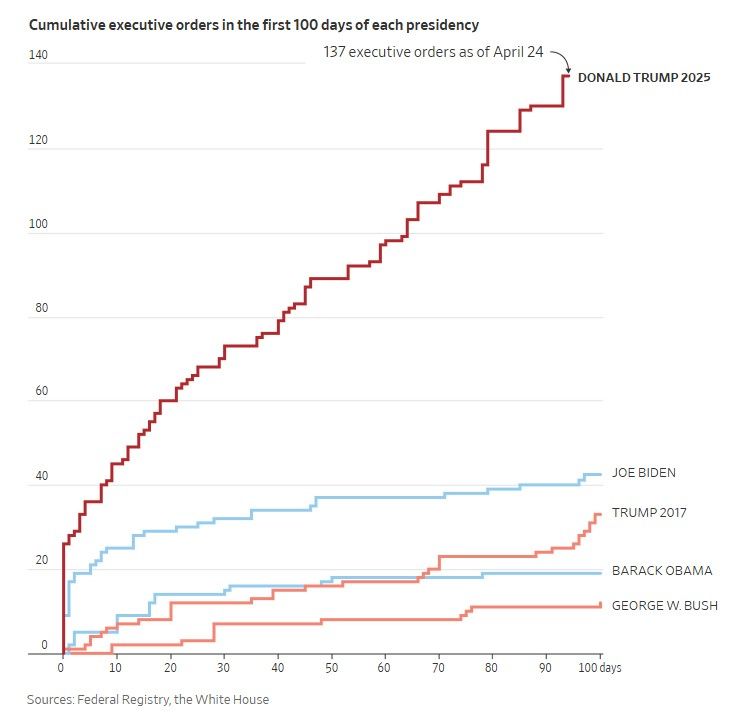
Line chart from The Wall Street Journal showing the cumulative number of executive orders signed by each recent president through the first 100 days of their tenure. Donald Trump has issued far more executive orders than any other recent president at this stage in his presidency.
Striking chart from @wsj.com shows the cumulative number of executive orders by each recent president through their first 100 days: www.wsj.com/politics/pol...
In a new @pewresearch.org survey, 51% of Americans say Trump is doing too much by executive order: www.pewresearch.org/politics/202...
25.04.2025 14:52 —
👍 39
🔁 26
💬 2
📌 2
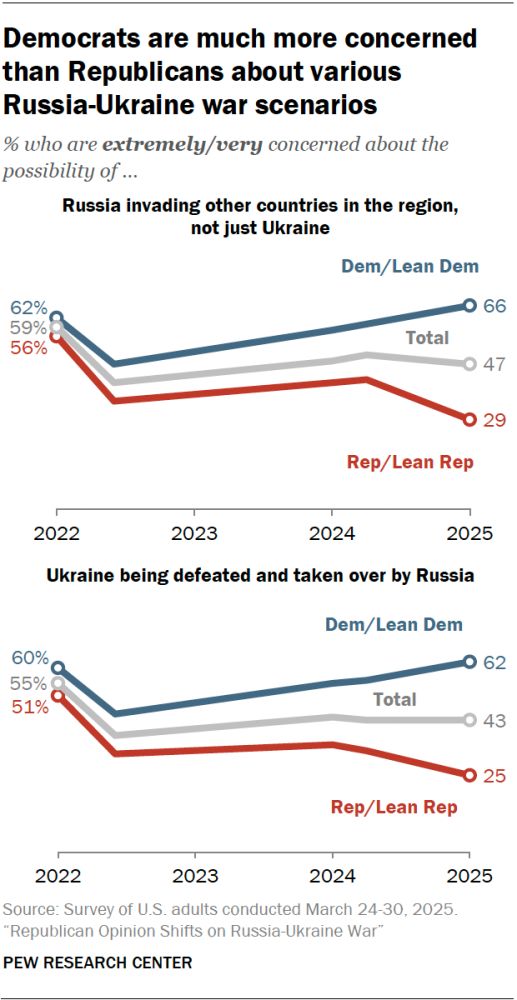
A set of line charts showing that Democrats are much more concerned than Republicans about various Russia-Ukraine war scenarios
47% of Americans are extremely or very concerned about Russia invading other countries, and 43% are concerned about Russia defeating and taking over Ukraine. Republicans have become less concerned about both possibilities in recent months, while Democrats have become more so.
22.04.2025 16:09 —
👍 22
🔁 9
💬 1
📌 1
Hey there, Bluesky!
We are excited to share our data and insights here with you, and so are our researchers: go.bsky.app/3QzdR9p
What would you like to see from us? Drop suggestions below!
07.04.2025 19:11 —
👍 259
🔁 90
💬 25
📌 13
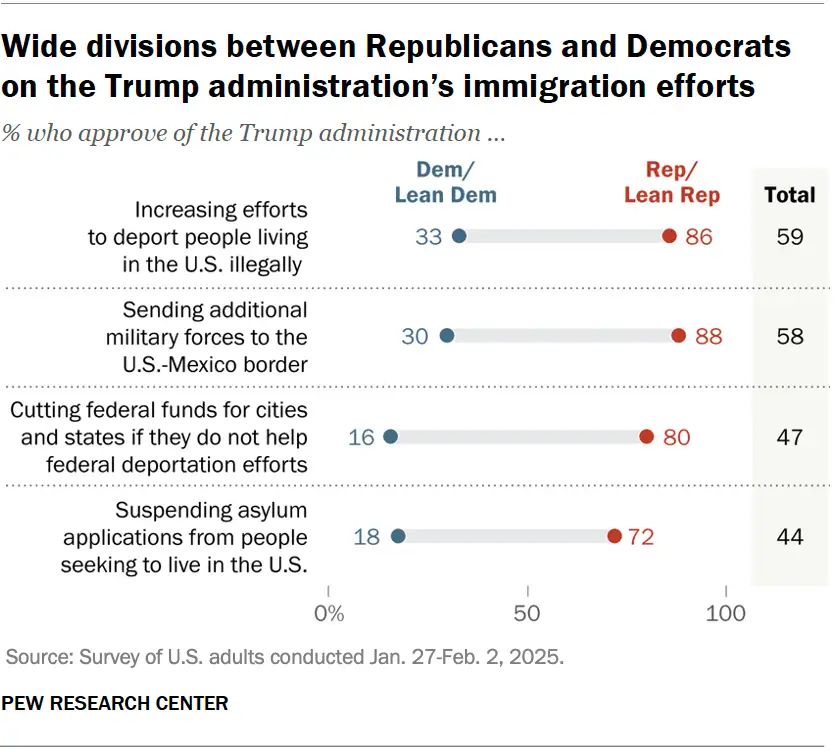
What Americans think about President Trump’s immigration actions early in his second term.
(@baxteroliphant.bsky.social Joseph Copeland @pewresearch.org)
More, via Opinion Today:
opiniontoday.substack.com/p/250209
09.02.2025 22:15 —
👍 0
🔁 1
💬 0
📌 0
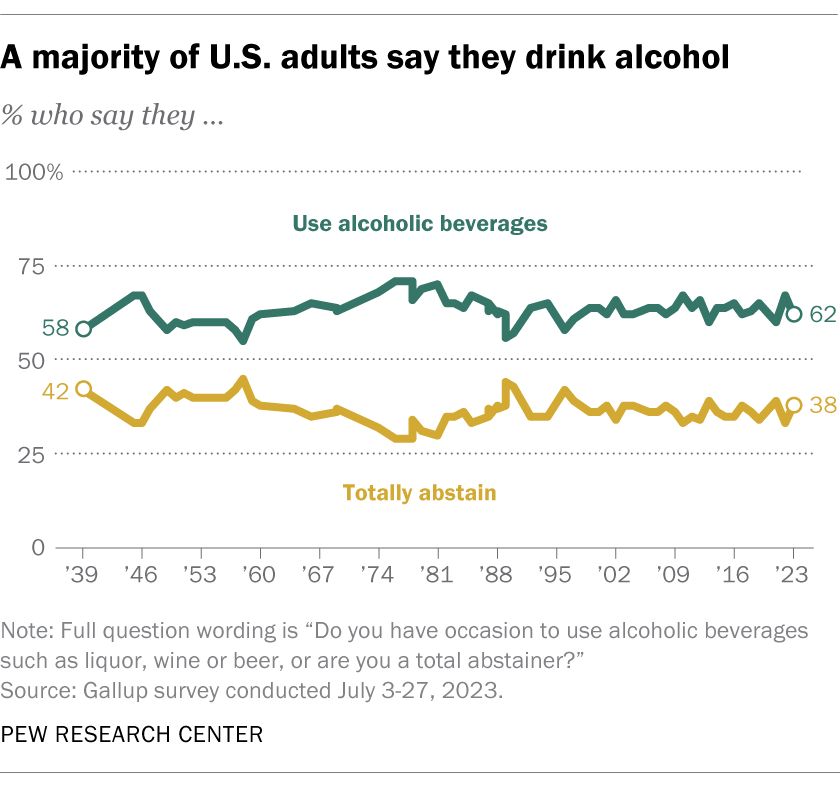
Line chart showing that a steady majority of Americans say they consume alcoholic beverages.
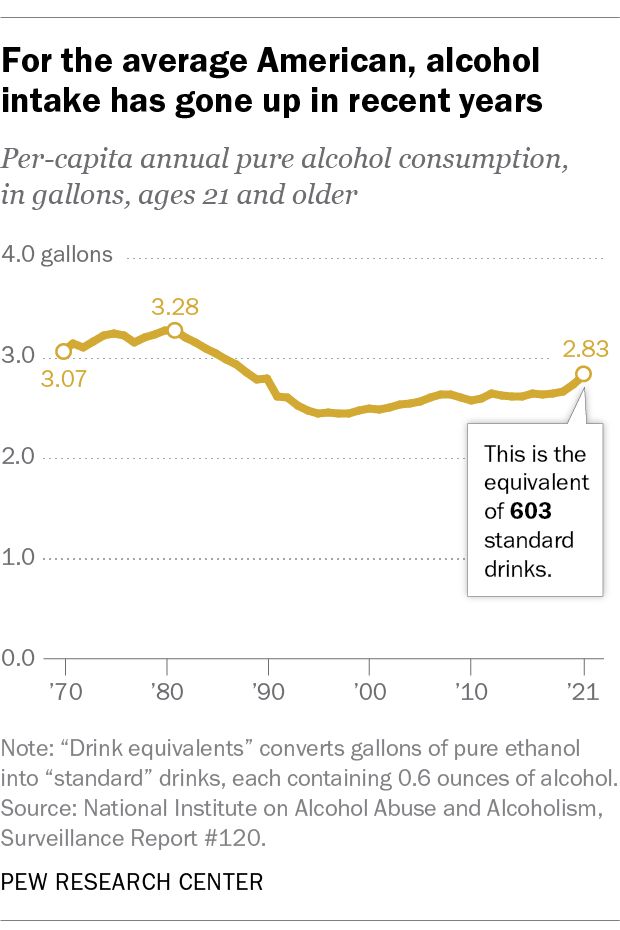
Line chart showing that alcohol consumption among Americans has ticked up in recent years.
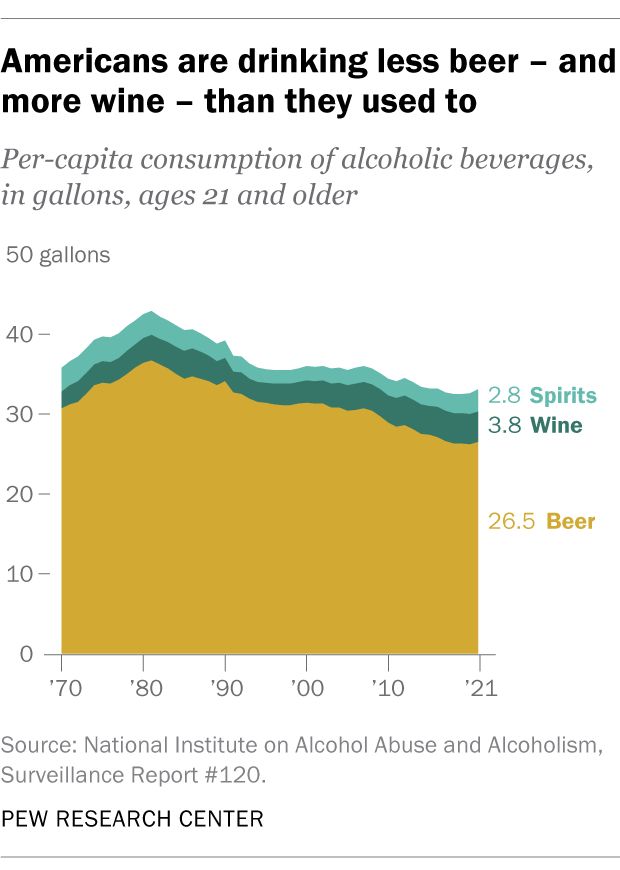
Area chart showing that Americans are drinking less beer and more wine than they used to.
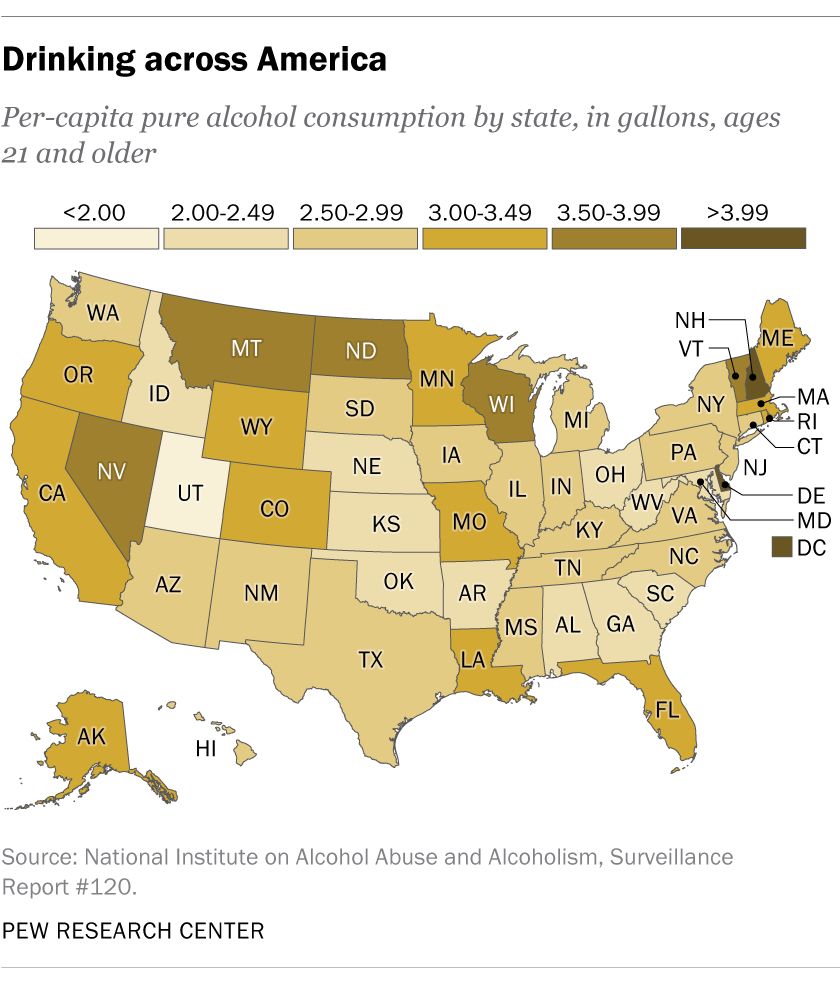
Map of the United States showing per-capita alcohol consumption by state.
10 facts about Americans and alcohol as ‘Dry January’ begins: www.pewresearch.org/short-reads/...
02.01.2025 16:40 —
👍 2
🔁 1
💬 0
📌 0
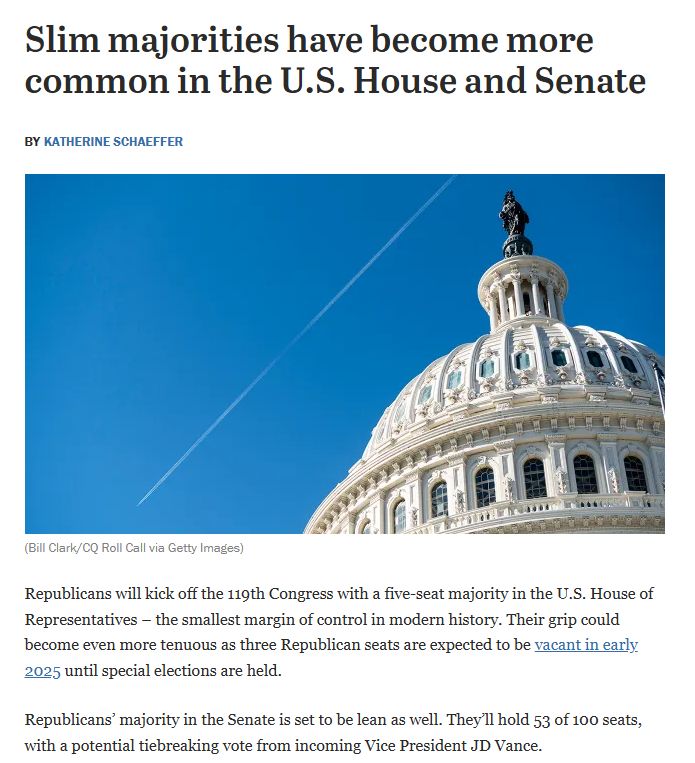
Screenshot of a Pew Research Center article titled, "Slim majorities have become more common in the U.S. House and Senate"
NEW: House Republicans will be working with the narrowest majority in modern history when the 119th Congress begins in January. They'll have a five-seat edge, but even that small advantage will get smaller amid several expected vacancies. www.pewresearch.org/short-reads/...
17.12.2024 20:07 —
👍 17
🔁 12
💬 0
📌 0
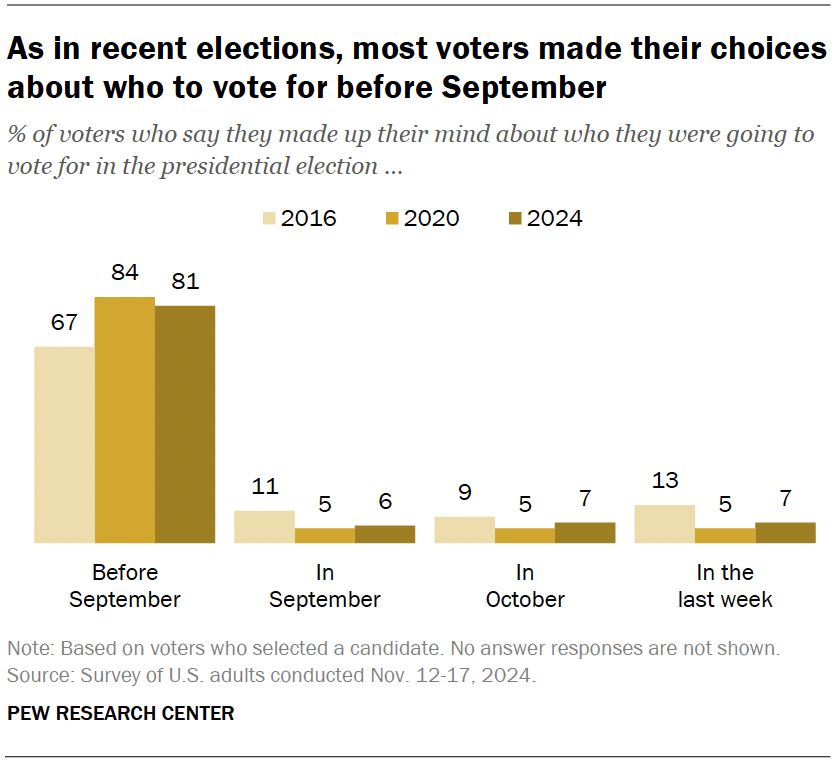
Chart showing that in the 2016, 2020 and 2024 presidential elections, the vast majority of voters made up their mind about who to vote for before September. Far fewer voters made up their minds in September, October or in the last week before the election.
Chart: When in a presidential campaign do voters make their decision? www.pewresearch.org/politics/202...
06.12.2024 14:08 —
👍 6
🔁 3
💬 1
📌 1
New from @gabrielborelli.bsky.social
22.11.2024 15:23 —
👍 0
🔁 0
💬 0
📌 0
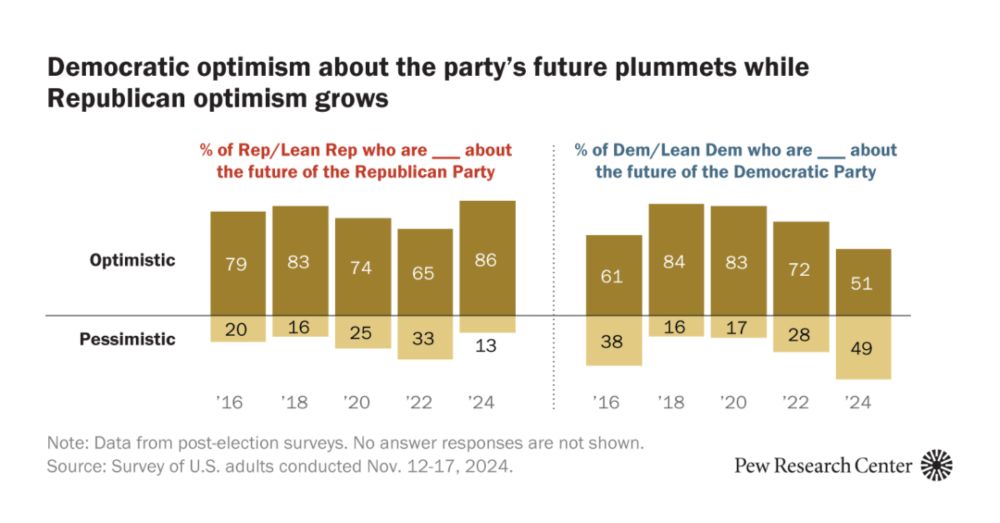
After Trump’s victory, Democrats are more pessimistic about their party’s future
The partisan gap in Republican and Democratic views of their parties’ futures (35 percentage points) is much larger than after any recent election.
New from Pew Research Center:
After Trump’s victory, Democrats are more pessimistic about their party’s future
49% of Democrats and Democratic-leaning independents are pessimistic about the future of their party; just 13% of Rep/Lean Rep say the same
www.pewresearch.org/short-reads/...
22.11.2024 15:20 —
👍 1
🔁 0
💬 1
📌 0
We've all been there! Looking forward to seeing more about the book
21.11.2024 15:10 —
👍 0
🔁 0
💬 0
📌 0
Very interesting data
Panel C has Republicans higher on disapproval? Is it possible the labels are reversed?
21.11.2024 15:03 —
👍 1
🔁 0
💬 0
📌 0
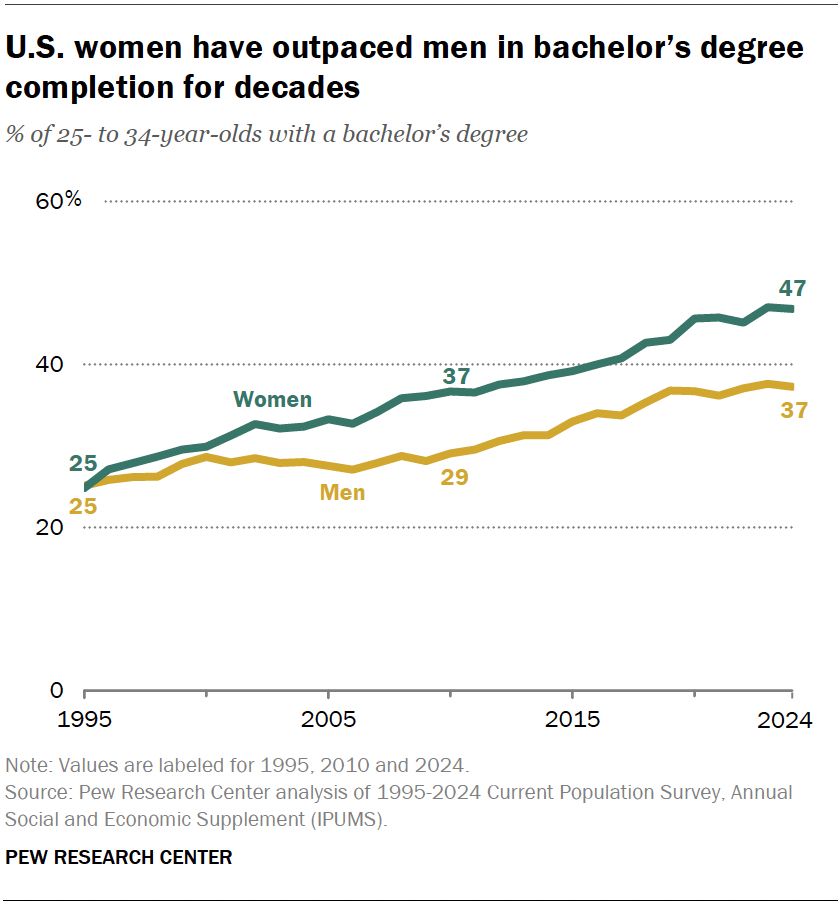
Line chart showing that women in the United States have long outpaced men in college graduation. As of 2024, 47% of women ages 25 to 34 have a bachelor's degree, compared with 37% of men in the same age group.
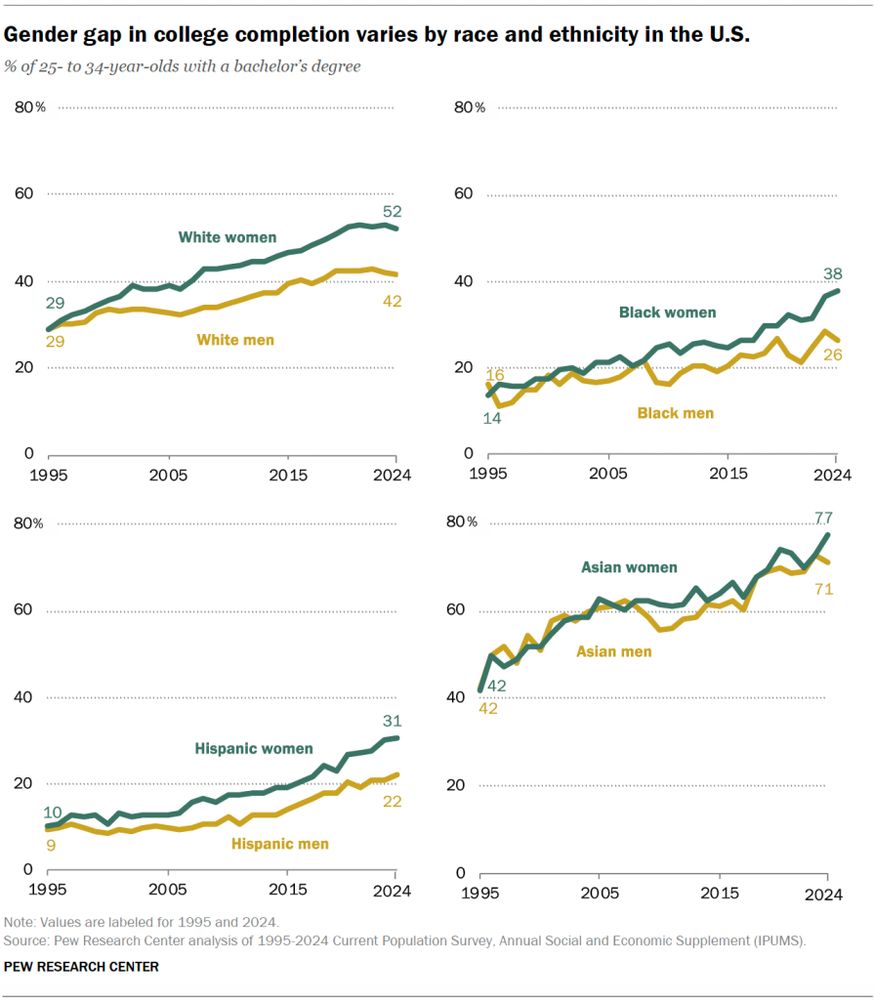
Four small line charts showing that women are outpacing men in college graduation in each of the four major racial and ethnic groups in the United States.
NEW: Women in the US have long outpaced men in college graduation, as the chart on the left shows. But it's now happening in each major racial and ethnic group, too, as the chart on the right shows. www.pewresearch.org/short-reads/...
18.11.2024 19:02 —
👍 12
🔁 7
💬 1
📌 1
Disney owns both The Muppets and Star Wars, and the fact they are not making a Muppet version of all nine main-series Star Wars movies is only explained by the fact that they secretly hate making money.
17.10.2024 05:17 —
👍 4385
🔁 757
💬 118
📌 86

How U.S. Public Opinion Has Changed in 20 Years of Our Surveys
We took a closer look at how Americans’ views and experiences have evolved on a variety of topics over the last 20 years.
NEW: To mark 20 years of the Pew Research Center, we took a look back at some of the biggest changes in US public opinion during that time. Of note: Complete reversals on same-sex marriage and marijuana legalization, and the emergence of China as a perceived threat.
18.09.2024 17:37 —
👍 4
🔁 4
💬 1
📌 2

AS WRITTEN
27.03.2024 21:08 —
👍 1260
🔁 345
💬 23
📌 16