
Archaeocyatha were sessile, filter-feeding, calcareous, sponge-like organisms, characterized by a conical, vase-shaped, or cylindrical skeleton. Their structure consisted of two porous, nested calcite cones (inner and outer walls) separated by a space called the intervallum, which contained vertical plates (septa, taeniae) or horizontal plates (tabulae). Root-like structures at the bottom (holdfast) secured them in place.
https://alchetron.com/Archaeocyatha

Primary reef builders during the Neoproterozoic (Ediacaran) and early Paleozoic (Cambrian, Ordovician, and Silurian). The Neoproterozoic is primarily dominated by microbial organisms including the stromatolites (see Geology Bites episode with Martin Van Kranendonk). The Cambrian is dominated by a variety of sponge organisms including the archaeocyaths. In the Ordovician and Silurian, coral and stromatoporoid species became the dominant reef builders. The red star denotes the approximate interval of the Mongolian reefs where some of the best-preserved archaeocyath reefs are found.
Cordie, D. R. et al. (2019), Palaeogeography, Palaeoclimatology, Palaeoecology 514, 206

Phosphatized internal molds of archaeocyaths from the upper Salaagol Formation in southwestern Mongolia.
Pruss, S. B. et al. (2019), Palaeogeography, Palaeoclimatology, Palaeoecology 513, 166

Modern calcareous sponges provide the closest analog to the archaeocyaths.
https://www.inaturalist.org/taxa/60583-Calcarea
🧪⚒️ I just posted an episode on the first reef builders with Sara Pruss of Smith College. These were sponges with skeletons. Their reefs fostered biodiversity, contributing to the Cambrian explosion. Listen, and give me feedback. #paleontology #earthscience
13.02.2026 12:18 —
👍 12
🔁 3
💬 0
📌 0

Hunga Tonga eruption on 15 January, 2022, was the largest eruption in our lifetimes. The plume reached a height of 58 kilometers and the explosion was heard in Alaska, 8,000 km away. The explosive power stemmed from the conversion of thermal energy to kinetic by the sudden conversion of a large amount of water to steam. The eruption took place at a depth of 850 meters, well above the ~2,200-meter depth below which the pressure is too great for magma to create steam. The image at right and the time-lapse videos below show the spreading of the volcanic ash in the atmosphere. Eventually that ash falls down to the surface.

As basaltic lava flows cool under ice, meltwater flows around the lava and this affects the direction of the thermal gradient. Columns appear at right angles to the steepest temperature gradient as the basalt cools and contracts. The chaotic directions of the columns in this lava flows in southern Iceland reflects this interaction between the lava, ice, and meltwater.

Hunga Tonga eruption on 15 January, 2022, was the largest eruption in our lifetimes. The plume reached a height of 58 kilometers and the explosion was heard in Alaska, 8,000 km away. The explosive power stemmed from the conversion of thermal energy to kinetic by the sudden conversion of a large amount of water to steam. The eruption took place at a depth of 850 meters, well above the ~2,200-meter depth below which the pressure is too great for magma to create steam. The image at right and the time-lapse videos below show the spreading of the volcanic ash in the atmosphere. Eventually that ash falls down to the surface.

The depth at which an eruption occurs determines the style of eruption. The Hunga Tonga eruption occurred at the relatively shallow depth of 150-200 meters below the ocean surface. The magma fragmented on its way up to the vent, creating a large surface area for contact between magma and water. This caused a very large volume of steam to be generated that greatly magnified the explosive power. The Havre eruption started at about 850 meters below the surface where the pressure was high enough to inhibit steam formation. The erupting magma remained coherent and formed clasts of pumice as it emerged, some of which were buoyant enough to float and form rafts, while the rest fell to the seafloor as giant clasts. In its later phases, the eruption moved to depths of over 1,000 meters, and the magma emerged effusively in thick flows forming a dome on the seafloor.
Manga, M. et al. (2018), Earth and Planetary Science Letters, 489, 49
🧪⚒️ I just released an episode with Michael Manga of UC Berkeley on how water affects volcanic eruptions, both here on Earth and elsewhere in the Solar System. The prime exhibit here is the 2022 Hunga Tonga eruption, the most powerful in a lifetime. Hope you enjoy listening!
20.01.2026 17:04 —
👍 8
🔁 4
💬 0
📌 0

Amazonian blackwater lake (left), rainforest, and whitewater river. The whitewater river is laden with sediments from erosion of the Andes.
Photo Rhett A. Butler for Mongabay

Miocene fossil palm pollen grain (40 µm across) from the Pebas Wetland System. This species and others found with it are characteristic of lacustrine-estuarine conditions with wetland vegetation, peripheral forest, and a diverse aquatic fauna.

The Amazon pink dolphin Inia geoffrensis is derived from a marine species.
Michel Viard

Modern plants that are still distributed in the former marine incursion pathway which is thought to have left a geochemical imprint in the soils on top of the Solimões/Pebas formation. It has been shown that the bedrock and soils of the Pebas/Amazonas are much richer due either due to general chemistry or chemistry related to marine incursions.
🧪⚒️ Just posted: Carina Hoorn on the evolution of the Amazon basin. It was the rise of the Andes and the subsidence induced by the subduction under S. America's W coast that drove diversification. Listen and find out why. #geology #earth #Amazon
25.12.2025 10:10 —
👍 17
🔁 3
💬 0
📌 1

How do planets get wet? Experiments show water creation during planet formation process
Our galaxy’s most abundant type of planet could be rich in liquid water due to formative interactions between magma oceans and primitive atmospheres during their early years. New experimental work…
How do planets get wet? 💦
A new study in @Nature, led by Carnegie’s Anat Shahar & #CarnegieAlum Francesca Miozzi (now at @ethz.ch), shows that water can form naturally during planet formation when hydrogen-rich atmospheres meet molten rock.
No comets required. (1/9)
👉 bit.ly/48QEOXr
30.10.2025 17:19 —
👍 1
🔁 2
💬 1
📌 0

Diagram showing the boundaries of the habitable zone for stars of different surface temperatures. The habitable zone is defined as the zone in which liquid water can exist. The models on which these results are based include the effects of greenhouse gases in the atmosphere, tidal locking, and other effects, some of which involve complex feedback mechanisms. These effects mean that at any given level of starlight incident on the planet, the habitable zone boundaries depend upon the temperature of the star, which is why the habitable zone boundaries are curved in the diagram. Various planets within our solar system are shown, along with selected exoplanets.
Kasting, J.F., et al. (2013), PNAS 111 (35) 12641

Photomicrograph of the diamond anvil used in Shahar’s high-pressure experiments. Between the diamond tips is a gasket that holds a silicate magma ocean-like sample prepared in the lab and the hydrogen. The diamonds are between 1/2 to 1 carat in size with the tip facing the sample being about 300 microns across.

Interaction of a hydrogen-rich gas with a magma ocean. Left: hydrogen dissolves in the magma ocean and water is produced in the magma through the reduction of iron oxide. Right: on a small body that is not fully molten, water may only be produced where molten magma (red) is present. The other colors represent the rest of the differentiated planetesimal.
Courtesy of Francesca Miozzi

Conceptual illustration of three possible scenarios for interior–atmosphere interaction in big planetary bodies, often referred to as sub-Neptunes (between 1 and 17 Earth masses). Left: free fluid water and Fe-enriched blebs are entrained in the magma ocean. Centre: water is outgassed to create a steam atmosphere while the Fe-enriched blebs sink toward the centre. Right: extreme scenario in which all phases are miscible.
Courtesy of Francesca Miozzi
🧪⚒️Just released: Anat Shahar of Carnegie Science on what makes a planet habitable. Her work shows that water may be very common on rocky exoplanets as a result of interaction between a hydrogen atmosphere and a magma ocean. #geology #exoplanets
03.12.2025 15:43 —
👍 3
🔁 2
💬 0
📌 1

Block diagram showing the internal components of the Misty pluton, which is one of the plutons of the Southern Fiordland batholith. A conduit rising through the lithospheric mantle feeds a sheet-like basalt structure, which in turn connects to steep-sided granitic bodies in the middle and upper crust (colored in mauve and pink).

Schematic cross section of an active continental margin subduction zone, showing the dehydration of the subducting slab, hydration and melting of a heterogeneous mantle wedge (including enriched sub-continental lithospheric mantle), and crustal underplating of mantle-derived melts. Remelting of the underplate to produce tonalitic magmas and a possible of crustal melting are also shown. As magmas pass through the continental crust they may differentiate further and/or assimilate continental crust.
Winter (2001) An Introduction to Igneous and Metamorphic Petrology, Prentice Hall

Western coastline exposure of the deepest, lower-crustal level shows steep feeder zones and conduits where mafic, crystal-rich magma was injected into lower-crustal diorites. Most of the rocks in the feeder zone here are hornblendites, which are composed almost entirely of hornblende. The hornblendites are thought to be modified products of mantle-derived melt.

Outcrop of fully-fledged dikes and thick pegmatites that occur away from the base of the Misty pluton. The coherent structure of the intrusion suggests the magma was emplaced into a fairly well-crystallized host capable of exhibiting brittle-like breaking. A crystal-rich host results from fractional crystallization and the progressive removal of the remaining melt. The horizontal alignment of the crystals suggests that the host mush has been compacted and enough melt has been removed to enable the crystals to align. At the same time, the undulose margins of the dike and the exchange of the dark hornblende crystals across its margin indicate that, although crystal-rich, the host was not fully crystallized and could still exhibit ductile behavior. This supports the general picture that as the host mush becomes increasingly crystal-rich as melts are gradually extracted, the dikes that move magma through the crystallizing mush become more organized and regular in shape. The dyke here is about 30 cm across.
🧪⚒️Just posted Keith Klepeis on how plutons form. He identified conduits, feeder dikes, and mushroom-shaped sheets that form as magma rises from the base of the crust to the upper crust. A tilted batholith in NZ provided him with a rare continuous exposure of 20 km of crustal section. #geology
13.11.2025 14:24 —
👍 25
🔁 6
💬 0
📌 1

GPS velocity field with respect to the Eurasian plate. The red vectors indicate data from a network of Chinese GPS receivers and the pink vectors are from other published results. Such results help constrain the various theories as to how the northward movement of India is accommodated. One particular controversy is the degree to which the movement is accommodated by slip along major bounding faults, such as the Karakoram fault or the Altyn Tagh fault. These results generally favor continuous crustal deformation rather than major movement along the faults.
Wang, W. et al. (2017) Geophysical Journal International, 208, 1088

GNSS receiver installed in the Southern Alps of New Zealand to measure uplift rates across the Alps.

InSAR observations of the earthquake sequence (a Mw 6.4 foreshock and a Mw 7.1 mainshock), which struck Ridgecrest, southern California in 2019. The figure shows observed (a, e), modeled, and residual InSAR interferograms. (b) and (f) are modeled by the best-fitting foreshock-only and (c) and (g) are the corresponding results for the mainshock-only. The colors denote ground displacement along the line-of-sight from the spacecraft ranging from almost 6 cm (red) to -6m (blue). A color key is shown at bottom right in (h). The figures show phase measurements, which wrap through each cycle every 11.8 cm of displacement. Such measurements reveal a complex pattern of coseismic movement dominated overall by a right-lateral motion.
He, L. et al. (2022), Journal of Geophysical Research: Solid Earth, 127, e2021JB022779
🧪⚒️In the latest Geology Bites podcast episode I talk to MIT's Tom Herring about high-precision geodesy. Nowadays, this means mm-level accuracy. The cost has plummeted and we'll probably see this in our phones soon. We talk about measuring plate motions, earthquake slow slip, and more. #geology
23.10.2025 14:58 —
👍 5
🔁 2
💬 0
📌 0

Map of Europe showing the main geological units as defined by their structural origin and presumed terrane provenance. As the map shows, practically all of central and southern Europe (shaded grey) was derived from Gondwana. These terranes contain Cadmonian and Lower Paleozoic basement rocks. The map also shows the main suture zones. A Alps, AM Armorican massif, B Balkans, BM Bohemian massif, BV Brunovistulia, CIZ Central Iberia Zone, D Dinarides, DO Dobrogea, EC Eastern Carpathians, H Hellenides, IM Iberian massif, IST Istanbul terrane, KB Kirsehir block, MC massif Central, MGCR Mid-German Crystalline Rise, MM Menderes massif, MP Malopolska block, MU Moldanubian unit, OMZ Ossa-Morena Zone, P Pyrenees, R Rhodope, S Schwarzwald, SC Scythian platform, SM Serbo-Macedonian massif, SPZ South Portuguese Zone, SX Saxothuringian unit, TBU Teplá–Barrandian unit, V Vosges.
Sen, F. (2021), International Geology Review 64, 2416
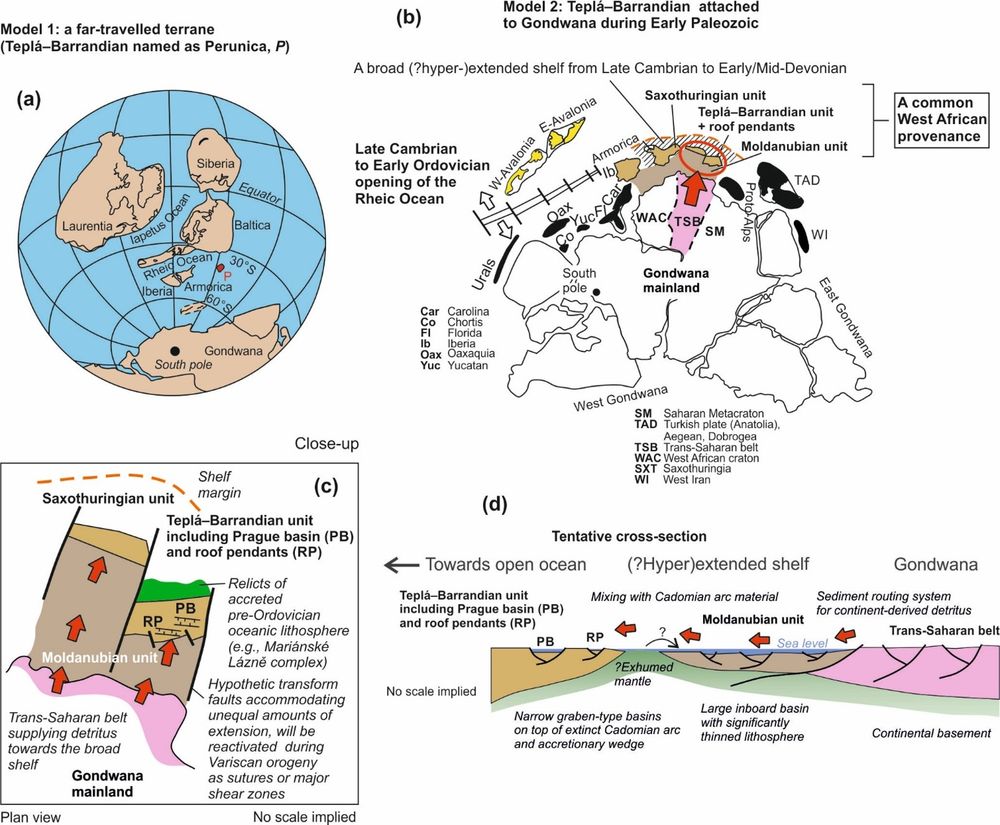
There is a debate as to how far the Cadomian terranes, specifically the major Teplá–Barrandian unit of the central Bohemian Massif, traveled away from Gondwana before they accreted to Baltica, eventually to become part of Europe. These figures illustrate contrasting models that have been proposed. (a) In this model there is a large separation between the Teplá–Barrandian unit and Gondwana, and the unit forms a completely detached microplate called Perunica (P). (b)-(d) In these models, there is little separation, and the Teplá–Barrandian unit remains part of the hyper-extended Gondwana shelf.
Žák, J et al. (2018), International Geology Review 60, 319

A paleogeographic model showing the break-up of the former northern Gondwanan Cadomian active margin in the late Cambrian and early Ordovician, opening of the Rheic Ocean, transition to an early Paleozoic passive margin, and, finally, the Laurussia-Gondwana collision to form the Variscan orogenic belt. The terranes discussed in the podcast form parts of Avalonia, the Saxothuringian and Ossa-Morena Zones, the Variscan Autochthon, and the Mid-Variscan Allochthon. The Saxothuringian Zone now makes up the northwestern part of the Bohemian Massif. The Ossa-Morena Zone now forms part of the Iberian Massif in Spain and Portugal. The Variscan Autochthon comprises geological units now mainly exposed in southern Europe. The Mid-Variscan Allochthon includes the Teplá-Barrandian and Moldanubian units of the present-day Bohemian Massif.
Catalán, J.R et al. (2021), Earth-Science Reviews 220, 103700

Geological map of the present-day Bohemian Massif. The geological structure is complex, largely as a result of the Cadmonian and Variscan orogenies. The map covers a region stretching from southern Poland in the north to northern Austria in the south. It reveals a section across the Variscan orogen from the outer foreland basins (Rhenohercynian) through low-grade Cadomian basement terranes (Saxothuringian and Teplá-Barrandian) to the exhumed high-grade orogenic core (Moldanubian).
Adapted from the Geological map of the Czech Republic 1:5,000,000 published by the Czech Geological Survey, Prague, 2007
🧪⚒️I just posted an episode on the orogenies that shaped central Europe: the Cadomian and the Variscan. The former took place on the northern margin of Gondwana, rifting north later to dock to Europe. The latter marked the final assembly of Pangea. It's complex, but I hope you enjoy it! #geology
06.10.2025 14:02 —
👍 13
🔁 4
💬 1
📌 1
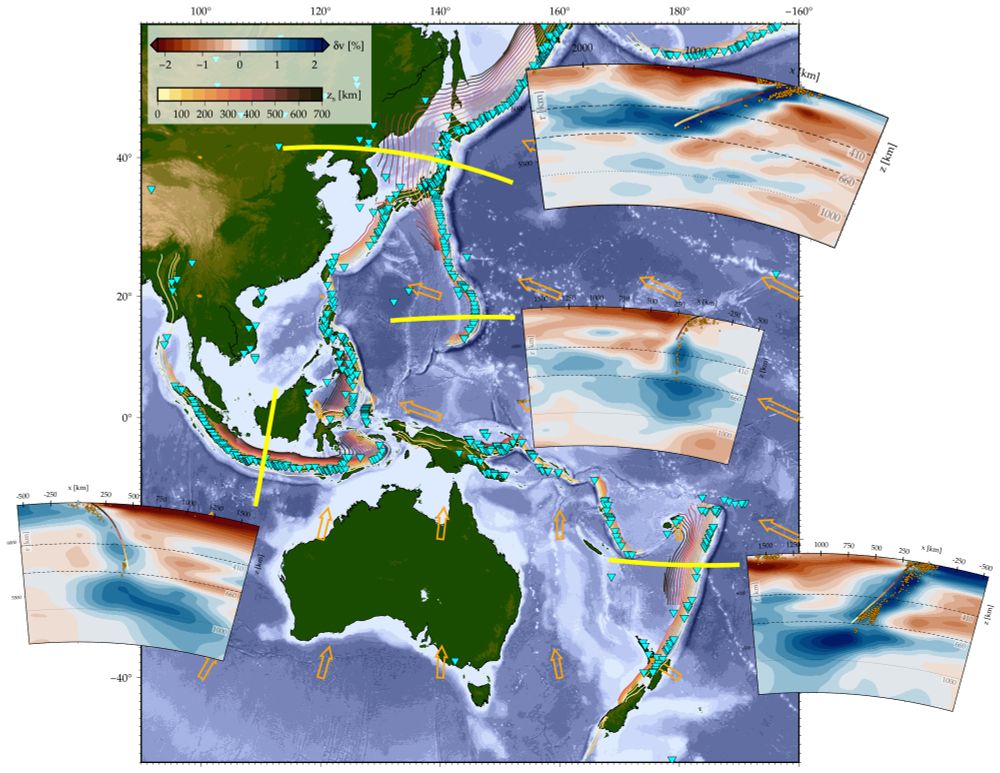
The figure shows sections of P-wave tomography anomalies along the yellow lines on the map (Fukao & Obayashi, 2013), seismicity (orange dots on profiles; Engdahl et al., 1998), plate velocities (orange vectors; Argus et al., 2011), and volcanoes (cyan inverted triangles; Siebert & Simkin, 2023). The Western Pacific and Japan subduction zones (the two most northerly zones) do not appear to penetrate the lower mantle, unlike those of Indonesia and Kermadec (north of New Zealand). Whether a slab penetrates the lower mantle depends on factors such as the duration of subduction and the angle at which the slab reaches the 660-km discontinuity, with steeper angles favoring descent.
Becker, T and Faccenna, C. (2025), Tectonic Geodynamics, Princeton University Press
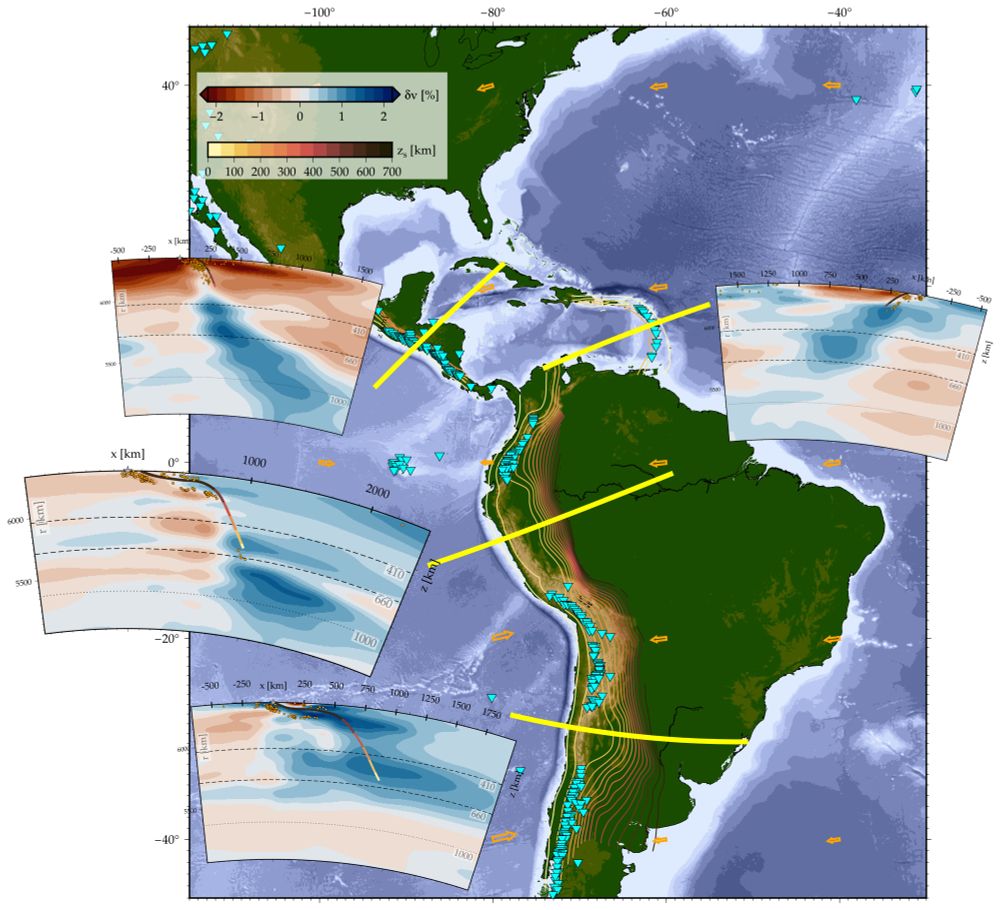
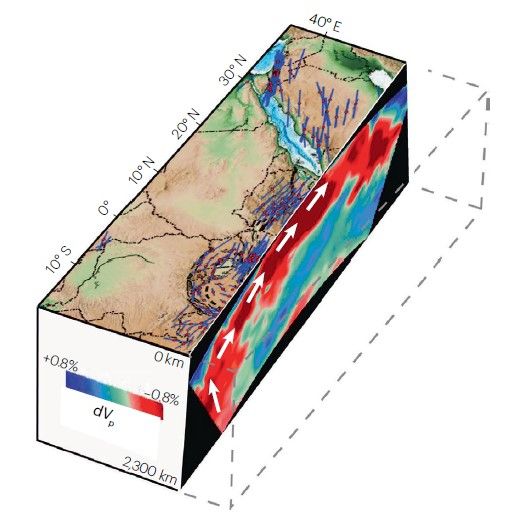
Subduction zones along the west coast of the Americas. In the podcast, Faccenna described how the slab subducting below the Andes has entered the lower mantle where its lateral movement is restricted by the higher viscosity there. The subduction zones beneath northern South America and Central America show evidence of penetration into the lower mantle, reaching depths of 1,300 km or more. By contrast, the younger Caribbean subduction zone does not.
Becker, T and Faccenna, C. (2025), Tectonic Geodynamics, Princeton University Press

Left: map showing seafloor ages in the western Pacific. The back-arc basins shown appear mainly as the red and orange regions, i.e., having the youngest ages of 0 and 30 million years. Center: more detailed seafloor age map of the Izu-Bonin-Marianas region. Right: P-wave tomography sections along the green lines labeled A, B, and C, revealing the varying shape of the subduction zone going from north to south.
The western Pacific subduction zone is characterized by back-arc extension in the overriding plate that began within the last 30 million years (left panel). Tomography and seismicity data show that along the Izu–Bonin region (section B1–B2), a double subduction system is present, resulting from subduction of both the Pacific Plate (to the east) and the Philippine Plate (to the west).
Becker, T and Faccenna, C. (2025), Tectonic Geodynamics, Princeton University Press

The Izu–Mariana subduction system is unique in that the trench is advancing toward the overriding plate (right panel). Bottom left: tomographic section along the red line on the map at right shows the two subducting slabs. Top left: numerical model of single subduction and double subduction. The double subduction simulation replicates quite a few features appearing on the tomographic section, such as the apparent flattening out of the subducting slabs between the depths of 400 and 600 km. In a single-slab system, the trench migrates backward, whereas in a double-slab system, the rear slab drives trench advance. The simulation also reproduces the tomographic section (bottom left, section along the red line on the map at right), which clearly shows the presence of two subducting slabs.
Faccenna, C. et al. (2018), Tectonophysics, 746, 229
🧪⚒️Just released an episode on the dynamics of subduction zones with Claudio Faccenna. Not only do trenches roll back and move laterally, they also advance and flip polarity. But when they penetrate the viscous lower mantle they get locked in place. Enjoy listening!
17.09.2025 16:24 —
👍 6
🔁 3
💬 0
📌 0

Van Staal studying the rocks of the highly deformed basaltic and bonninitic rocks of the c. 490 Ma Advocate ophiolite on the north coast of the Baie Verte peninsula. These are part of the the Baie Verte ophiolite complexes.

Reconstruction of continental plate locations in the Silurian and Devonian. Between 420 and 405 Ma, Laurentia moved south at a speed that may have been as fast as 11 cm/year while the Iapetus ocean was subducting beneath the margins of Laurentia. This led to the collisions of the Caledonian and Appalachian orogenies discussed in the podcast. AM=Amazonia; WA=West Africa; L=Laurentia; BA=Baltica; SIB=Siberia.
🧪⚒️I just released Cees Van Staal on the Origin of the Appalachians. The story is closely tied to the Caledonian orogeny across the Atlantic. But today's topography stems from the rifting and magmatism of the much later opening of the Atlantic and the recent ice ages ending 10,000 years ago.
17.08.2025 16:37 —
👍 29
🔁 5
💬 2
📌 0

Horizontal slice at a depth of 100 km showing relative variations in the speed of vertically polarized S-waves (Vsv). The mid-oceanic ridges in the Atlantic and South Pacific show up prominently, as do hot-spot regions with active volcanism, such as Hawaii (H), Iceland (I), the Canaries (C), and La Réunion (R). The model also shows the contrast between the old, cold cratons and hot spots in Africa.
Thrastarson, S. et al. (2024) RVEAL: A Global Full-Waveform Inversion Model, Bulletin of the Seismological Society of America
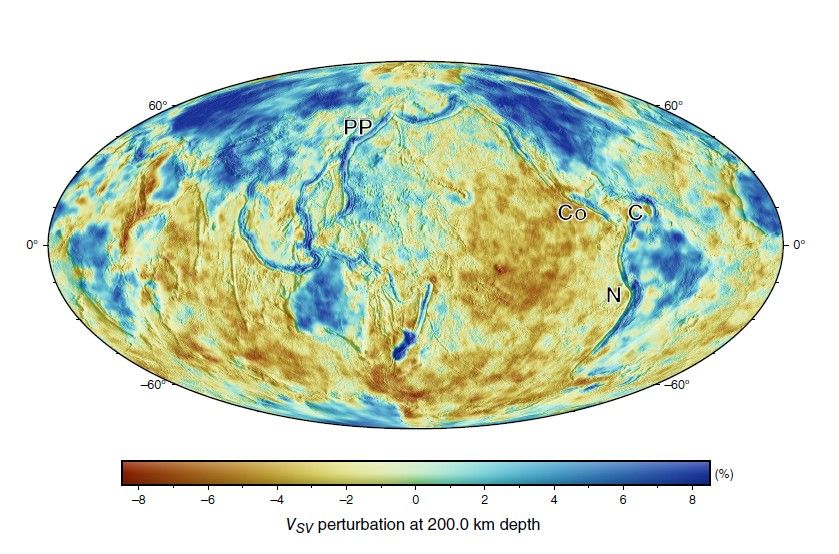
At a depth of around 200 km, subducting slabs come into sharper focus. The figure shows several of these, including the Nazca (N), Cocos (Co), and Caribbean (C) slabs, as well as the almost continuous subduction of the Pacific plate (PP) beneath its neighboring plates toward Asia and Oceania.
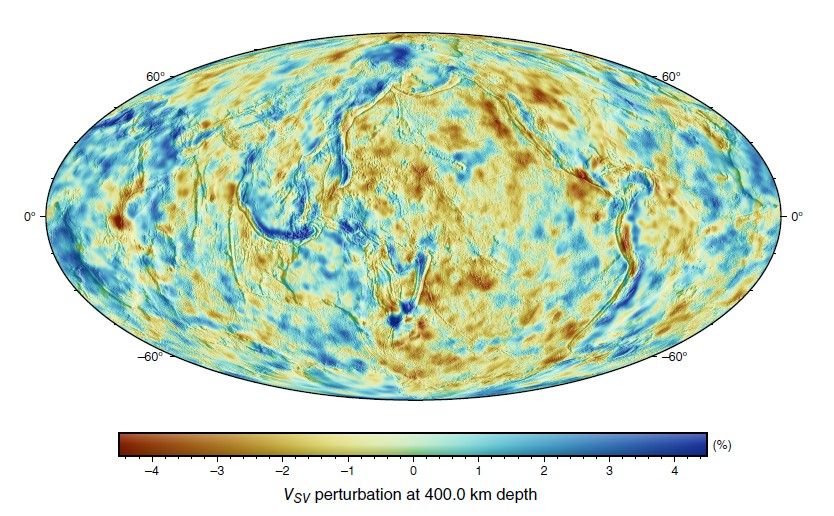
The slice at a depth of 400 km reveals the subducting slabs that have advanced deeper into the mantle along the direction of subduction.

Close to the core-mantle boundary at 2,800 km depth, the slice shows the large low-shear velocity provinces. These play an important role in our understanding of mantle dynamics and heat transport and are discussed in the podcast episode with Allen McNamara.
🧪⚒️Just released Andreas Fichtner on the frontiers of seismic imaging. Our images are becoming much sharper— see the episode web page. Really novel is the use of fiber-optic cables to sense seismic waves with unprecedented resolution.
22.07.2025 13:49 —
👍 3
🔁 0
💬 0
📌 0
🧪⚒️ Just reposting an invitation to listen to the latest Geology Bites episode on the origin of continents. Adding the 🧪⚒️ icons this time. Renée Tamblyn raises fascinating questions about the Archean water cycle and the role of molecular H in powering the first life forms - the archaea.
04.07.2025 10:58 —
👍 4
🔁 3
💬 0
📌 0

Sample of the Acasta gneiss, the oldest known rock (4.03 billion years old). It is a deformed tonalite-granodiorite and formed as a member of the type of intrusive rock discussed in the podcast. These formed the bulk of the early continents — the tonalites, trondhjemites, and granodiorites (TTGs).
Chip Clark/Smithsonian Institution National Museum of Natural History

Graph showing the amount of continental crust over time as predicted by different crustal growth models with time advancing to the left. The models use a variety of different methodologies and approaches and differ widely in their predictions. As Tamblyn says in the podcast, the timing of continental crust formation is one of the big unsolved problems in Earth science.
Korenga, J. (2018), https://doi.org/10.1098/rsta.2017.0408

Kaapvaal Craton, South Africa. The hills are formed of TTGs , which dominate the geological record of the craton.

When rocks undergo partial melting, they separate into lighter-colored leucosomes and darker melanosomes. The leucosomes then segregate themselves from the unmelted rock and, when they cool, form rocks containing predominantly plagioclase feldspar and quartz, i.e., TTG in composition. In the migmatite shown here, these melts have been frozen during their escape of the parent rock. The parent rock was a metamorphosed basalt containing garnet and amphibole.
Kendrick, J. et al. (2024), Journal of Petrology, 65, egae066
When the Earth formed, it was covered by a hot magma ocean. So when and how did thick, silica-rich continental lithosphere form? In the podcast, Renée Tamblyn addresses these questions, as well as how Archaean processes created molecular hydrogen that may have powered the first forms of life.
03.07.2025 16:08 —
👍 5
🔁 0
💬 0
📌 0
That’s great to hear, Brian.
18.06.2025 19:54 —
👍 0
🔁 0
💬 0
📌 0
Because continents are thick and cold, so generally strong.
03.06.2025 17:29 —
👍 2
🔁 0
💬 1
📌 0

Widespread faulting at the rift axis in the Afar region of northern Ethiopia.

Locations of active continental rifts with their extension velocities. In the podcast, Kolawole focuses on the East African rifting that extends from the northeast corner of the continent down to Malawi and Botswana. Though only in its early phase today, Kolawole explains why he thinks the rift will continue to stretch and eventually lead to a full continental breakup.
Heckenbach, E.L. et al.(2021), Geochemistry, Geophysics, Geosystems 22, e2020GC0095777
Schematic representation of the mantle plume location beneath East Africa on the basis of seismic tomography. Plume structure at depth is consistent with the distribution of volcanism shown at left.
Brune, S. et al. (2023), Nature Reviews Earth & Environment https://doi.org/10.1038/s43017-023-00391-3

Diagram of the driving forces, resisting factors, and weakening processes that accompany rifting. In the podcast, Kolawole points out the importance of pre-existing zones of weakness in a continent in determining where rifting initiates. The block diagram illustrates a preexisting shear zone (1) that can determine a rift location and also break a rift into segments (2). Faults and shear zones (3) can weaken the crust as can necking and thermal weakening (4). Shallow intrusion of melt (5) as well as alteration of the rock (6) can also cause weakening. Outside forces caused by erosion (7) and sedimentation (8) also promote long-lived faulting.
🧪⚒️Just posted Folarin Kolawole @lamont.columbia.edu on continental rifting. I've always thought that the rifting of continents is a really counterintuitive notion. After teasing out the various early stages with Kolawole and invoking plumes and far-field forces the process makes more sense to me.
02.06.2025 21:58 —
👍 9
🔁 3
💬 1
📌 1
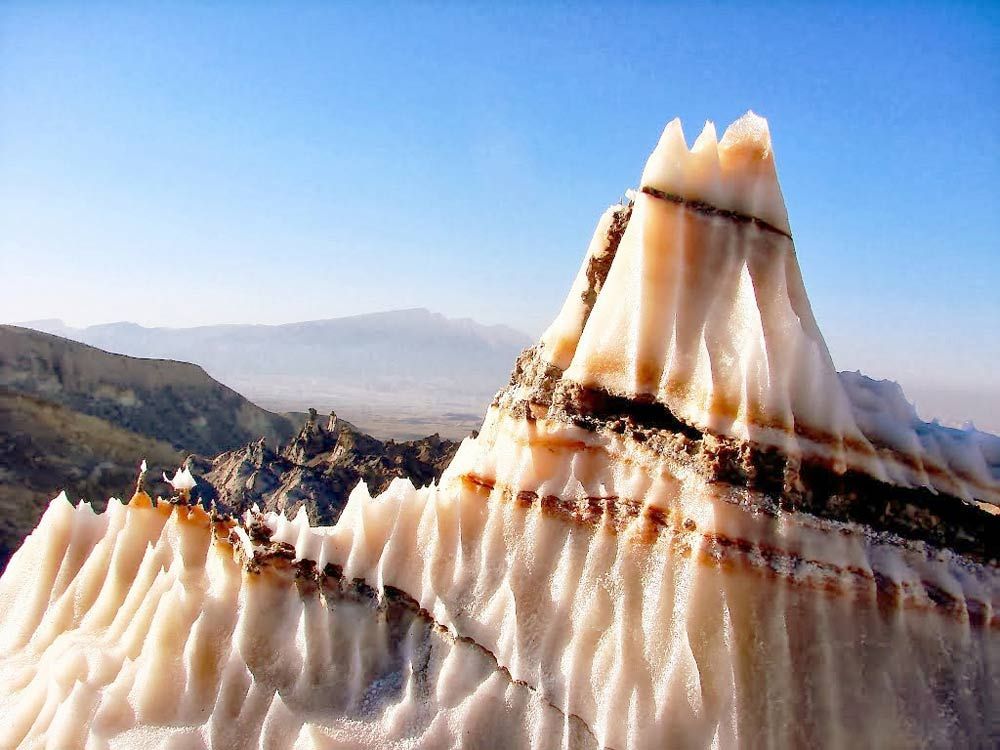
Salt mountain in the Zagros mountains of Iran.
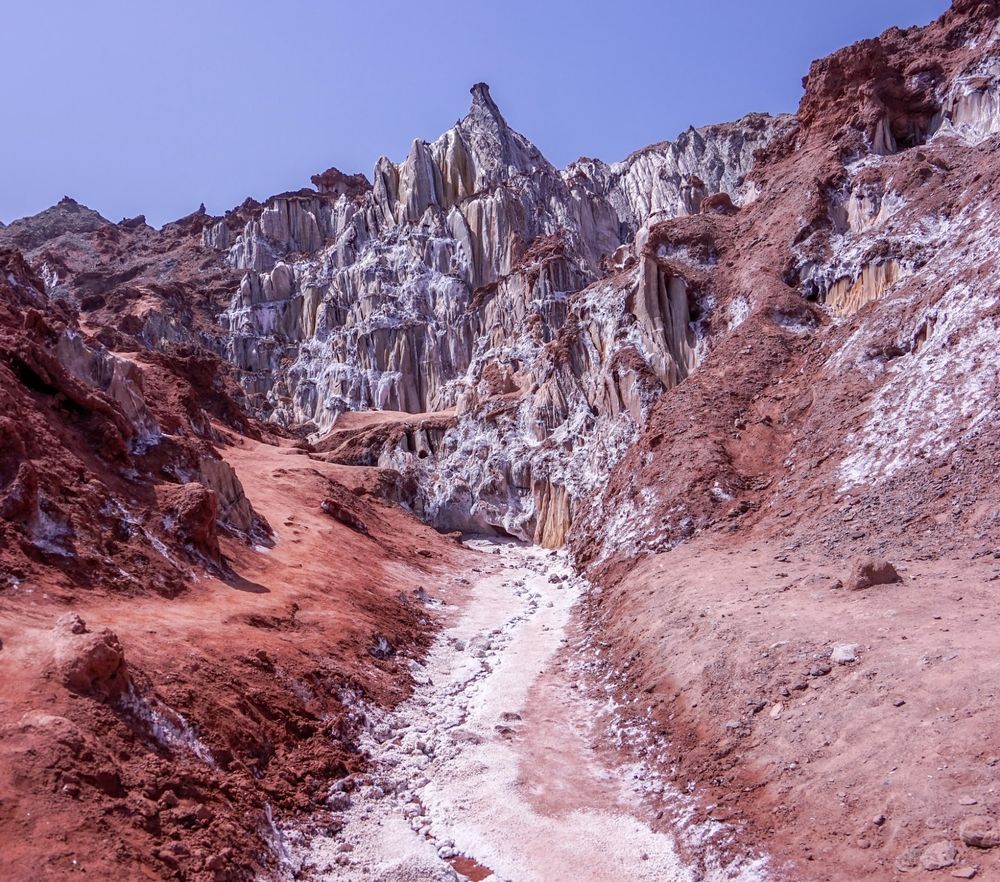
Salt mountain in the Zagros mountains of Iran. Courtesy of Kayvan Karimi.
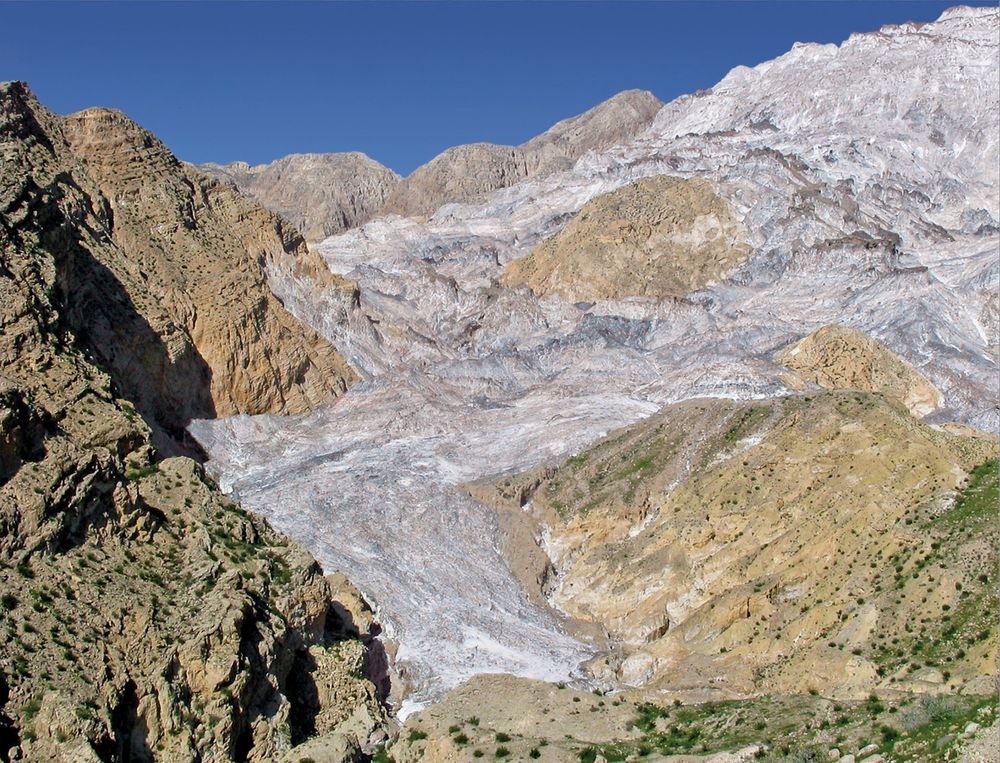
Salt glacier flowing down a valley in the Zagros mountains, Iran.
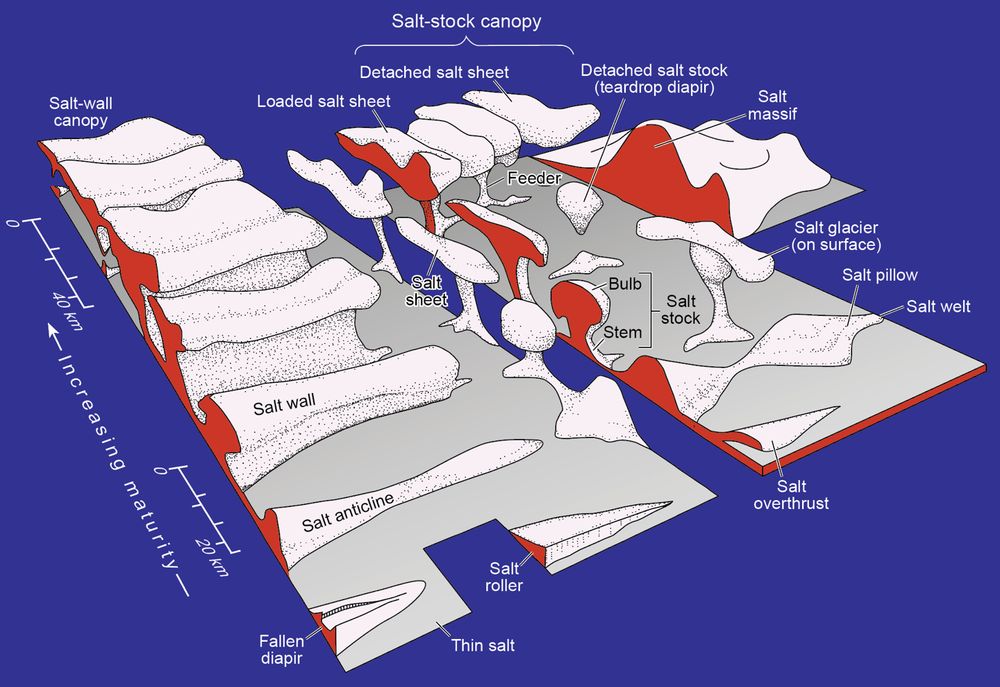
Block diagram showing the wide range of shapes that salt diapirs can assume.
🧪⚒️Just released Mike Hudec on salt tectonics. Amazingly, salt structures can be many tens of kilometers across. And because salt is extremely weak compared to other rocks and minerals, it is the first to deform in the presence of stresses. It's often involved in forming hydrocarbon reserves.
11.05.2025 16:55 —
👍 28
🔁 8
💬 0
📌 1
🧪⚒️Just back from the European Geophyiscal Union conference. The medalist lectures were great and I signed up two medal winners for Geology Bites. One exciting strand was on the planned probes to the icy moons of Jupiter & Saturn. We’ll be melting our way down through km of ice to reach water!
03.05.2025 21:08 —
👍 23
🔁 4
💬 0
📌 0

Until about 425,000 years ago, Great Britain was joined to Europe by a narrow isthmus along the Weald-Artois anticline, a fold consisting of the Cretaceous chalk that is today cut at the cliffs of Dover in England and the Cap Blanc Nez near Calais in France. As Baker discusses in the podcast, a large glacial lake formed south of an ice cap spanning northern Britain and Scandinavia. This lake eventually breached the isthmus, resulting in a megaflood that eroded what is now the seafloor below the English Channel into a steep-sided inner channel and plunge pools.

Map view (right) and topography (below right) of the Kasei Vallis megaflood channel. Kasei Vallis is the largest of the Martian outflow channels, about 3,000 km long and up to as much as 400 km wide in the areas shown at right.

Rock basins eroded into Columbia River Basalt at Lenore canyon, Lower Grand Coulee in the Channeled Scabland of Eastern Washington. Note the roads for scale.
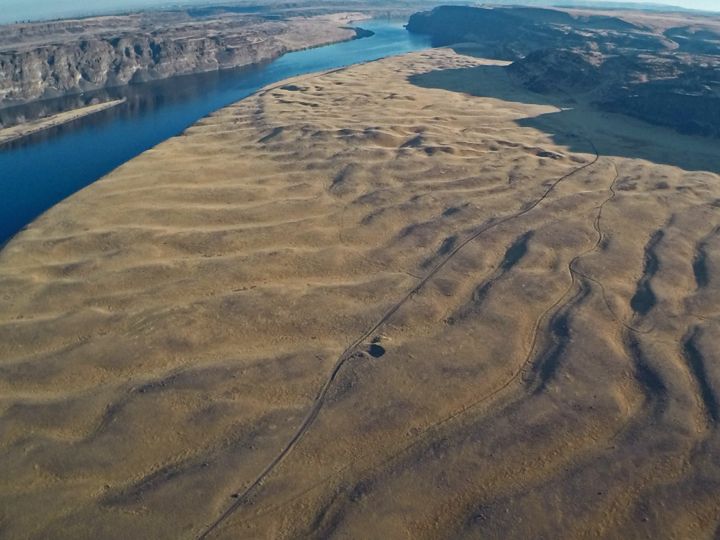
Giant current ripples at West Bar, near Trinidad, Washington.
🧪⚒️I just posted an episode on megafloods with Vic Baker, a pioneer in the field. Megafloods are cataclysmic events that devastate the landscape. The Mediterranean Basin was filled by two successive megafloods. And a Black Sea megaflood might be the basis for the Biblical account of Noah's flood.
13.04.2025 14:54 —
👍 42
🔁 11
💬 2
📌 0

Microwave image of a protoplanetary disk surrounding the young star HL Tauri. The disk includes gaps possibly cleared by amalgamation onto newly-forming planets. This image was taken by the Atacama Large Millimeter/submillimeter Array interferometer, consisting of 66 radio telescopes in the Atacama Desert of northern Chile.
ALMA (ESO/NAOJ/NRAO)

Artist’s impression of a region of a giant molecular cloud that is collapsing to form a protoplanetary disk of gas and dust. A star forms at the center of the disk, and planets form out of the disk.
NASA/JPL CalTech

Plot of various solar system materials. The plot shows that the isotope ratios of hydrogen (D/H) and nitrogen (15N/14N) on Earth are very different from those of comets but quite similar to those of a certain class of meteorites called enstatite chondrites. If comets had delivered Earth’s water, they would have changed its nitrogen isotopic ratios as well as its hydrogen isotopic ratios. Isotopic fingerprinting strongly suggests that Earth’s water has come from the enstatite chondrites.
Marty, B. (2012), Earth and Planetary Science Letters 313, 56
🧪⚒️New episode - Lindy Elkins-Tanton on the origin of Earth's water. Only about 0.02% of the Earth is water, but even that's been a puzzle as Earth formed within the snow line where no liquid water would have been present. Isotopic analysis provides the clues to resolve this apparent paradox.
27.03.2025 19:46 —
👍 12
🔁 3
💬 3
📌 2

The December 2024 version of the international chronostratigraphic chart. The right-hand part of each column lists the stages/ages. Each stages is a specific, formally defined interval of rock strata that represents a corresponding interval of time called an age. Golden spikes are marked at the base of the stages they define.

Golden spike at the base of the Selandian Stage, Zumaia, Spain.

Locations of golden spikes as of early 2020. The circles are color-coded according to the colors of their corresponding stages on the chronostratigraphic chart.
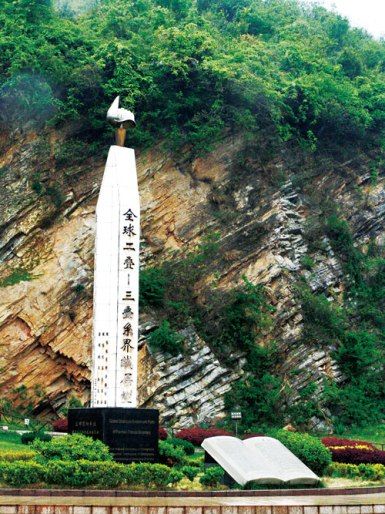
Monument at the golden spike at Meishan, China, marking the boundary between the Permian and the Triassic. There is also a geological museum at Meishan. It includes a hall on the golden spike and an enlarged model of a conodont species, which makes its first appearance above this golden spike and is key to the definition of the base of the Triassic.
🧪⚒️In this episode, Joeri Witteveen says there is something paradoxical about selecting a single point on Earth to define a global boundary. We also place spikes where the depositional record is continuous. But that is also a bit paradoxical, as such places do not look like boundaries at all.
16.03.2025 19:55 —
👍 15
🔁 0
💬 0
📌 0

Results of the Earth-System Model for atmospheric CO2 levels of 280 parts per million (ppm) and 560 ppm for the late Paleozoic. Top row: sea ice forms at 280 ppm but not at 560 ppm. Bottom row: at 280 ppm, the late-winter mixed layer of the ocean is moderately deep but becomes much shallower at 560 ppm.
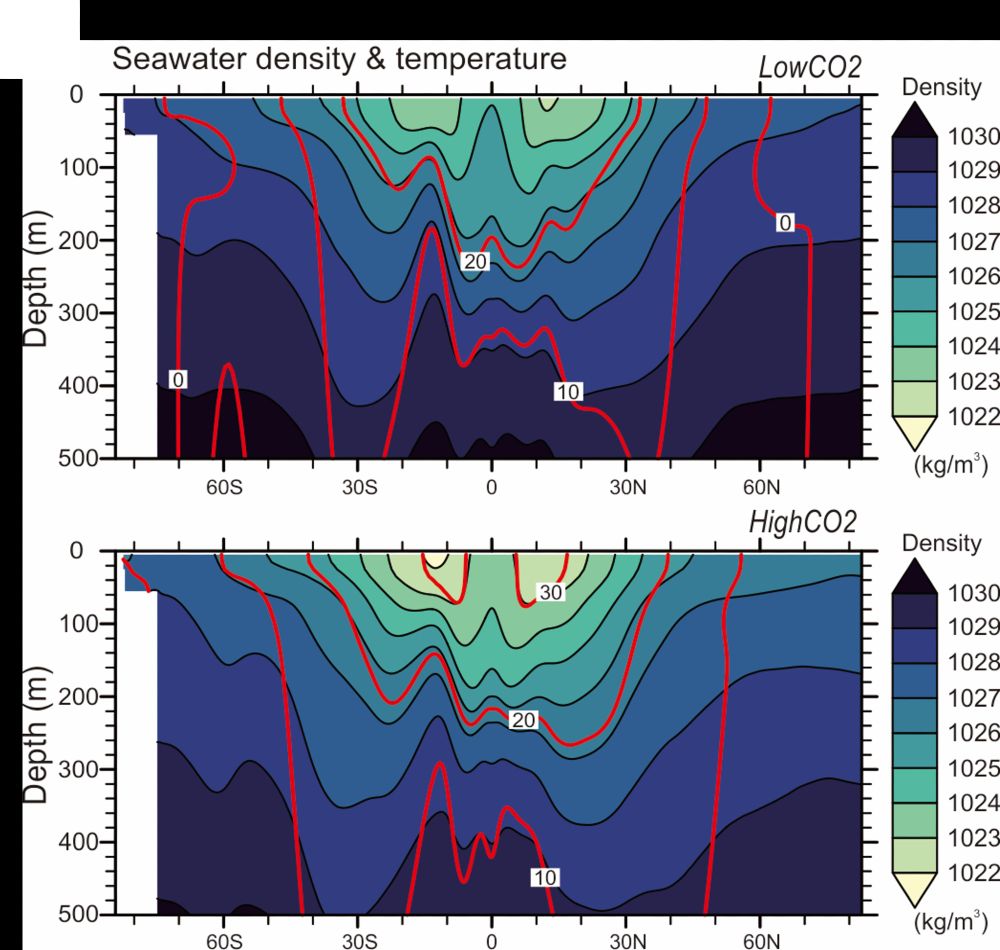
Simulations show the response of seawater density & temperature by depth for a doubling of CO2. Sea surface salinity (i.e., density) increases at low CO2 due to sea ice formation, which excludes salt, thus creating briny water, whereas at high CO2 less sea ice formation leads to decreased density overall.
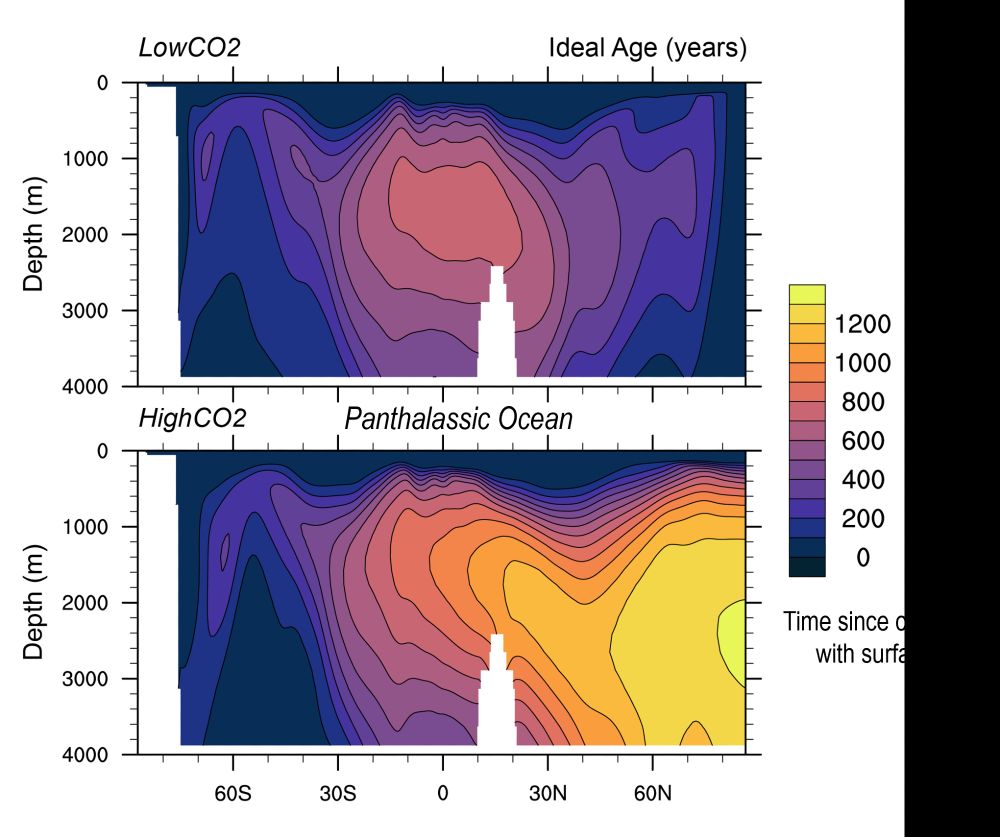
Plots of oceanic depth vs. latitude of the time since a water mass has been in contact with the surface.
Younger ages in shades of purple indicate well-ventilated waters, whereas older ages in orange and yellow indicate poorly ventilated waters that typically correlate with low dissolved O2 in the deep ocean.
Together with the sea ice and mixing depth results, this suggests the onset of widespread seafloor anoxia during the CO2-forced warming despite being under deep glacial conditions.
🧪⚒️I just posted an episode about using the late Paleozoic ice age as an analog to climate conditions today. It was similar in that there was low but rising CO2 and continental ice sheets. Her models suggest possible major ocean anoxia and dramatically increased runoff as CO2 climbs.
08.03.2025 18:55 —
👍 14
🔁 4
💬 2
📌 0

I just learned that Richard Fortey passed away yesterday. I loved his books, especially Life and Trilobite. It was so lucky that I managed to get him onto Geology Bites for the second time, this time talking about Deep Time. He was his usual eloquent self, full of insights.
08.03.2025 18:44 —
👍 47
🔁 9
💬 3
📌 4
I loved his books - especially Life and Trilobite. I was lucky to have recorded a second podcast with him on Geology Bites only two months ago. It was about Deep Time.
08.03.2025 18:41 —
👍 0
🔁 0
💬 0
📌 0
I devoured Richard Fortey's books as a teenager. His magnum opus, Life, was one of my gateways into science.
Then when I was writing my first pop science book, Richard generously blurbed it. Getting his testamonial was one of the proudest moments of my life.
RIP to a great scientist & writer.
07.03.2025 20:44 —
👍 57
🔁 7
💬 1
📌 0

Santa Maria del Fiore Cathedral and Baptistry. Brunelleschi kept good accounts of the sourcing of the Pietra Serena sandstone used to build the dome. Decorative white marble was sourced from Carrara and Pisa, pink limestone came from Verona and other locations in Tuscany, and green serpentinite came from Prato.

Nautiloid in the pale-brown stone walls of Plantation Place. This is an Upper Jurassic limestone sourced from the Southern Frankonian Alb of Bavaria. It comes from the Treuchtlingen Formation, representing a marine platform limestone with sporadic sponge reefs and bioherms (reef knoll comprising a pile of calcareous material that had previously accumulated on an ancient sea floor).

St. Paul’s cathedral in London, completed in 1710, was built with Portland Stone. There is a rich archive documenting architect Christopher Wren’s ordering of Portland Stone from the quarries.

Monument commemorating the Great Fire of London of 1666 which started close to this site and raged across the City for the next three days. The main building material is Portland Stone, the stone chosen by Christopher Wren and his fellow architects to rebuild London in a monumental style.
🧪⚒️ Just posted Ruth Siddall @pavementgeology.bsky.social on #urbangeology. You can see so much geology on display in the building stone of almost any city, and often more clearly and certainly more conveniently than going to the field. She guides us through her favorite London urban geology walk.
21.02.2025 15:23 —
👍 28
🔁 13
💬 0
📌 1
In this episode, Richard Fortey and I have kept the discussion fairly broad so that it can be appreciated by listeners with no background in Earth science. Since it's a bit different from other episodes, I'd especially welcome any feedback.
09.01.2025 12:48 —
👍 5
🔁 0
💬 0
📌 1
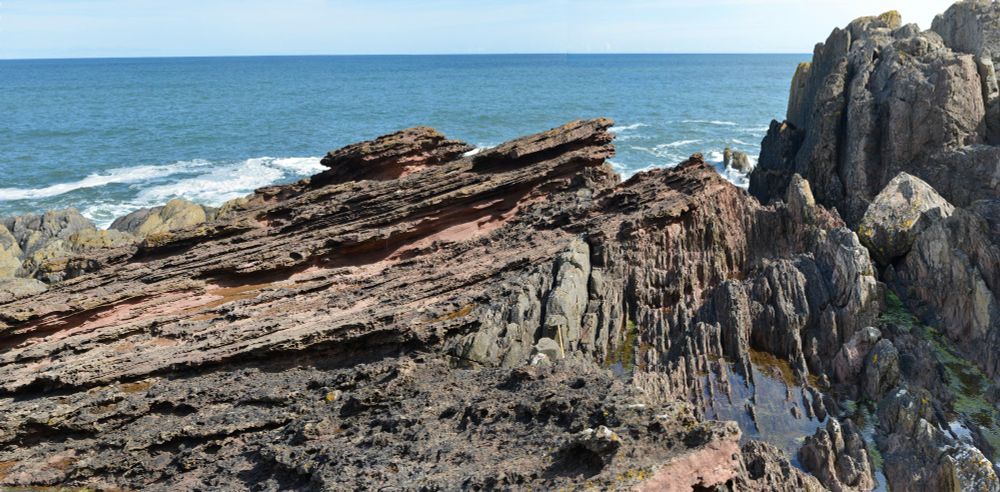
The major angular unconformity at Siccar Point on the east coast of Scotland. Here the more gently sloping Devonian sandstones (c.375 Ma) overlay the near vertical Silurian greywackes (c.440 Ma). Viewed by James Hutton while on a boat trip in 1788, this was one of the sites that solidified Hutton and Lyell's new concepts of Earth's geology: that it was formed by slow continuous processes similar to those still occurring today operating over vast periods of time.

Title page of Usher’s Annals of the World. Bishop Usher (1591-1656) calculated the date of Creation to have been nightfall on 22 October, 4004 BC. He determined this from a literal reading of the Old Testament.

Clock of the Long Now
Prototype of the Clock of the Long Now. It was activated on December 31, 1999, and is on display at the Science Museum, London. The clock is intended to keep time for 10,000 years. The final version of the clock is intended to be an enormously enlarged version of this prototype — a vast mechanism big enough for visitors to walk through and installed near a National Park in Nevada in a chamber hollowed out of a limestone cliff.
The clock uses a torsional pendulum that rotates slowly, making the clock tick once every 30 seconds. This prototype is driven by falling weights (right), but the full-size clock would be powered by the energy from footfalls of visitors or by changes in temperature. Any drift in the clock’s rate will be corrected by a mechanism sensing the sun passing overhead at noon.

Portrait of James Hutton, often referred to as the “Father of Modern Geology.” Here is the final paragraph of this 1788 paper Theory of the Earth.
WE have now got to the end of our reasoning; we have no data further to conclude immediately from that which actually is: But we have got enough; we have the satisfaction to find, that in nature there is wisdom, system, and consistency. For having, in the natural history of this earth, seen a succession of worlds, we may from this conclude that there is a system in nature; in like manner as, from seeing revolutions of the planets, it is concluded, that there is a system by which they are intended to continue those revolutions. But if the succession of worlds is established in the system of nature, it is in vain to look for any thing higher in the origin of the earth. The result, therefore, of our present enquiry is, that we find no vestige of a beginning,--no prospect of an end.
🧪⚒️ On to the 2nd century of podcasts with Richard Fortey on deep time. Fossils in the geological record were our first markers along the runway of deep time, providing the structure and language within which our modern conception of deep time emerged. #science #geosciences #geology+rocks+Fossils
09.01.2025 12:34 —
👍 17
🔁 5
💬 1
📌 0
Hi Mae, thanks for adding me to the science feed. I used the test tube emoji for the last 2 posts, which is what you suggested. There appear to be many other hashtags relating to geology. Do you know if there is a listing somewhere? Thanks for doing all this work - I bet the pay is lavish!
21.12.2024 19:16 —
👍 1
🔁 0
💬 1
📌 0

Photograph of the Pamir and Karakoram looking east, taken from the International Space station.
Photo: Tim Peake and NASA; geological interpretation: Searle, M. P., et al. (2018), Geol. Soc. London Special Publication 483
🧪Geology Bites now has 100 episodes! I hope it will be enough to carry you through any quiet moments during the holidays. Do give me feedback and suggestions and spread the word. #geology #earthscience
21.12.2024 14:52 —
👍 20
🔁 2
💬 0
📌 2
