
Annual epi update on bloodstream infections and C. difficile infections in England.
Continuing worrying trend of increasing rates of most of these infections, especially for community-onset cases
Annual epi update on bloodstream infections and C. difficile infections in England.
Continuing worrying trend of increasing rates of most of these infections, especially for community-onset cases
👏 finally appreciation for the huge team effort contributing to this report & surveillance - from the healthcare staff at NHS acute trusts who are submitting the data on regular basis, to the epidemiologists crunching the data & everyone providing input.
26.09.2025 21:46 — 👍 2 🔁 0 💬 0 📌 0
📊 Mortality
• 30-day case-fatality rate (CFR) fell or stayed stable (except MSSA ↑ 5.2%).
• 30-day mortality rate rose for most infections (in line with incidence rises).
• Graph ⬇️ with data up to 2022/23 shows CFRs across the infections - P. aeruginosa & MRSA among highest CFRs (23-26%)
More on these health inequalities in this research article by @andmazzella.bsky.social et al.
26.09.2025 21:46 — 👍 1 🔁 0 💬 1 📌 0
⚖️ Ethnicity & deprivation
• Black & Asian groups show the highest age-standardised incidence for most infections (except CDI → highest remained in White group).
• Deprivation: the most deprived areas had 1.5-3.1x higher age-sex standardised incidence vs least deprived.

Clostridioides difficile infections
⚠️ ↑ ~50% since 2020/21 to 33.3 per 100k – the highest since 2011/12. Driven by both hospital- and community-onset cases.
See more on recent CDI rises in this technical report:

MSSA bacteraemia
↗️ Year-on-year increases continue following the pandemic dip (similar to E. coli), reaching ↑ 12% (unlike E. coli) pre-pandemic levels at 24.2 per 100k.
Community-onset cases were the main driver.

MRSA bacteraemia
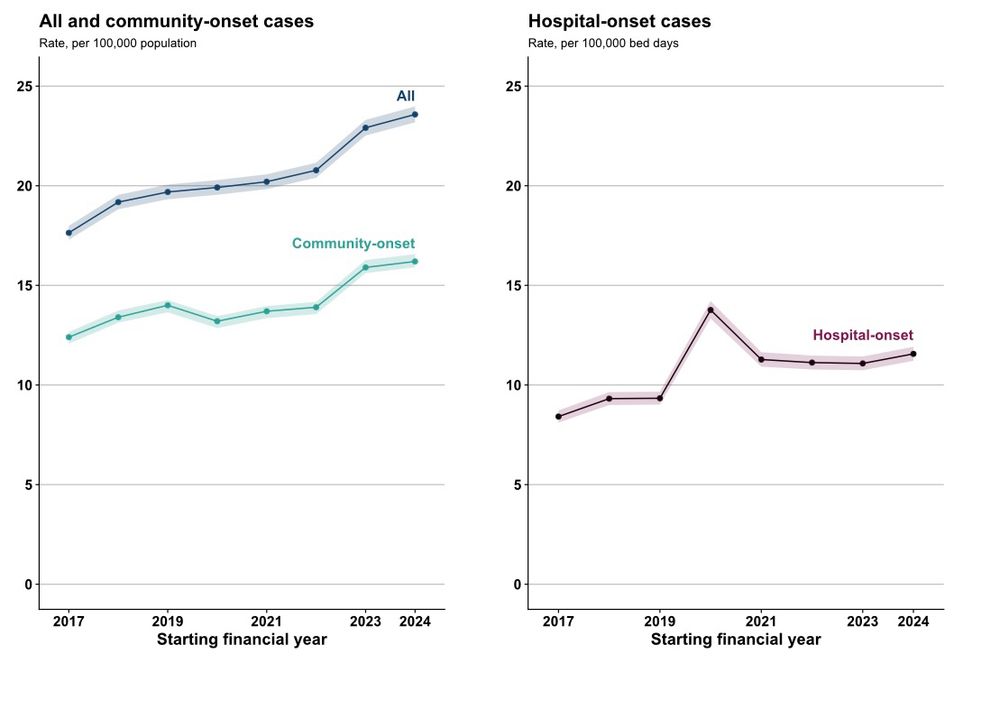
⚠️ Sharp ↑ 29.5% to 1.9 per 100k vs 2018/19. Reaching a 12-year high & biggest annual increase since surveillance began. Both hospital- and community-onset driving the rise.

Pseudomonas aeruginosa bacteraemia
↔️ Incidence has mostly remained steady → 7.8 per 100k in 2024/25.
🏥 Hospital-onset incidence = 4.8 per 100k bed-days.
Klebsiella spp. bacteraemia
↗️ Last year saw the sharpest increase since surveillance began - ↑ 10.3%.
Incidence rose again this year to 23.6 per 100k (+2.9% vs 2023/24).
Largely driven by community-onset infections. While most age-sex groups saw rise, particularly notable among male 75+ years.

E. coli bacteraemia
⤴️ In 2024/25, cases rose 17% since 2020/21 → 76.6 per 100k. This rise follows the COVID-19 pandemic dip and is now back to levels similar to those seen in 2018/19.
Most (81%) remain community-onset.
🆕 Our Annual Epidemiological Commentary on 6 key HCAIs was published this week - using England national mandatory surveillance data 🦠.
#hcai #surveillance #epidemiology
Some key highlights ⬇️

My colleague Olisa has a new article out in Eurosurveillance looking at the epidemiology of Gram-neg BSI in England.
Loads of interesting data: incidence, mortality rates and CFRs for E. coli, Klebs and P. aeru.
www.eurosurveillance.org/content/10.2...

Key public health message for the article: What did you want to address in this study and why? Socioeconomic inequalities exist across infections. We wanted to assess if the incidence of common bacteraemia varies across deprivation level and ethnic groups in England and to quantify any differences. The aim was to identify high-risk population groups and areas for public health interventions. Between 2018 and 2022, we investigated bacteraemia caused by Escherichia coli, Klebsiella and Pseudomonas aeruginosa bacterial species as well as by meticillin-susceptible and resistant Staphylococcus aureus (MRSA, MSSA). What have we learnt from this study? In England, bacteraemia from E. coli, Klebsiella spp., P. aeruginosa and particularly MRSA disproportionately affected people from the Black and Asian ethnic groups, after adjusting for age. In contrast, the White ethnic group had higher incidence of community-onset MSSA bacteraemia. People living in the 20% most deprived areas of England also had higher age-standardised incidence of all bacteraemia (176.7 compared to 91.7 per 100,000 population per year in the 20% least deprived areas), and especially MRSA bacteraemia. What are the implications of your findings for public health? Public health agencies and health research organisations should consider stratifying their analyses by ethnicity and deprivation to identify and quantify health inequalities. Further studies including qualitative research is required to identify the root causes of these concerning inequalities in the incidence of bacteraemia caused by different pathogens, so that adapted measures can be designed to mitigate them.
Does the incidence of common bloodstream infections vary across deprivation level & ethnic groups in England and can differences be quantified?
Read what @andmazzella.bsky.social @acciochoc.bsky.social @cstewartb.bsky.social & @amelia-andrews.bsky.social et al found
⬇️
bit.ly/EUS309bc
#IDSky 😷🦠 ⚕️
The big question is: why do we see these sad inequalities?
Difficult to say: complex intersection of factors.
People living in more deprived areas and certain ethnic minorities tend to be more affected by:
💔 predisposing comorbidities
💸 poverty
🏫 low educational attainment
⚕️barriers to healthcare

In England, people from ethnic minorities or living in more deprived areas are disproportionately affected by bloodstream infections.
We've shown this with our latest study, just been published on @eurosurveillance.org.
A thread 👇🏼
Featuring quotes by @greyson.bsky.social & @formerantivax.bsky.social.
Note the importance of lack of judgement here. If you're going to interact w/folks who haven't vaccinated their kids, being assholes to them isn't a great strategy. You don't know their reasoning. /1

We’re really excited to be joined by Dr Issy Centeleghe for IPC Journal Club on Weds 26th February on “Pulling the plug on the sink drain”. Register here: events.teams.microsoft.com/event/8443a2...
10.02.2025 15:13 — 👍 2 🔁 1 💬 0 📌 1
📊 What do we know about bloodstream infections in #CriticalCare units in England between 2017 and 2023?
Our new study used national #surveillance to find out.
www.mdpi.com/2076-2607/13...
The incidence of CCU-associated BSI surged by 75% during the first year of the COVID pandemic. Why?
[🧵 1/9]
Hope your 3 o’clock meeting didn’t push you over the edge 🙃
04.12.2024 21:28 — 👍 0 🔁 0 💬 1 📌 0