
Both of these upcoming cohorts are sitting at about 1/3 full with a week to go.
I'm really puzzled as to why registration has been so slow.
Somewhat in desperation, there's now the code SIXTY you can use for 60% off registration.
Both of these upcoming cohorts are sitting at about 1/3 full with a week to go.
I'm really puzzled as to why registration has been so slow.
Somewhat in desperation, there's now the code SIXTY you can use for 60% off registration.
Um this is so cool?!? Congrats!
26.06.2025 19:02 — 👍 1 🔁 0 💬 1 📌 0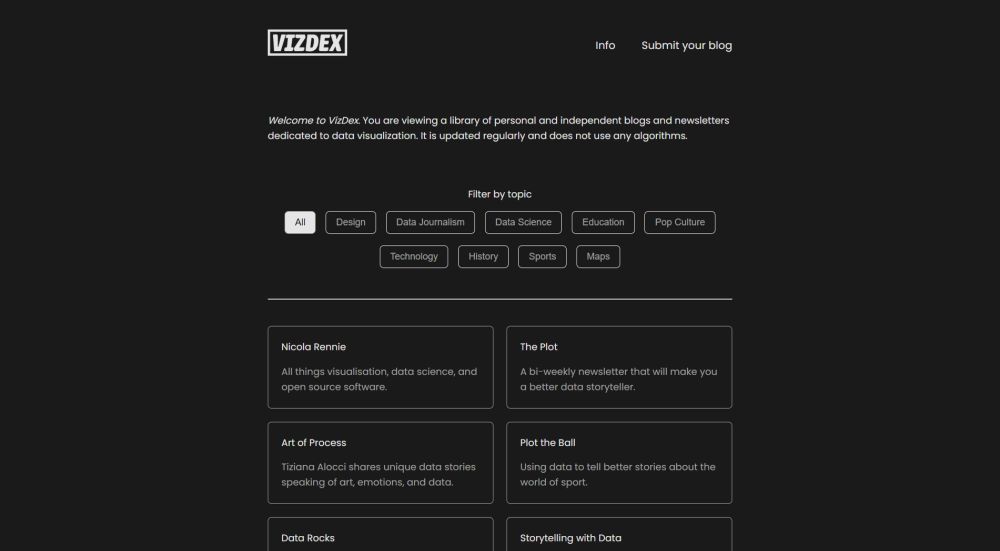
Introducing VizDex!
An ever-growing library of personal and independent blogs and newsletters dedicated to data visualization.
vizdexproject.com
“Revolutionaries balk at the strictures of striated spaces and attempt to smooth them. Governments balk at the uncontrolled and uncontrollable nature of smooth spaces and seek to striate them.” Still digesting but this stood out to me. Thanks for sharing!
13.06.2025 17:31 — 👍 0 🔁 0 💬 0 📌 0
Next up at #outlier2025, Zan Armstrong introduces diagnostic charts - the middle ground of really useful charts beyond simple “explore” or “explain” charts - some fascinating science-inspired examples!
11.06.2025 19:23 — 👍 10 🔁 2 💬 0 📌 0
I've checked the box on "despair." Guess it's time to "get back to work."
Inspired by @albertocairo.com's advice, in this new EffAff post, Gabby and I consider how simple visualizations 📊 of social change might encourage resilience on the path ahead.
effaff.com/hope-despair...
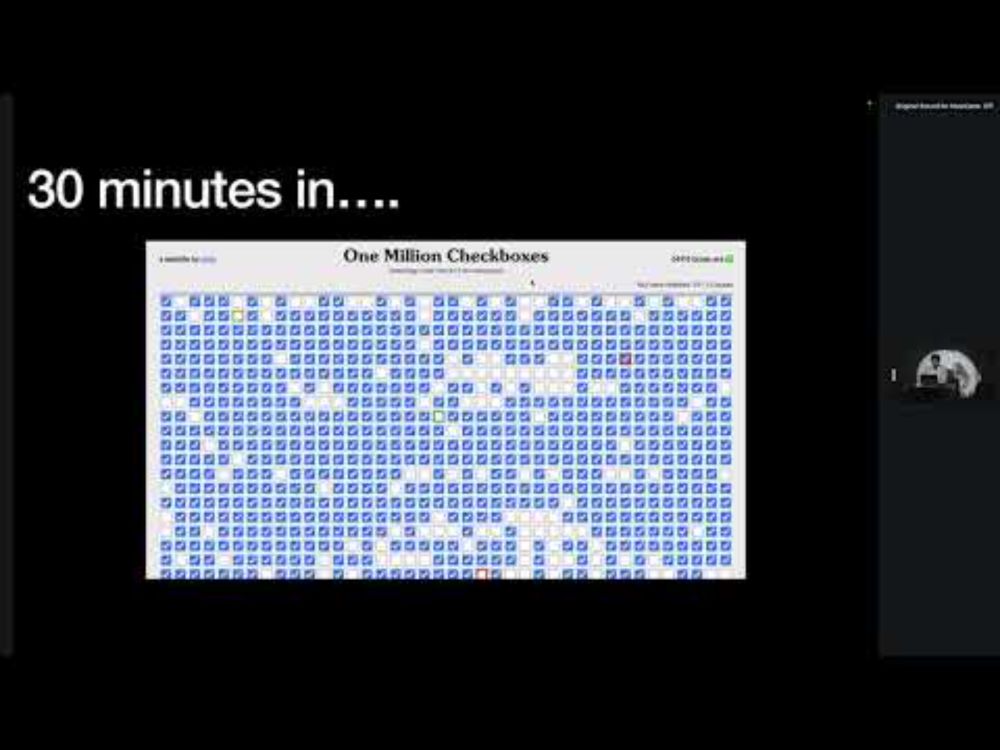
One Million Applause for One Million Checkboxes 👏✅👏✅👏
Check out @itseieio.bsky.social's brilliant talk on games, connecting strangers, and how some very smart teens subverted his code and touched his heart ❤️🔥
youtu.be/j2elKdupD6c

A bitly warning about a potentially harmful link
Would love to sign up but seeing this when I click on the link! Could be just on my end.
24.01.2025 20:11 — 👍 0 🔁 0 💬 1 📌 0This course not only introduced me to the world of birding but also reignited my interest in creative coding! It taught me what a fun/creative/supportive coding environment *could* look like, full of whimsical sketches and whacky ideas. Would highly recommend!
23.01.2025 20:52 — 👍 5 🔁 1 💬 1 📌 0Love this!
15.01.2025 22:33 — 👍 3 🔁 0 💬 0 📌 0
Ready, set, scroll! How long does it take you to scroll through a million pixels? Find out with @priyamisner.bsky.social's millionpixeldash.com
Reply with your times 😁
Whew thought I’d be way faster! Million Pixel Dash // 10.7 seconds
🏃♂️⬜️⬜️🟨🟨🟩🟩🟦🟦💨
Ooh would you recommend?? I’m interested 👀
05.01.2025 00:24 — 👍 0 🔁 0 💬 1 📌 0👏 Love how this turned out! Can’t wait to try it.
02.01.2025 14:46 — 👍 1 🔁 0 💬 0 📌 0
project 1: Map Designer, a #dataviz tool and @figma.com plug in that simplifies the process creating and customizing maps in Figma! Had a lot of fun learning how to translate d3-geo's svg paths into Figma's vector networks.
try it out and let me know what you think! www.figma.com/community/pl...
Thanks for giving it a look! Glad you enjoyed it.
12.12.2024 20:19 — 👍 1 🔁 0 💬 0 📌 0Wrote up a lil blog post about implementing a Beeswarm chart 📊 using Svelte 5 + D3! This is me learning/sharing as I go so I probably (definitely) got some stuff wrong 🙃 If you have a better approach for force simulations in Svelte 5 lmk! here.luisavasquez.com/thoughts/bee...
12.12.2024 16:58 — 👍 22 🔁 3 💬 1 📌 0Wow I love this idea. Now I want to try mapping my own projects, it’s a fun exercise to think of which dimensions would make sense 🤔
26.11.2024 01:08 — 👍 1 🔁 0 💬 0 📌 0Wow as someone who also always starts by sketching I love seeing this process 🤩
17.11.2024 20:54 — 👍 2 🔁 0 💬 0 📌 0
I'm going to run through all of the regional variants. One of the magic parts of this project is that while the code base is the same, the natural geography of the place and the human habits of the birders means they're all different in form and color.
Ready?
🧵
Excited for more panel chats! I really enjoyed the last one.
12.11.2024 01:45 — 👍 0 🔁 0 💬 0 📌 0What a great write up, thanks for shedding light on this issue!
28.06.2024 16:30 — 👍 1 🔁 0 💬 0 📌 0
What if each U.S. National Park had a cookie-cutter section removed and placed on a giant chessboard for easy comparison? My latest, with Wendy Shijia Wang: charts.substack.com/p/delicious-...
27.06.2024 14:40 — 👍 21 🔁 12 💬 0 📌 2These are incredible - what an immense amount of work!!
19.06.2024 19:49 — 👍 2 🔁 0 💬 0 📌 0Can’t wait for this talk!
11.06.2024 19:03 — 👍 1 🔁 0 💬 0 📌 0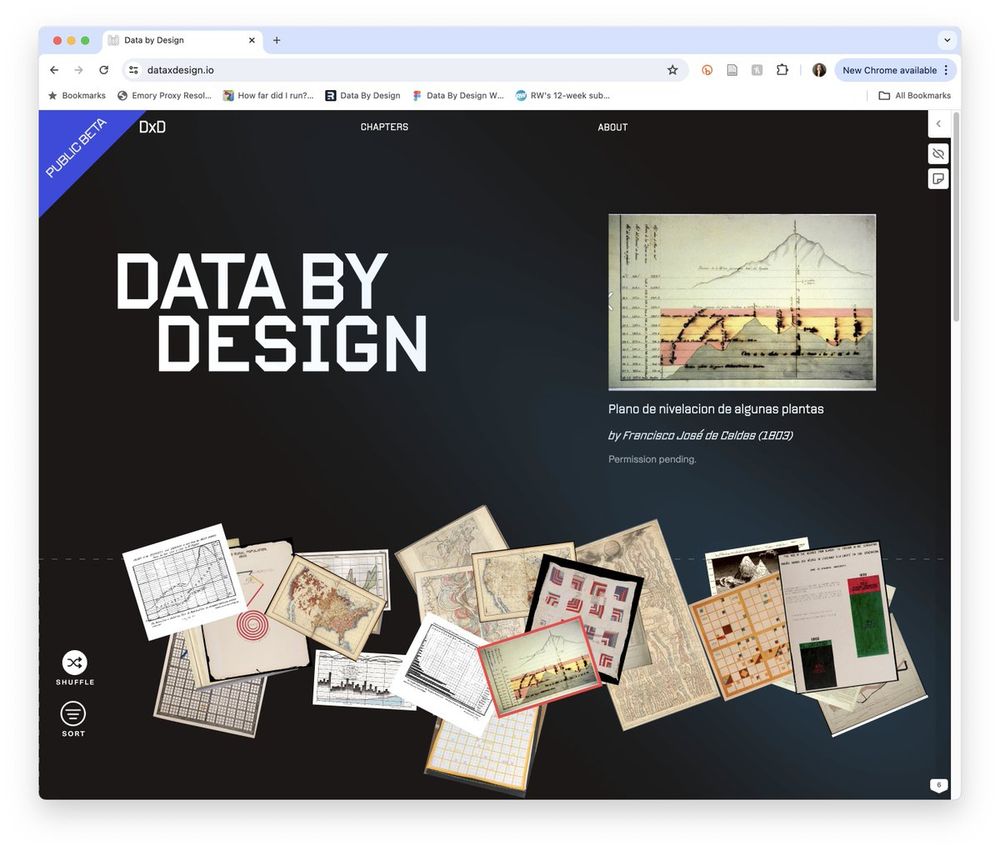
A screenshot of the front page of the Data by Design website, featuring a bunch of charts in a jumble and one, of a mountain and measurements by Francisco José de Caldas, featured at the top right.
I am beyond thrilled to share that DATA BY DESIGN: AN INTERACTIVE HISTORY OF DATA VISUALIZATION, 1789-1900 is now open for community review at 💚 📊 dataxdesign.io 📊 💙. It's the work of 15+ people across 5 institutions, 2 continents, 2 babies, and a global pandemic. A 🧵 but first:
21.05.2024 14:32 — 👍 230 🔁 90 💬 9 📌 3
Header area of story that reads: "I'd rather walk: Exploring 'walkable' areas in Charlotte, NC based on what matters to me by Luisa Vasquez"

Chart that uses images of 45 RPM vinyls to show the difference in time needed to walk to the library in Cambridge, MA vs. Charlotte, NC. There are 2.5 4 min vinyls needed in Cambridge, and 24.8 4 min vinyls needed in Charlotte.

A map of overlapping shapes on a map of Charlotte that depict walkable areas to public libraries and coffee shops. The areas are all over the map but the largest overlaps are in the center city, Uptown Charlotte.

A zoomed in map of Uptown Charlotte showing the "most walkable" areas by my totally made up criteria.
My goal was to learn more about telling compelling data-driven stories. Hannah encouraged me to write about something fun & personal and then guided me thru each step of the process: from pitching a story to refining the angle & polishing the map. Here are some stills of the piece:
14.05.2024 17:02 — 👍 1 🔁 0 💬 0 📌 0
Recording of the linked story. Shows a high-level view of a web story about walkability in Charlotte told through a series of charts and maps.
I was lucky to be paired with the amazing @hannahdormido.bsky.social as part of the @datavizsociety.bsky.social mentorship program over the past couple of months. We had weekly chats about life, careers, & journalism. And she guided me through writing a fun story! 📊👉 charlotte-walkability.vercel.app
14.05.2024 16:56 — 👍 6 🔁 1 💬 1 📌 0I also found this book inspirational! Similarly to you I’m not drawn to replicate the method through this exact medium but it did make me itch to pick up another data art project soon!
19.04.2024 19:33 — 👍 1 🔁 0 💬 0 📌 0
NEW: Questions in Dataviz: How do we take inspiration from textile dataviz?
Book review #27 reviews Record, Map & Culture Art by Jordan Cunliffe. A great book showcasing textile art to inspire all dataviz and data art practitioners, textile or otherwise 📊
questionsindataviz.com/2024/04/18/h...
