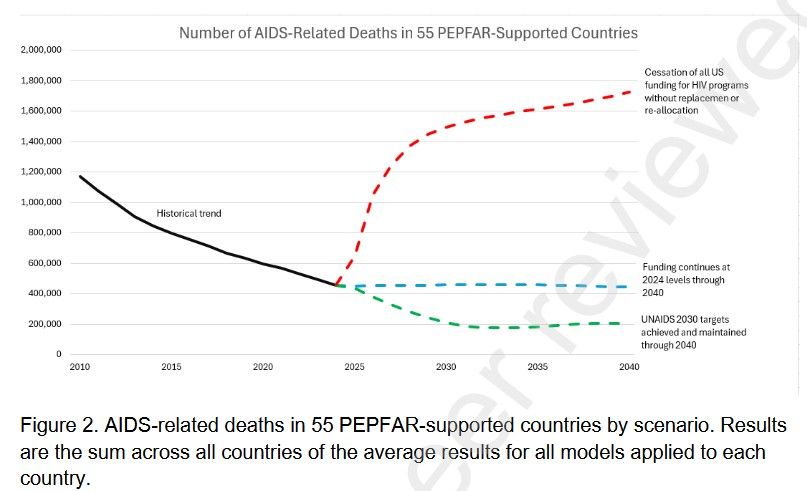
A line graph of estimated AIDS-related deaths from 2025 through 2040 in 55 PEPFAR-supported countries. The Y axis is estimated number of deaths and ranges from 200,000 to 2 million. The X axis is years and ranges from 2010 to 2040. There is a black line labeled “historical trend” from 2010 to 2025 showing a decrease in deaths from 1.2 million to ~420,000. Then in 2025 the black line splits into three scenarios: 1) a dashed green line showing deaths if USAID were to increase, 2) a dashed blue line showing deaths if USAID remained at 2024 levels, and 3) a dashed red line showing deaths if USAID stopped and was not replaced. In scenario 1 (funding increased) deaths continue to decrease from ~420,000 to 200,000. In scenario 2 (funding stays the same) deaths stay the same at 420,000. In scenario 3 (funding cut and not replaced) deaths increase from ~420,000 to 1.7 million.
A Lancet preprint estimates that if US funding is cut and not replaced, from 2025-2040 there will be 15.2 mil add'l AIDS deaths, 2.2 mil add'l TB deaths, 7.9 mil add'l child deaths from other causes, and 40-55 mil add'l unplanned pregnancies.
@altusaid.altgov.info
papers.ssrn.com/sol3/papers....