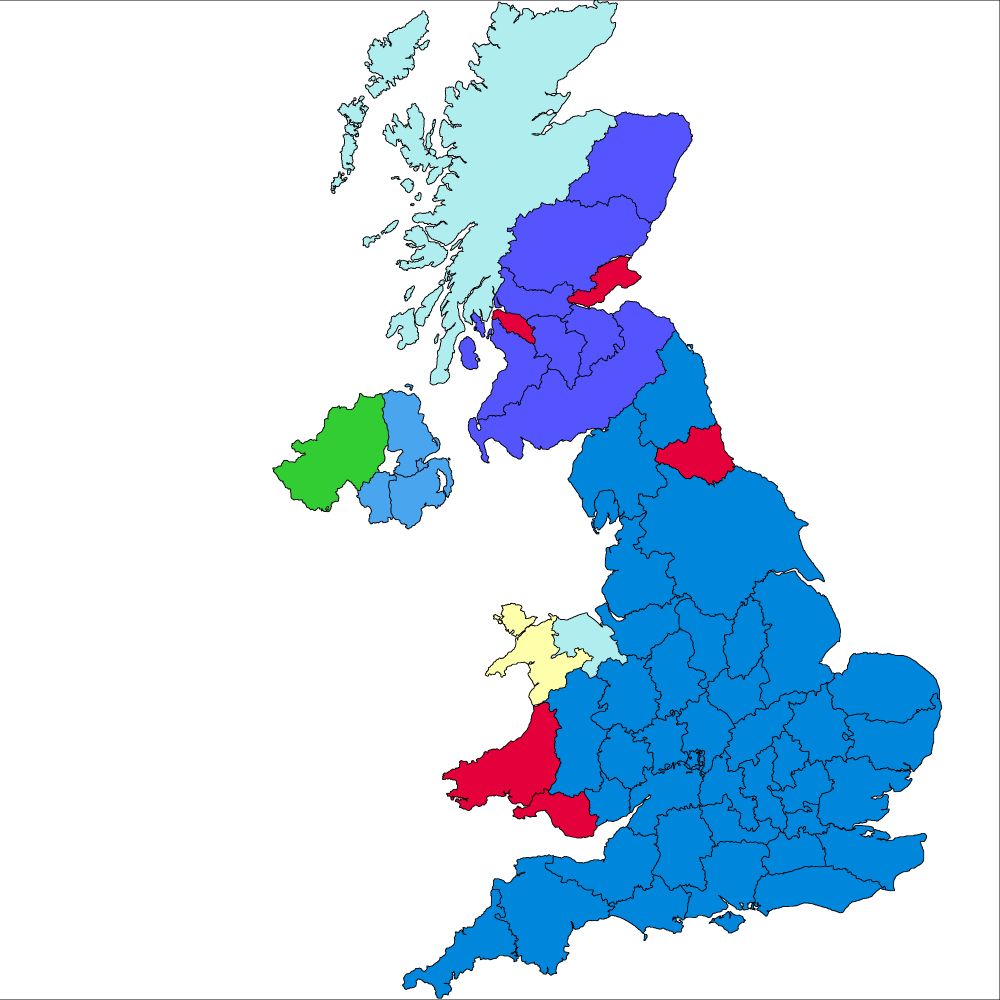
A similar map to the first, except each county is coloured by the party that came first in votes. It doesn't dramatically change the overall job, but it means that Labour holds on in Durham, Inverclyde and Renfrewshire, Dyfed, and Fife, as well as Morgannwg. In addition, Highlands and Islands and Clwyd are coloured light blue to indicate the Liberal Nationals leading there. Everything else is the same
Thought I'd add this for people who don't want to parse through the breakdowns, the largest individual party in each county
Comes to
Conservative: 552
Liberal National: 10
Labour: 46 (coincidentally identical to their actual result)
Independent Liberal: 4
Nationalist: 3
01.08.2025 13:12 —
👍 1
🔁 0
💬 0
📌 0
Breakdowns, candidate list, and a bit of historical context through here:
01.08.2025 12:44 —
👍 2
🔁 0
💬 1
📌 0
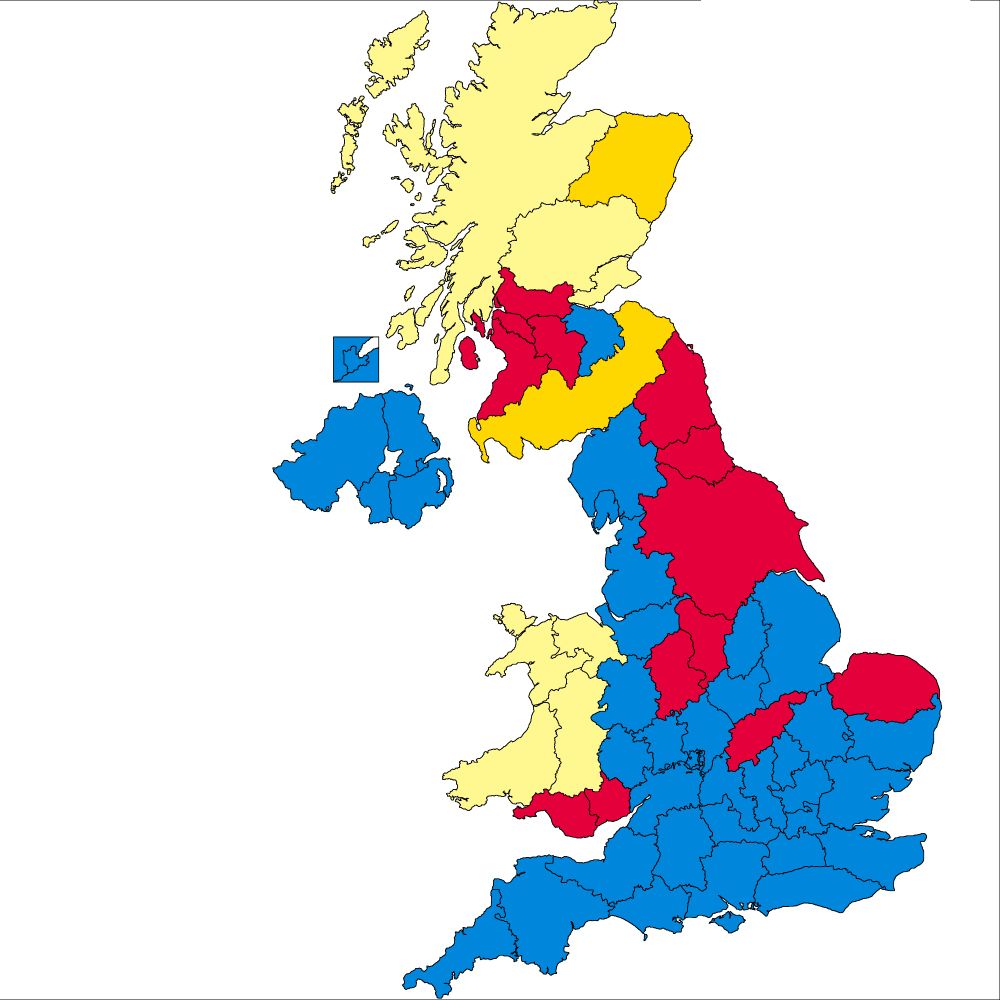
A map of the United Kingdom divided into 57 counties, each coloured according to which party or electoral alliance came first in a given place in the 1931 election, similar to the US electoral college
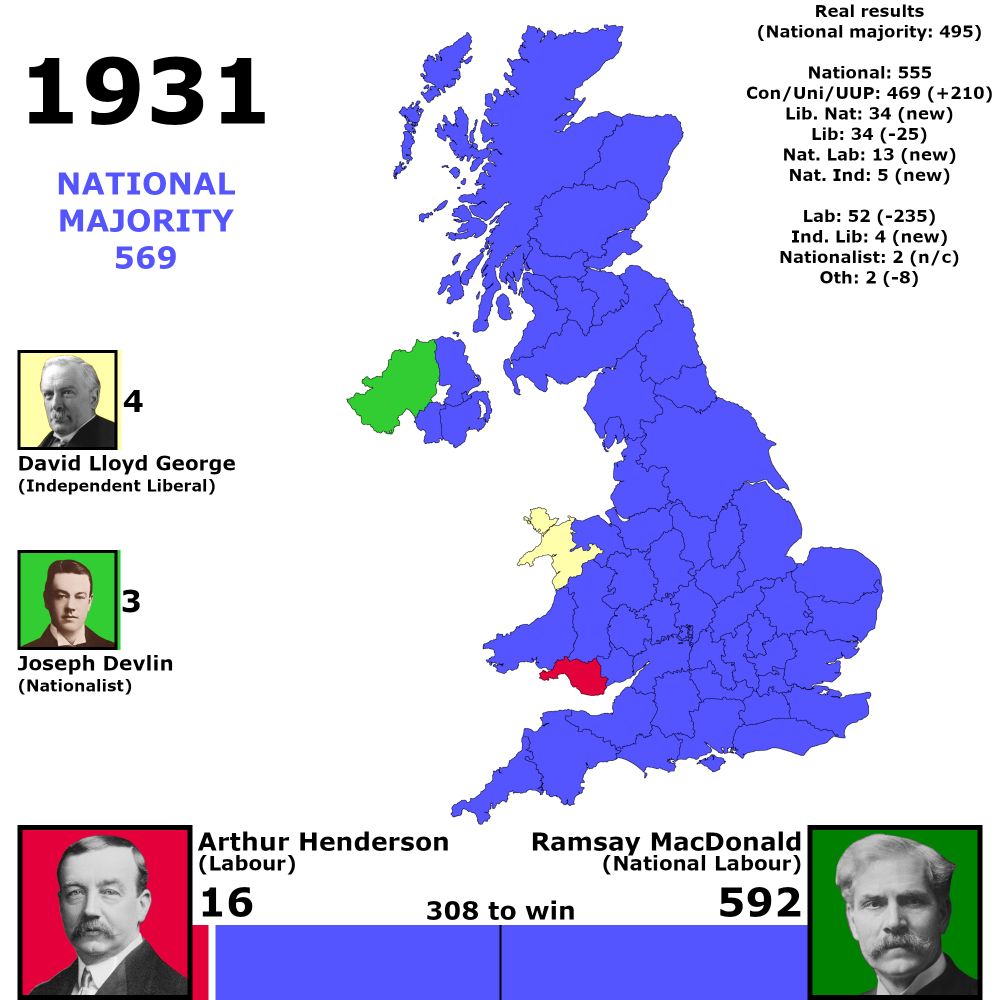
308 to win
National Majority - 569
Ramsay MacDonald, National Labour: 592
Arthur Henderson, Labour: 16
David Lloyd George, Independent Liberal: 4
Joseph Devlin, Nationalist: 3
Real results
National majority of 495
National Alliance: 555 seats
Consisting of 469 Conservative seats (up 210), 34 Liberal National seats (+34), 34 Liberal seats (down 25), 13 National Labour seats (up 13), and 5 National affiliated independents (up 5)
Labour Alliance: 52 seats (down 235)
Consisting of 46 Labour, 3 Independent Labour Party, and 3 Labour affiliated Independents
Independent Liberals: 4 seats (up 4)
Nationalist: 2 seats (no change)
Others: 2 seats (down 8)
United Kingdom, 1931
National government majority of 569
In reality, the government had a majority of 495, with the Conservatives alone having a majority of 325
01.08.2025 12:43 —
👍 5
🔁 0
💬 1
📌 6
01.08.2025 12:37 —
👍 2
🔁 0
💬 0
📌 0
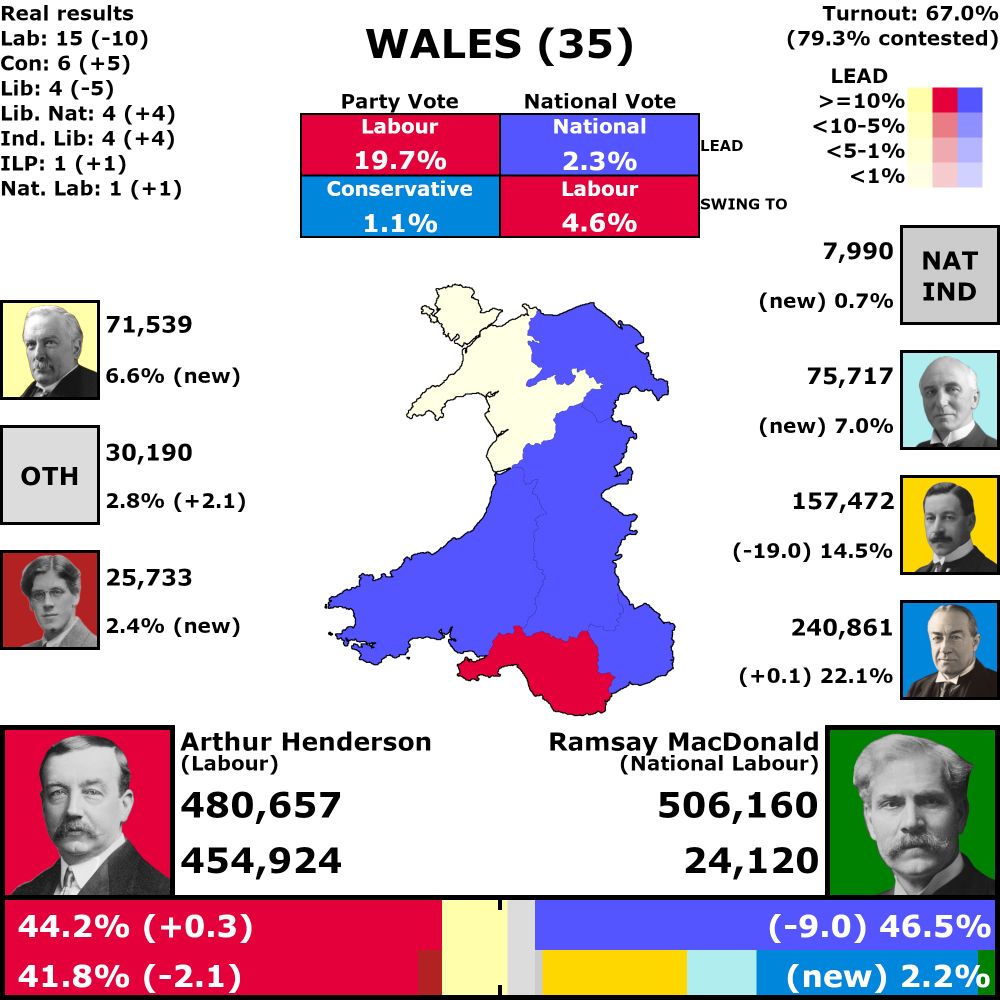
Wales, 35 seats across 6 counties
67.0% turnout (79.3% in contested seats)
Combined vote results
2.3% National lead
4.6% swing from National to Labour
National: 46.5% (down 9.0%)
Labour: 44.2% (up 0.3%)
Individual vote results
19.7% Labour lead
1.1% swing from Labour to Conservative
Labour: 41.8% (down 2.1%)
Conservative: 22.1% (up 0.1%)
Liberal: 14.5% (down 19.0%)
Liberal National: 7.0% (up 7.0%)
Independent Liberal: 6.6% (up 6.6%)
Independent Labour Party: 2.4% (up 2.4%)
National Labour: 2.2% (up 2.2%)
National Independents: 0.7% (up 0.7%)
Other: 2.8% (up 2.1%)
Seat results
Labour: 15 seats (down 10), 4 uncontested
Conservative: 6 seats (up 5)
Liberal: 4 seats (down 5)
Liberal National: 4 seats (up 4), 2 uncontested
Independent Liberal: 4 seats (up 4)
Independent Labour Party: 1 seat (up 1)
National Labour: 1 seat (up 1)
National Independents: 0 seats (no change)
Other: 0 seats (no change)
Wales [Country/Region], 1931
01.08.2025 12:36 —
👍 2
🔁 0
💬 0
📌 0
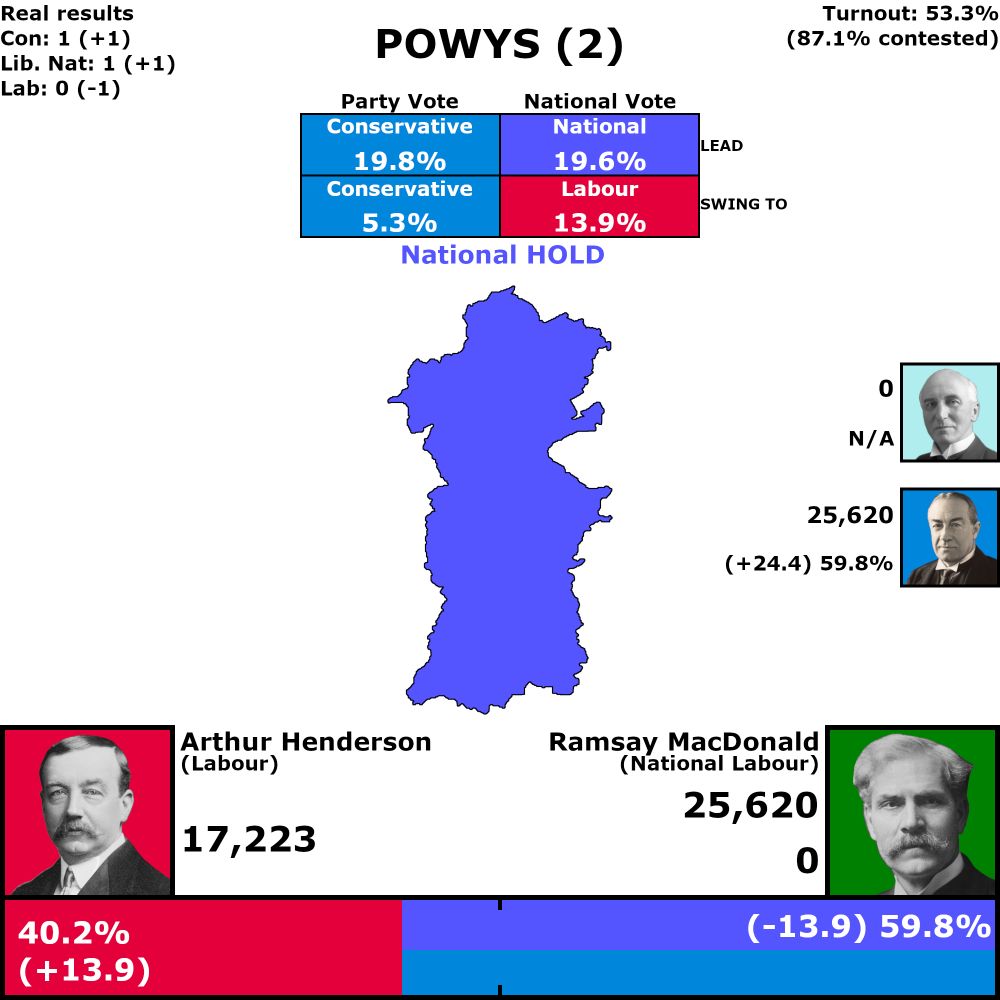
Powys, 2 votes
53.3% turnout (87.1% in contested seats)
Combined vote results
National hold, 19.6% lead
13.9% swing from National to Labour
National: 59.8% (down 13.9%)
Labour: 40.2% (up 13.9%)
Individual vote results
19.6% Conservative lead
5.3% swing from Labour to Conservative
Conservative: 59.8% (up 24.4%)
Labour: 40.2% (up 13.9%)
Seat Results
Conservative: 1 seat (up 1)
Liberal National: 1 seat (up 1), 1 uncontested
Labour: 0 seats (down 1)
Powys [County], 1931
National HOLD
01.08.2025 12:31 —
👍 2
🔁 0
💬 1
📌 0
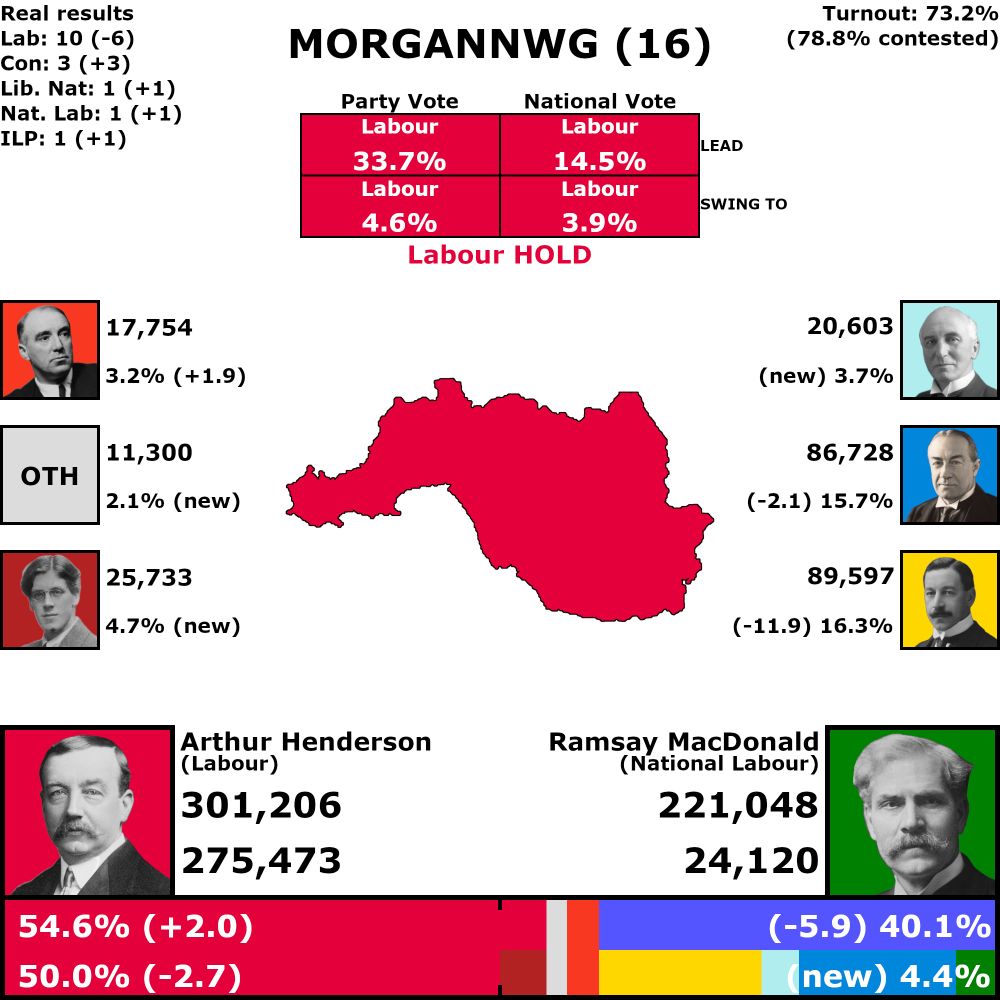
Morgannwg, 16 votes
73.2% turnout (78.8% in contested seats)
Combined vote results
Labour hold, 14.5% lead
3.9% swing from National to Labour
Labour: 54.6% (up 2.0%)
National: 40.1% (down 5.9%)
Individual vote results
33.7% Labour lead
4.6% swing from Liberal to Labour
Labour: 50.0% (down 2.7%)
Liberal: 16.3% (down 11.9%)
Conservative: 15.7% (down 2.1%)
Independent Labour Party: 4.7% (up 4.7%)
National Labour: 4.4% (up 4.4%)
Liberal National: 3.7% (up 3.7%)
Communist: 3.2% (up 1.9%)
Other: 2.1% (up 2.1%)
Seat Results
Labour: 10 seats (down 6), 1 uncontested
Liberal: 0 seats (no change)
Conservative: 3 seats (up 3)
Independent Labour Party: 1 seat (up 1)
National Labour: 1 seat (up 1)
Liberal National: 1 seat (up 1)
Communist: 0 seats (no change)
Other: 0 seats (no change)
Morgannwg [County], 1931
Labour HOLD
01.08.2025 12:30 —
👍 3
🔁 0
💬 1
📌 2
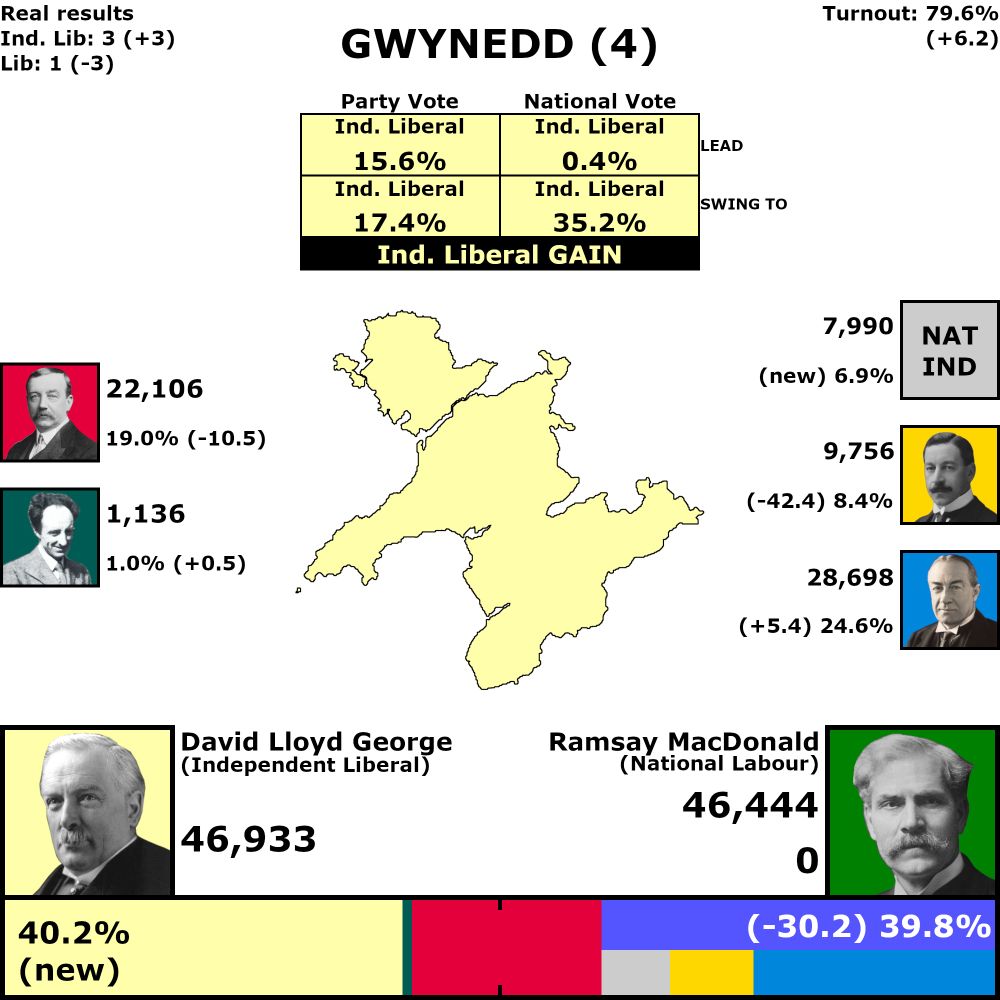
Gwynedd, 4 votes
79.6% turnout (up 6.2%)
Combined vote results
Independent Liberal gain from National, 0.4% lead
35.2% swing from National to Independent Liberal
National: 39.8% (down 30.2%)
Independent Liberal: 40.2 (up 40.2%)
Individual vote results
15.6% Independent Liberal lead
17.4% swing from Conservative to Independent Liberal
Independent Liberal: 40.2% (up 40.2%)
Conservative: 24.6% (up 5.4%)
Labour: 19.0% (down 10.5%)
Liberal: 8.4% (down 42.4%)
National Independents: 6.9% (up 6.9%)
Plaid Cymru: 1.0% (up 0.5%)
Seat Results
Independent Liberal: 3 seats (up 3)
Conservative: 0 seats (no change)
Labour: 0 seats (no change)
Liberal: 1 seat (down 3)
National Independents: 0 seats (no change)
Plaid Cymru: 0 seats (no change)
Gwynedd [County], 1931
Independent Liberal GAIN from National
01.08.2025 12:28 —
👍 1
🔁 0
💬 1
📌 0
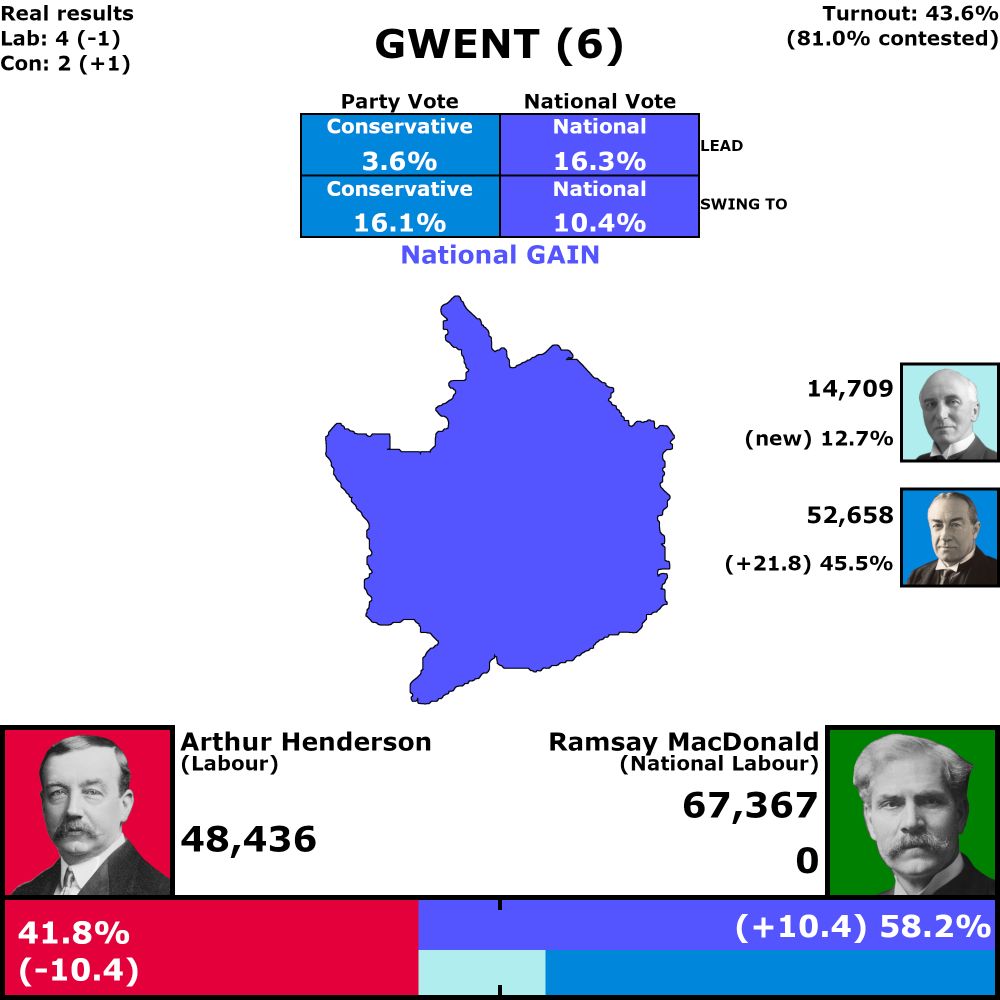
Gwent, 6 votes
43.6% turnout (81.0% in contested seats)
Combined vote results
National gain from Labour, 16.3% lead
10.4% swing from Labour to National
National: 58.2% (up 10.4%)
Labour: 41.8% (down 10.4%)
Individual vote results
3.6% Conservative lead
16.1% swing from Labour to Conservative
Conservative: 45.5% (up 21.8%)
Labour: 41.8% (down 10.4%)
Liberal National: 12.7% (up 12.7%)
Seat Results
Conservative: 2 seats (up 1)
Labour: 4 seats (down 1), 3 uncontested
Liberal National: 0 seats (no change)
Gwent [County], 1931
National GAIN from Labour
As with 1924, this feels more like the product of three Labour seats being uncontested than a genuine shift. Not quite sure why other parties only seem to fight Labour in those seats when Labour is competitive nationally
01.08.2025 12:26 —
👍 2
🔁 0
💬 1
📌 0
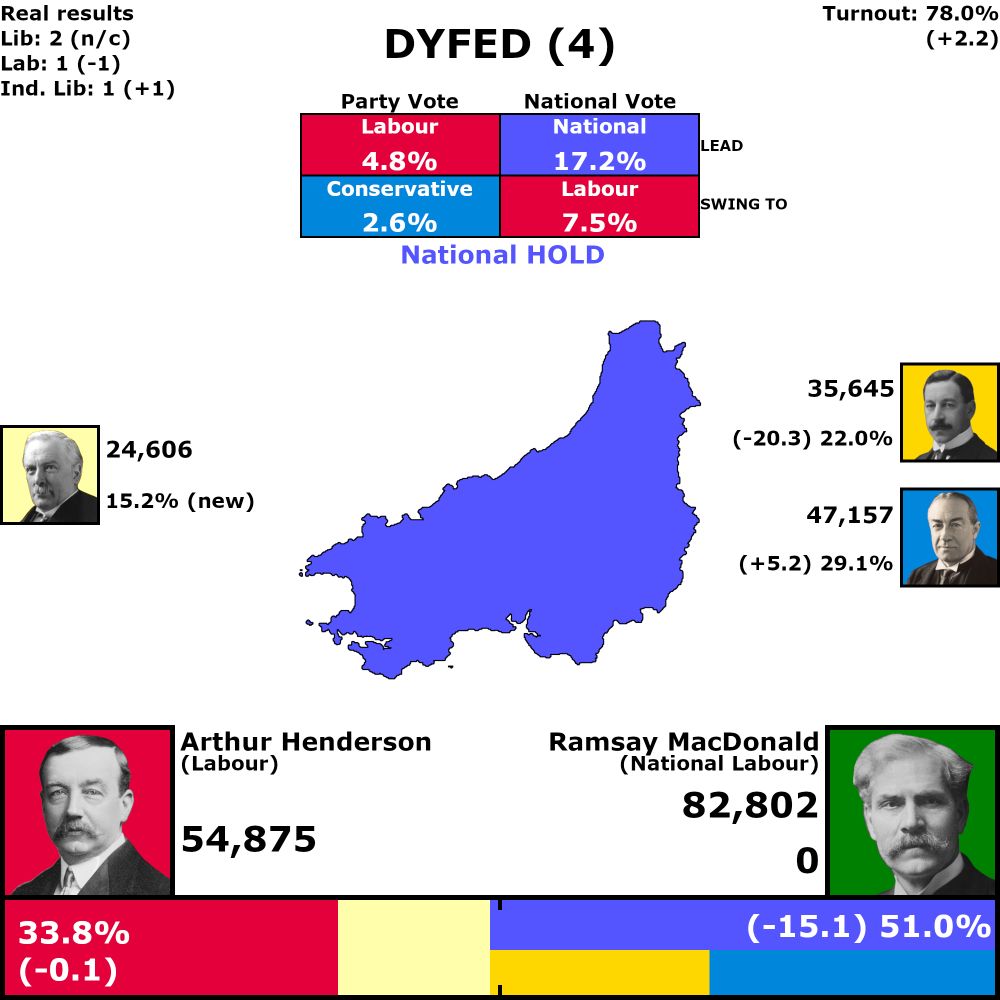
Dyfed, 4 votes
78.0% turnout (up 2.2%)
Combined vote results
National hold, 17.2% lead
7.5% swing from National to Labour
National: 51.0% (down 15.1%)
Labour: 33.8% (down 0.1%)
Individual vote results
4.8% Labour lead
2.6% swing from Labour to Conservative
Labour: 33.8% (down 0.1%)
Conservative: 29.1% (up 5.2%)
Liberal: 22.0% (down 20.3%)
Independent Liberal: 15.2% (up 15.2%)
Seat Results
Labour: 1 seat (down 1)
Conservative: 0 seats (no change)
Liberal: 2 seats (no change)
Independent Liberal: 1 seat (up 1)
Dyfed [County], 1931
National HOLD
01.08.2025 12:22 —
👍 2
🔁 0
💬 1
📌 0
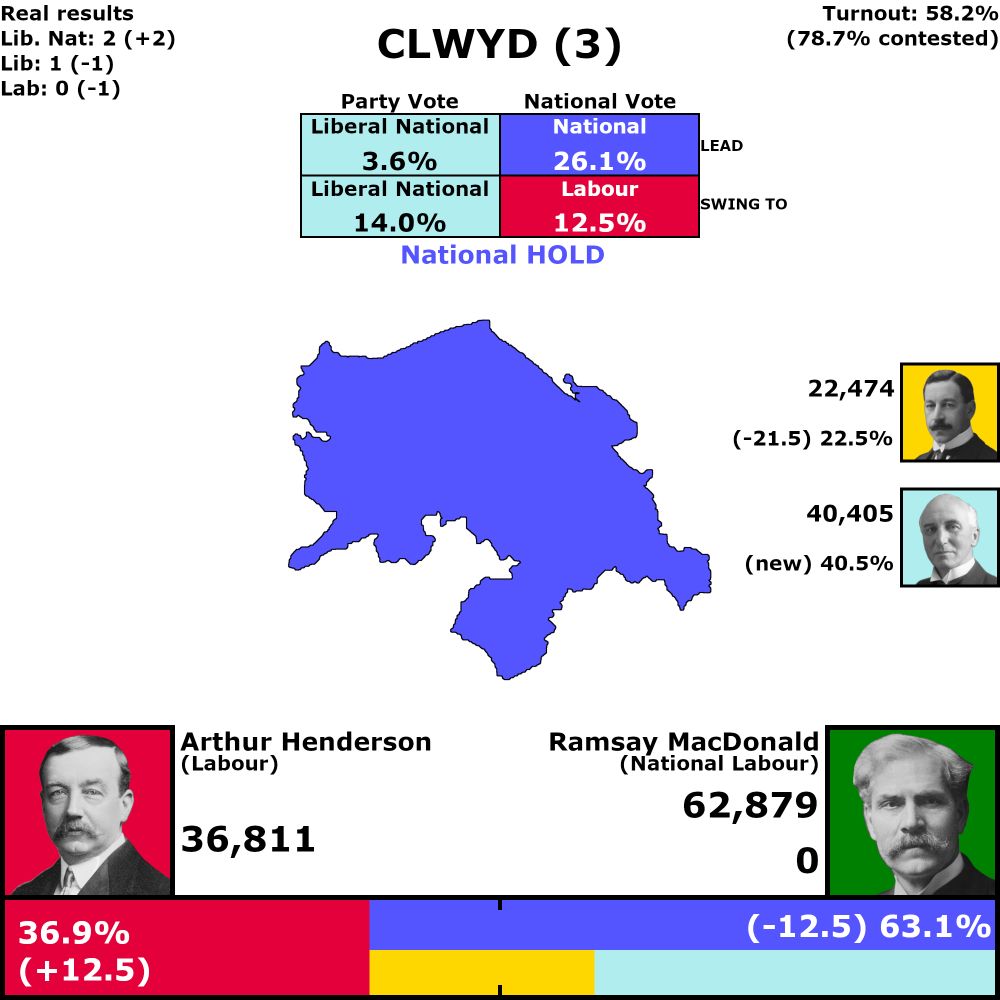
Clwyd, 3 votes
58.2% turnout (78.7% in contested seats)
Combined vote results
National hold, 26.1% lead
12.5% swing from National to Labour
National: 63.1% (down 12.5%)
Labour: 36.9% (up 12.5%)
Individual vote results
3.6% Liberal National lead
14.0% swing from Labour to Liberal National
Liberal National: 40.5% (up 40.5%)
Labour: 36.9% (up 12.5%)
Liberal: 22.5% (down 21.5%)
Seat Results
Liberal National: 2 seats (up 2), 1 uncontested
Labour: 0 seats (down 1)
Liberal: 1 seats (down 1)
Clwyd [County], 1931
National HOLD
01.08.2025 12:20 —
👍 2
🔁 0
💬 1
📌 0
Wales breakdown thread, 1931
#UKEC1931
01.08.2025 12:20 —
👍 2
🔁 0
💬 1
📌 1
National: 577
Nationalist: 3
Complete National sweep of England AND Scotland
01.08.2025 09:14 —
👍 2
🔁 0
💬 1
📌 1
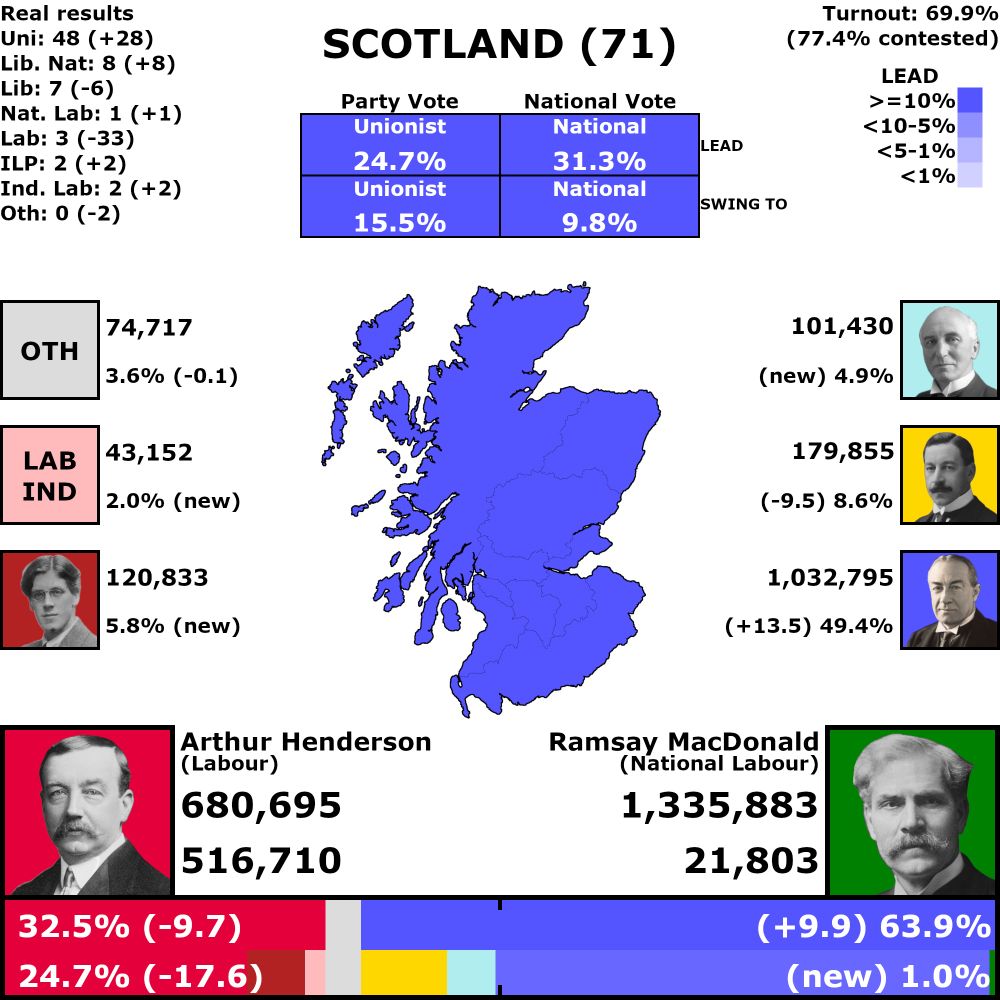
Scotland, 71 seats across 6 counties
69.9% turnout (77.4% in contested seats)
Combined vote results
31.3% National lead
9.8% swing from Labour to National
National: 63.9% (up 9.9%)
Labour: 32.5% (down 9.7%)
Individual vote results
24.7% Unionist lead
15.5% swing from Labour to Unionist
Unionist: 49.4% (up 13.5%)
Labour: 24.7% (down 17.6%)
Liberal: 8.6% (down 9.5%)
Independent Labour Party: 5.8% (up 5.8%)
Liberal National: 4.9% (up 4.9%)
Labour Independents: 2.0% (up 2.0%)
National Labour: 1.0% (up 1.0%)
Other: 3.6% (down 0.1%)
Seat results
Unionist: 48 seats (up 28), 3 uncontested
Labour: 3 seats (down 33)
Liberal: 7 seats (down 6), 3 uncontested
Independent Labour Party: 2 seats (up 2)
Liberal National: 8 seats (up 8), 2 uncontested
Labour Independents: 2 seats (up 2)
National Labour: 1 seat (up 1)
Other: 0 seats (down 2)
Scotland [Country/Region], 1931
01.08.2025 09:11 —
👍 3
🔁 0
💬 0
📌 0
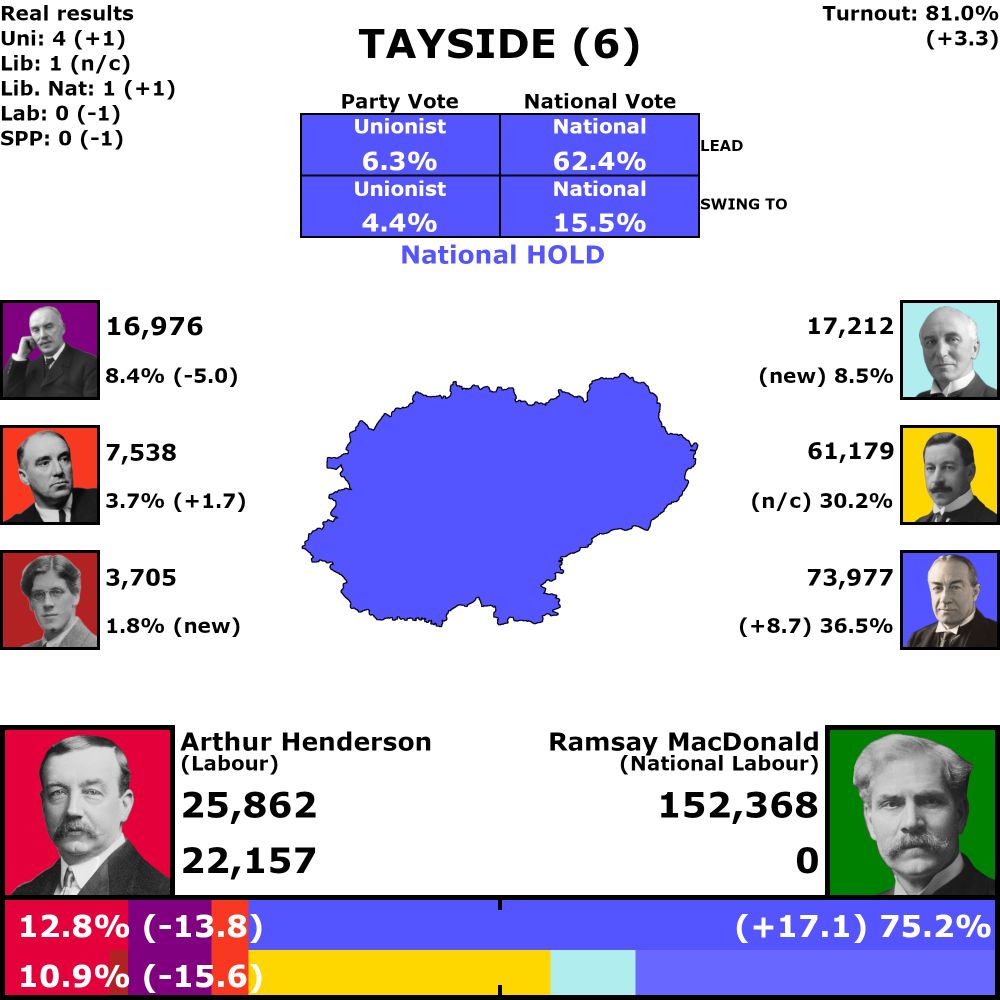
Tayside, 6 votes
81.0% turnout (up 3.3%)
Combined vote results
National hold, 62.4% lead
15.5% swing from Labour to National
National: 75.2% (up 17.1%)
Labour: 12.8% (down 13.8%)
Individual vote results
6.3% Unionist lead
4.4% swing from Liberal to Unionist
Unionist: 36.5% (up 8.7%)
Liberal: 30.2% (no change)
Labour: 10.9% (down 15.6%)
Liberal National: 8.5% (up 8.5%)
Scottish Prohibition: 8.4% (down 5.0%)
Communist: 3.7% (up 1.7%)
Independent Labour Party: 1.8% (up 1.8%)
Seat Results
Unionist: 4 seats (up 1)
Liberal: 1 seat (no change)
Labour: 0 seats (down 1)
Liberal National: 1 seat (up 1)
Scottish Prohibition: 0 seats (down 1)
Communist: 0 seats (no change)
Independent Labour Party: 0 seats (no change)
Tayside [County], 1931
National HOLD
RIP that one Scottish Prohibition guy in Dundee
01.08.2025 09:08 —
👍 3
🔁 0
💬 1
📌 0
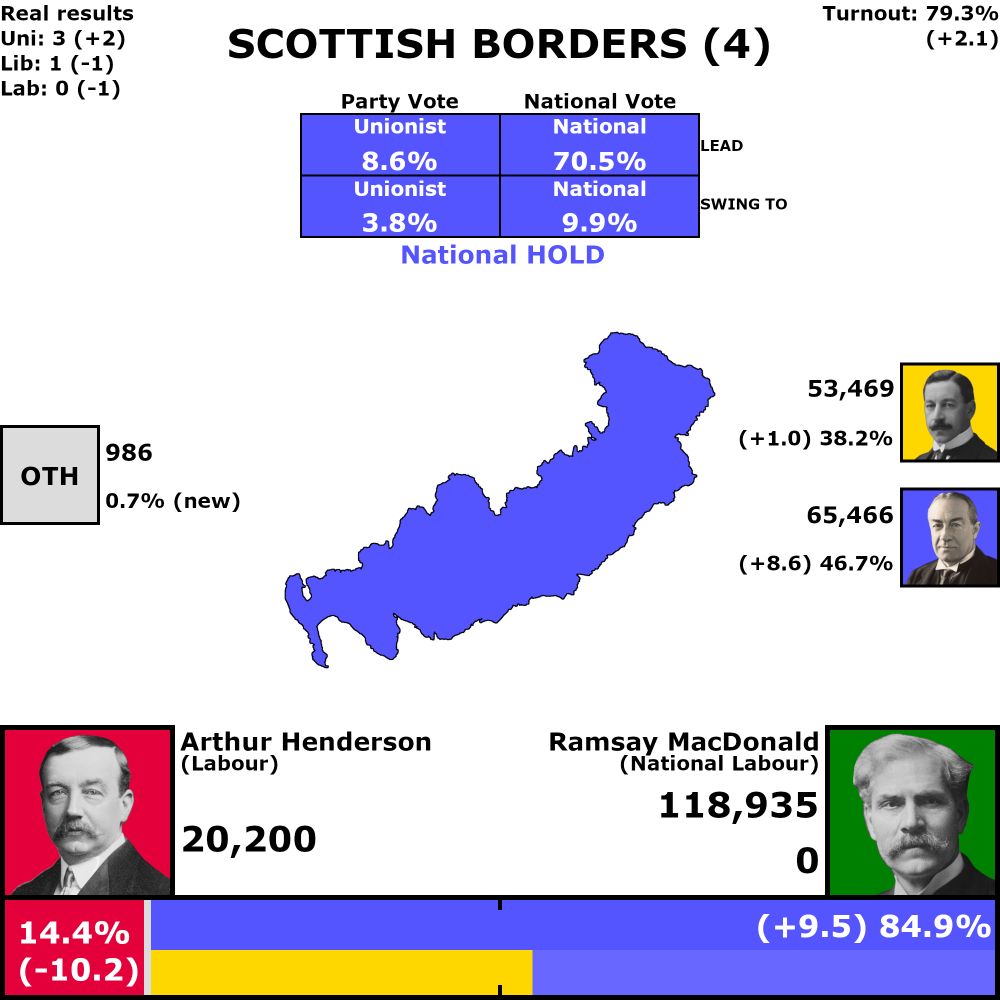
Scottish Borders, 4 votes
79.3% turnout (up 2.1%)
Combined vote results
National hold, 70.5% lead
9.9% swing from Labour to National
National: 84.9% (up 9.5%)
Labour: 14.4% (down 10.2%)
Individual vote results
8.6% Unionist lead
3.8% swing from Liberal to Unionist
Unionist: 46.7% (up 8.6%)
Liberal: 38.2% (up 1.0%)
Labour: 14.4% (down 10.2%)
Other: 0.7% (up 0.7%)
Seat Results
Unionist: 3 seats (up 2)
Liberal: 1 seats (down 1)
Labour: 0 seats (down 1)
Other: 0 seats (no change)
Scottish Borders [County], 1931
National HOLD
01.08.2025 09:06 —
👍 3
🔁 0
💬 1
📌 0
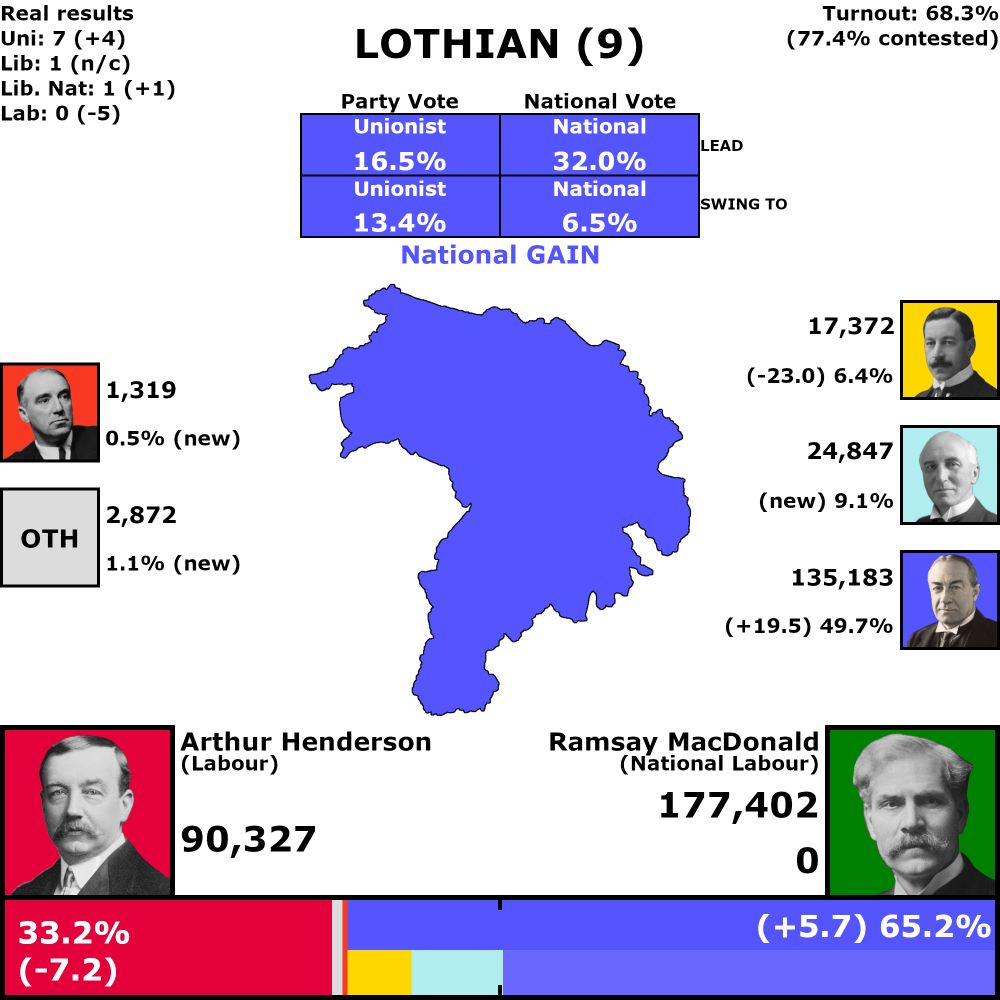
Lothian, 9 votes
68.3% turnout (77.4% in contested seats)
Combined vote results
National gain from Labour, 32.0% lead
6.5% swing from Labour to National
National: 65.2% (up 5.7%)
Labour: 33.2% (down 7.2%)
Individual vote results
16.5% Unionist lead
13.4% swing from Labour to Unionist
Unionist: 49.7% (up 19.5%)
Labour: 33.2% (down 7.2%)
Liberal National: 9.1% (up 9.1%)
Liberal: 6.4% (down 23.0%)
Communist: 0.5% (up 0.5%)
Other: 1.1% (up 1.1%)
Seat Results
Unionist: 7 seats (up 4), 1 uncontested
Labour: 0 seats (down 5)
Liberal National: 1 seats (up 1)
Liberal: 1 seats (no change)
Communist: 0 seats (no change)
Other: 0 seats (no change)
Lothian [County], 1931
National GAIN from Labour
01.08.2025 09:04 —
👍 2
🔁 0
💬 1
📌 0
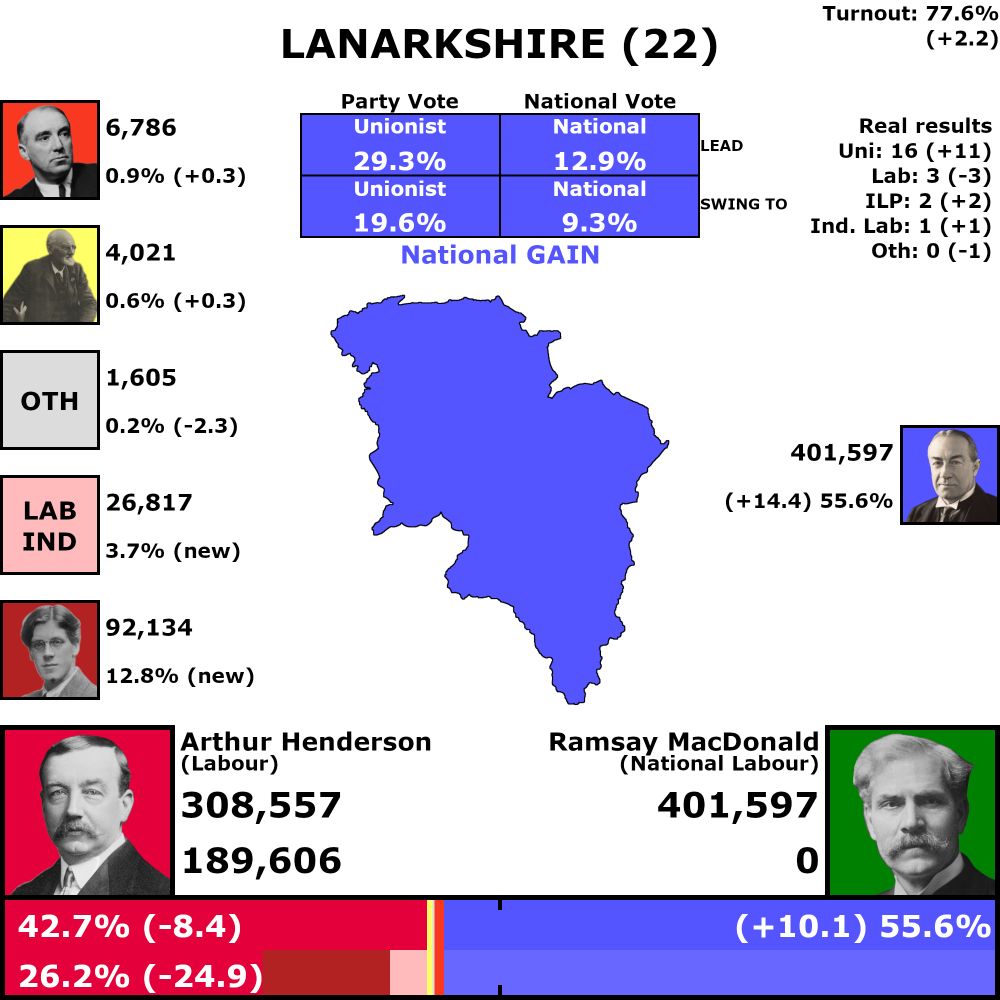
Lanarkshire, 22 votes
77.6% turnout (up 2.2%)
Combined vote results
National gain from Labour, 12.9% lead
9.3% swing from Labour to National
National: 55.6% (up 10.1%)
Labour: 42.7% (down 8.4%)
Individual vote results
29.3% Unionist lead
19.6% swing from Labour to Unionist
Unionist: 55.6% (up 14.4%)
Labour: 26.2% (down 24.9%)
Independent Labour Party: 12.8% (up 12.8%)
Labour Independents: 3.7% (up 3.7%)
Communist: 0.9% (up 0.3%)
Scottish Nationals: 0.6% (up 0.3%)
Other: 0.2% (down 2.3%)
Seat Results
Unionist: 16 seats (up 11)
Labour: 3 seats (down 13)
Independent Labour Party: 2 seats (up 2)
Communist: 0 seats (no change)
Scottish Nationalist: 0 seats (no change)
Labour Independents: 0 seats (no change)
Other: 0 seats (down 1)
Lanarkshire [County], 1931
National GAIN from Labour
01.08.2025 09:02 —
👍 2
🔁 0
💬 1
📌 0
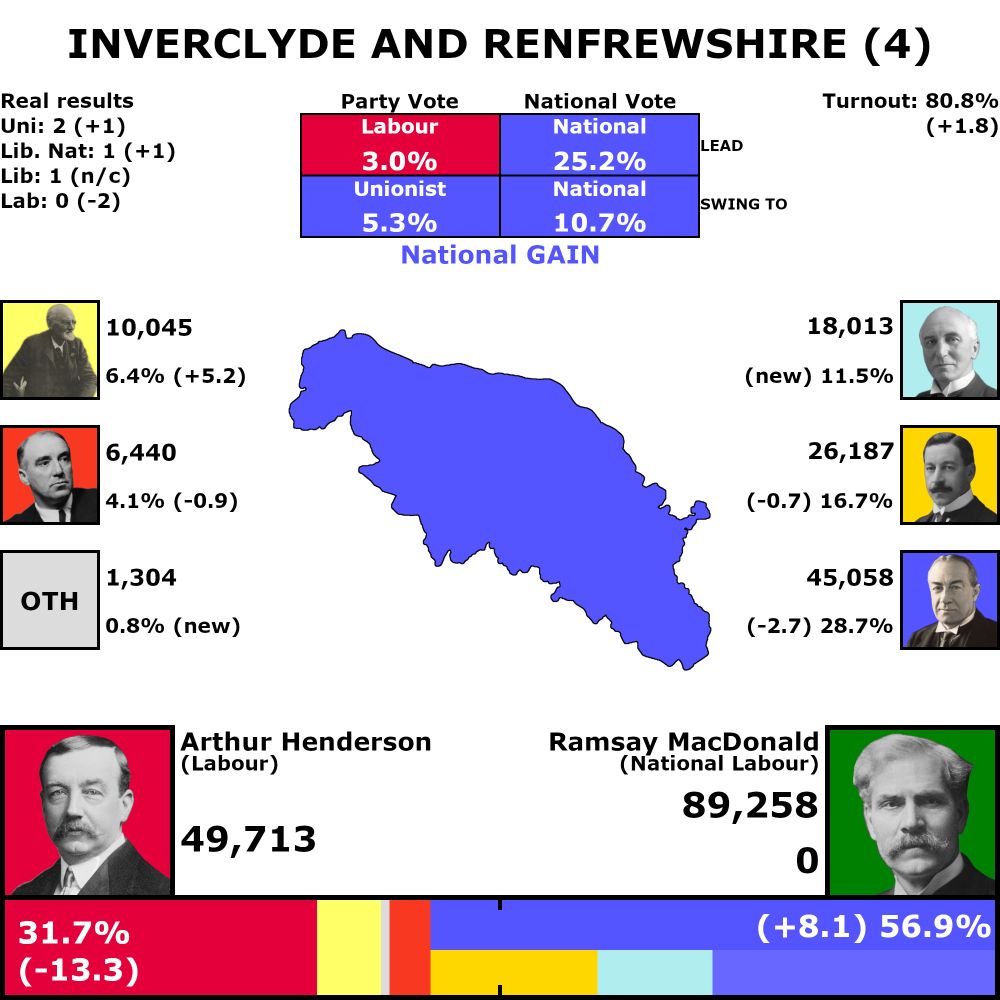
Inverclyde and Renfrewshire, 4 votes
80.8% turnout (up 1.8%)
Combined vote results
National gain from Labour, 25.2% lead
10.7% swing from Labour to National
National: 56.9% (up 8.1%)
Labour: 31.7% (down 13.3%)
Individual vote results
3.0% Labour lead
5.3% swing from Labour to Unionist
Labour: 31.7% (down 13.3%)
Unionist: 28.7% (down 2.7%)
Liberal: 16.7% (down 0.7%)
Liberal National: 11.5% (up 11.5%)
Scottish Nationalist: 6.4% (up 5.2%)
Communist: 4.1% (down 0.9%)
Other: 0.8% (up 0.8%)
Seat Results
Labour: 0 seats (down 2)
Unionist: 2 seats (up 1)
Liberal: 1 seats (no change)
Liberal National: 1 seats (up 1)
Scottish Nationalist: 0 seats (no change)
Communist: 0 seats (no change)
Other: 0 seats (no change)
Inverclyde and Renfrewshire [County], 1931
National GAIN from Labour
01.08.2025 09:00 —
👍 2
🔁 0
💬 1
📌 0
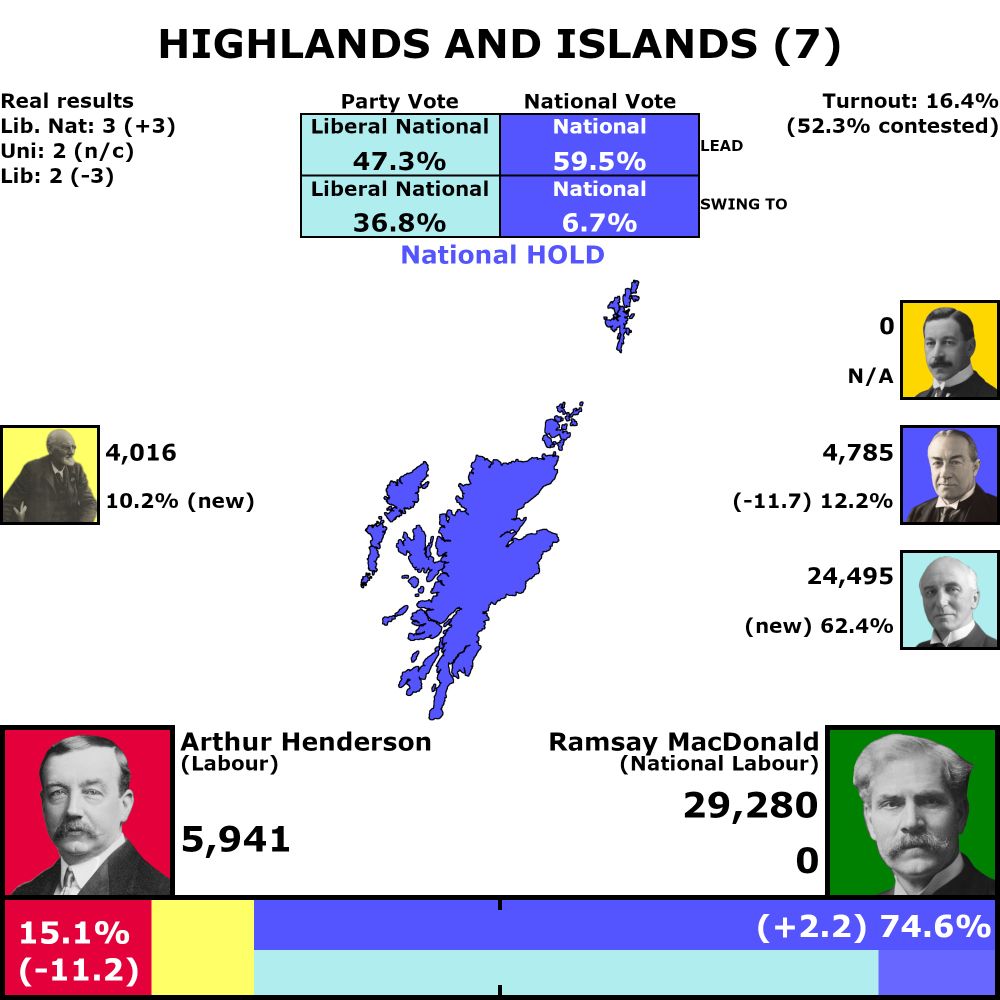
Highlands and Islands, 7 votes
16.4% turnout (52.3% in contested seats)
Combined vote results
National hold, 59.5% lead
6.7% swing from Labour to National
National: 74.6% (up 2.2%)
Labour: 15.1% (down 11.2%)
Individual vote results
47.3% Liberal National lead
36.8% swing from Labour to Liberal National
Liberal National: 62.4% (up 62.4%)
Labour: 15.1% (down 11.2%)
Unionist: 12.2% (down 11.7%)
Scottish Nationalist: 10.2% (up 10.2%)
Seat Results
Liberal National: 3 seats (up 3), 1 uncontested
Labour: 0 seats (no change)
Unionist: 2 seats (no change), 2 uncontested
Scottish Nationalist: 0 seats (no change)
Liberal: 2 seats (down 3), 2 uncontested
Highlands and Islands [County], 1931
National HOLD
01.08.2025 08:55 —
👍 2
🔁 0
💬 1
📌 0
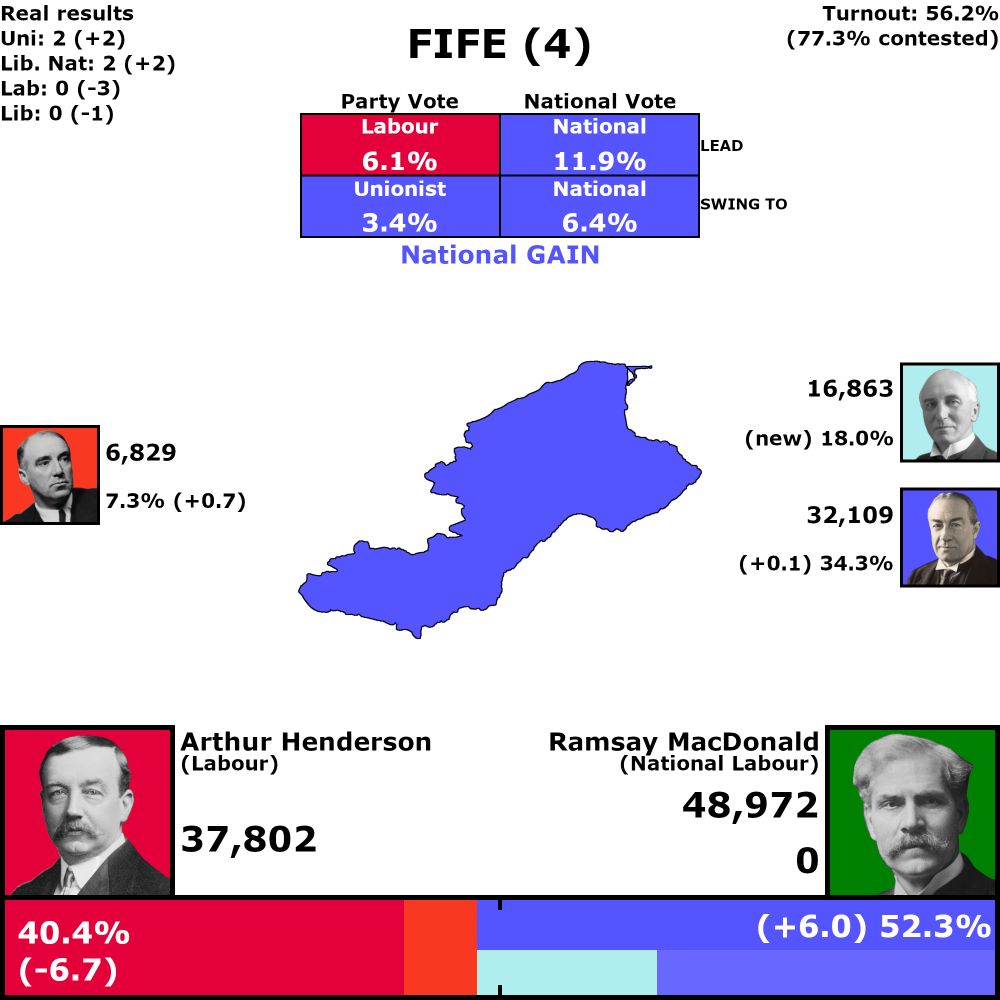
Fife, 4 votes
56.2% turnout (77.3% in contested seats)
Combined vote results
National gain from Labour, 11.9% lead
6.4% swing from Labour to National
National: 52.3% (up 6.0%)
Labour: 40.4% (down 6.7%)
Individual vote results
6.1% Labour lead
3.4% swing from Labour to Unionist
Labour: 40.4% (down 6.7%)
Unionist: 34.3% (up 0.1%)
Liberal National: 18.0% (up 18.0%)
Communist: 7.3% (up 0.7%)
Seat Results
Labour: 0 seats (down 3)
Unionist: 2 seats (up 2)
Liberal National: 2 seats (up 2), 1 uncontested
Communist: 0 seats (no change)
Liberal: 0 seats (down 1)
Fife [County], 1931
National GAIN from Labour
01.08.2025 08:53 —
👍 2
🔁 0
💬 1
📌 0
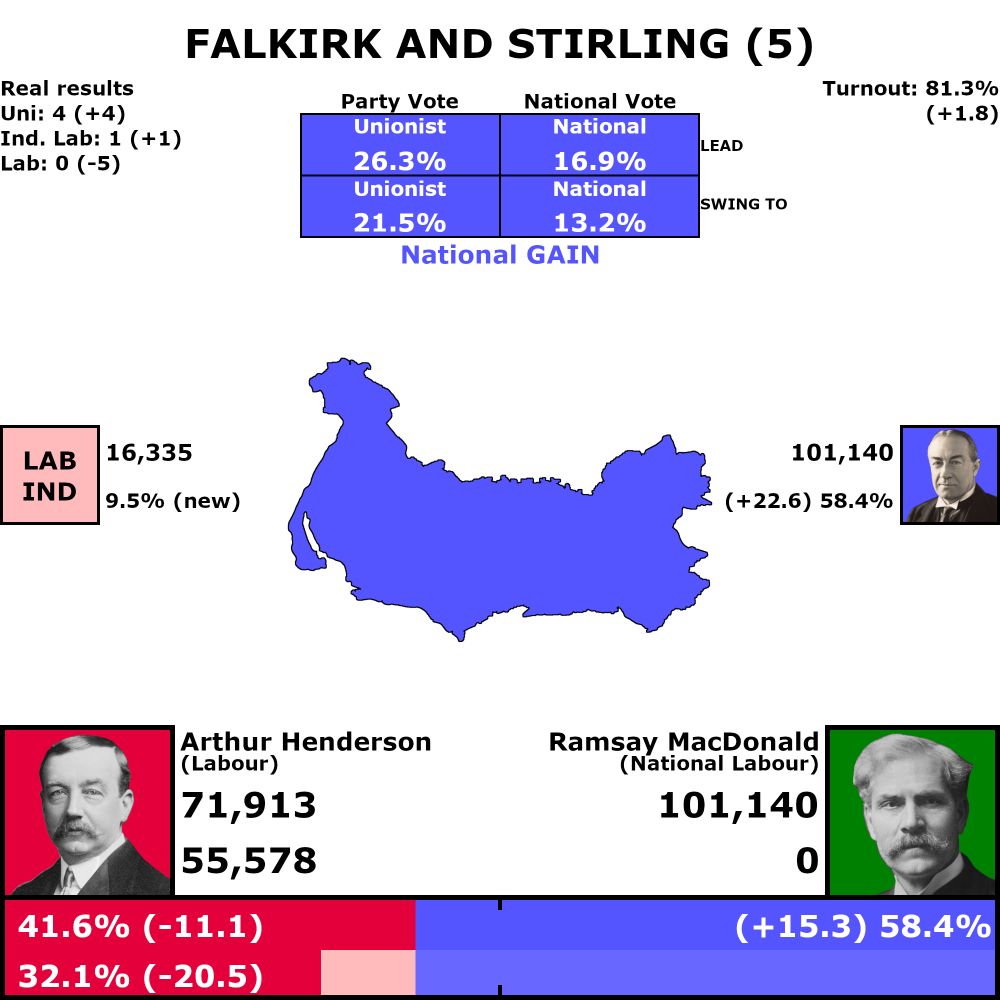
Falkirk and Stirling, 5 votes
81.3% turnout (up 1.8%)
Combined vote results
National gain from Labour, 16.9% lead
13.2% swing from Labour to National
National: 58.4% (up 15.3%)
Labour: 41.6% (down 11.1%)
Individual vote results
26.3% Unionist lead
21.5% swing from Labour to Unionist
Unionist: 58.4% (up 22.6%)
Labour: 32.1% (down 20.5%)
Labour Independents: 9.5% (up 9.5%)
Seat Results
Unionist: 4 seats (up 4)
Labour Independents: 1 seat (up 1)
Labour: 0 seats (down 5)
Falkirk and Stirling [County], 1931
National GAIN from Labour
01.08.2025 08:51 —
👍 2
🔁 0
💬 1
📌 0
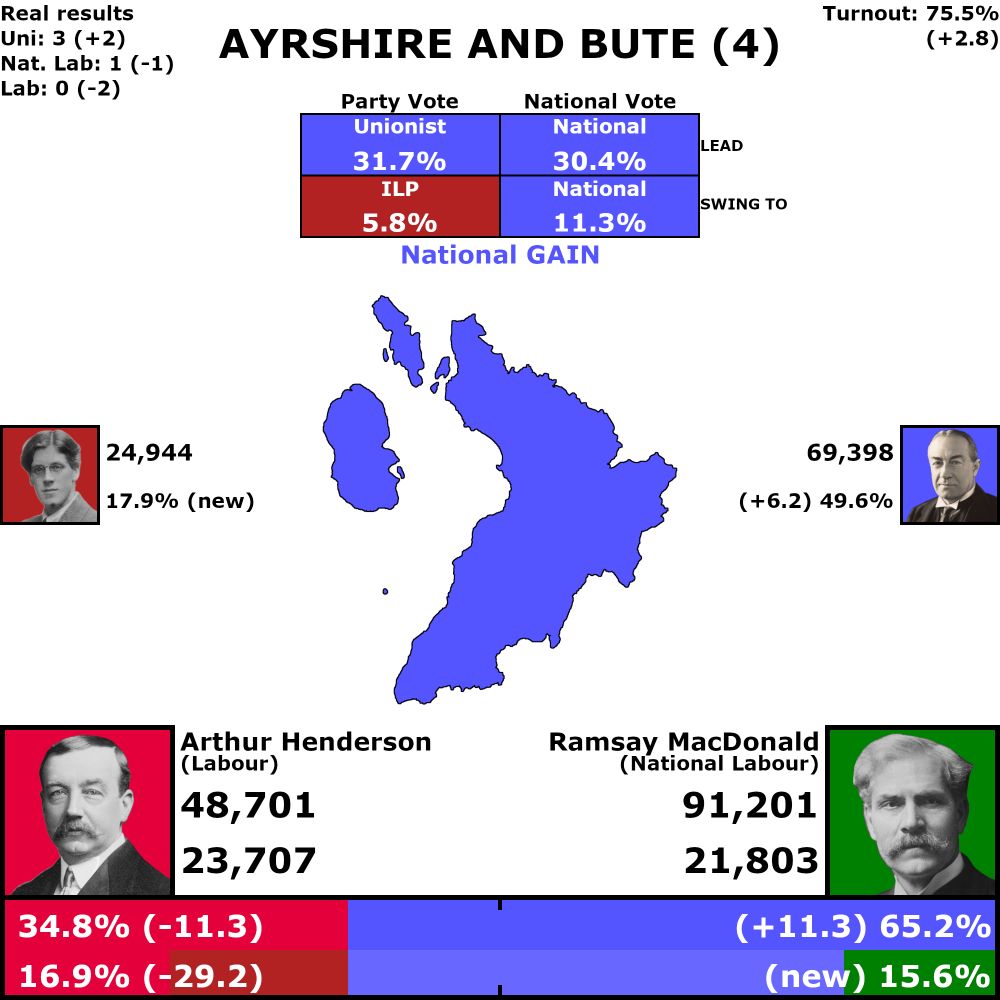
Ayrshire and Bute, 4 votes
75.5% turnout (up 2.8%)
Combined vote results
National gain from Labour, 30.4% lead
11.3% swing from Labour to National
National: 65.2% (up 11.3%)
Labour: 34.8% (down 11.3%)
Individual vote results
31.7% Unionist lead
5.8% swing from Unionist to Independent Labour Party
Unionist: 49.6% (up 6.2%)
Independent Labour Party: 17.9% (up 17.9%)
Labour: 16.9% (down 29.2%)
National Labour: 15.6% (up 15.6%)
Seat Results
Unionist: 3 seats (up 1)
Independent Labour Party: 0 seats (no change)
Labour: 0 seats (down 2)
National Labour: 1 seats (up 1)
Ayrshire and Bute [County], 1931
National GAIN from Labour
01.08.2025 08:48 —
👍 2
🔁 0
💬 1
📌 0
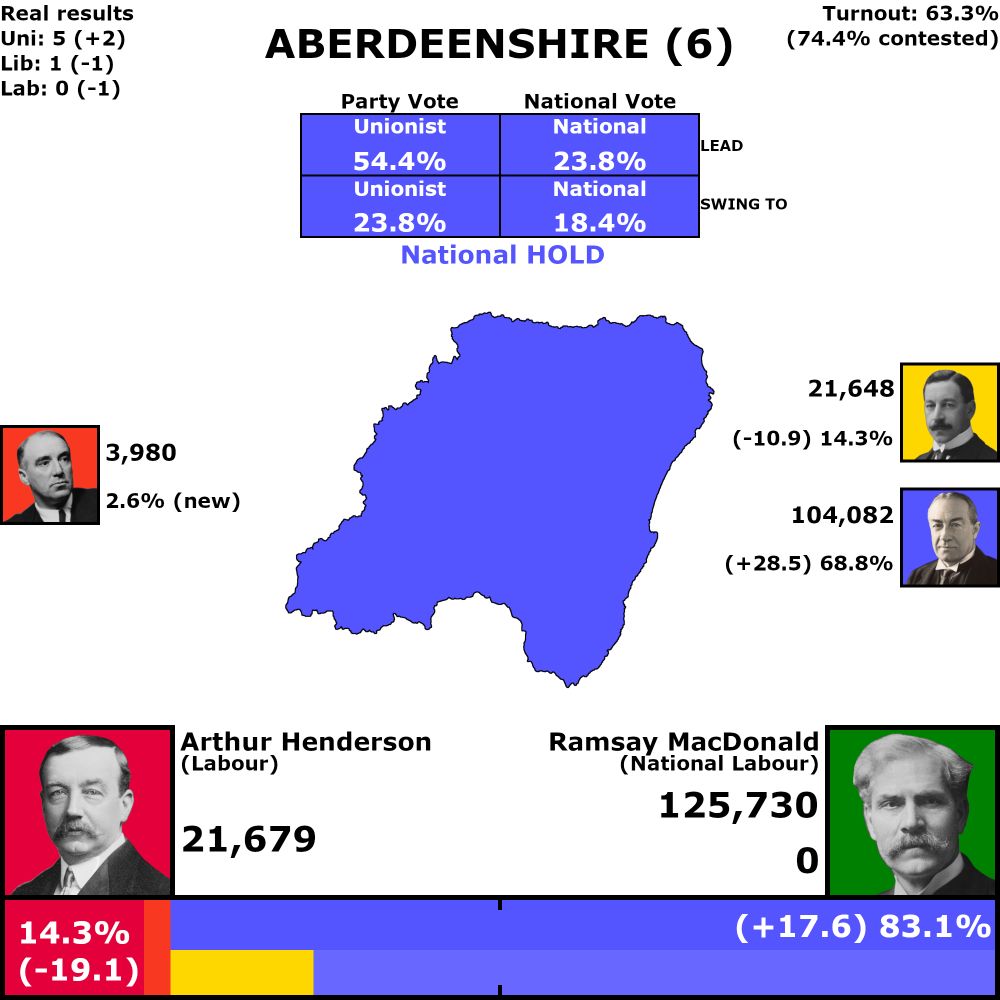
Aberdeenshire, 6 votes
63.3% turnout (74.4% in contested seats)
Combined vote results
National hold, 68.7% lead
18.4% swing from Labour to National
National: 83.1% (up 17.6%)
Labour: 14.3% (down 19.1%)
Individual vote results
54.4% Unionist lead
23.8% swing from Labour to Unionist
Unionist: 68.8% (up 28.5%)
Labour: 14.3% (down 19.1%)
Liberal: 14.3% (down 10.9%)
Communist: 2.6% (up 2.6%)
Seat Results
Unionist: 5 seats (up 2)
Labour: 0 seats (down 1)
Liberal: 1 seats (down 1), 1 uncontested
Communist: 0 seats (no change)
Aberdeenshire [County], 1931
National HOLD
01.08.2025 08:45 —
👍 2
🔁 0
💬 1
📌 0
Scotland breakdown thread, 1931
#UKEC1931
01.08.2025 08:45 —
👍 3
🔁 0
💬 1
📌 1
🎉 Anything but National
31.07.2025 21:46 —
👍 2
🔁 1
💬 0
📌 0
National: 506
Nationalist: 3
41 counties in, with just 16 left to go, we finally have a second colour
31.07.2025 21:47 —
👍 3
🔁 0
💬 1
📌 0
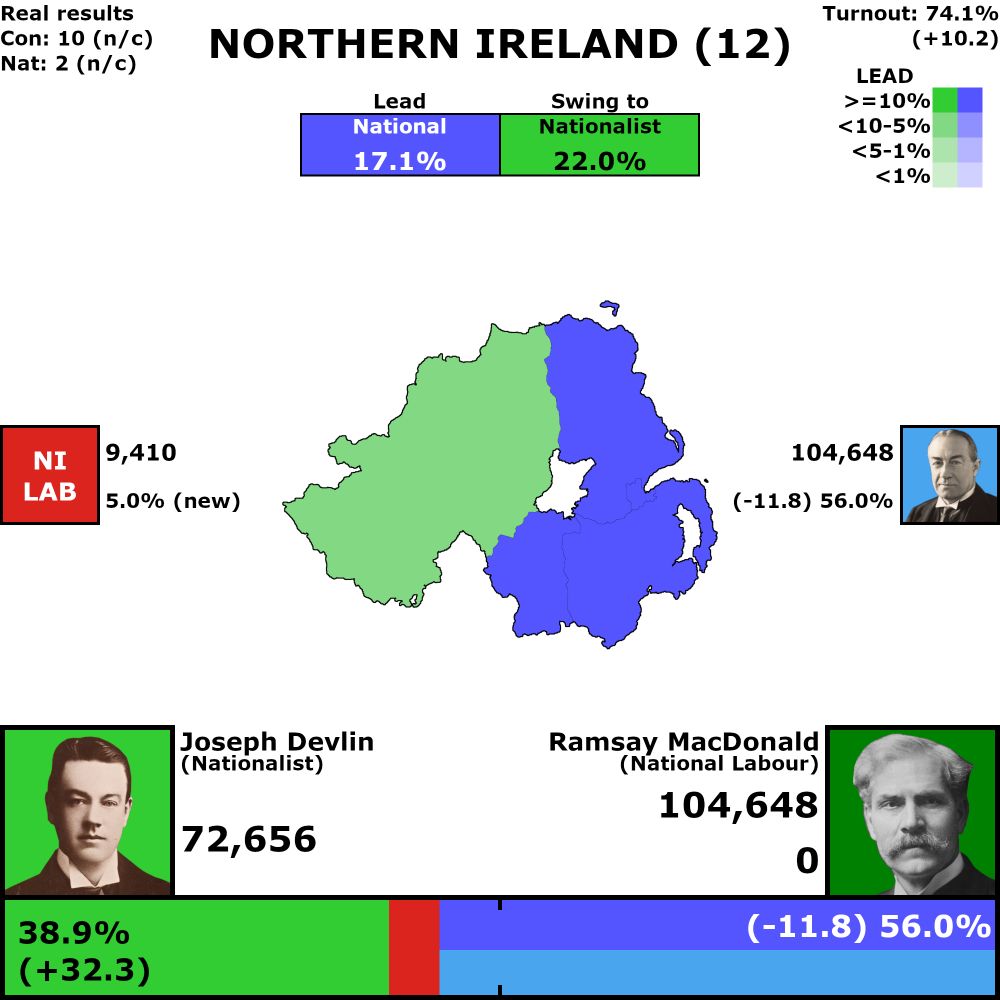
Northern Ireland, 12 seats across 6 counties
74.1% turnout (up 10.2%)
17.1% National lead
22.0% swing from National to Nationalist
Ulster Unionist: 56.0% (down 11.8%)
Nationalist: 38.9% (up 32.3%)
NI Labour: 5.0% (up 5.0%)
Seat results
Ulster Unionist: 10 seats (no change), 3 uncontested
Nationalist: 2 seats (no change)
NI Labour: 0 seats (no change)
Northern Ireland [Country/Region]
31.07.2025 21:41 —
👍 3
🔁 0
💬 0
📌 0
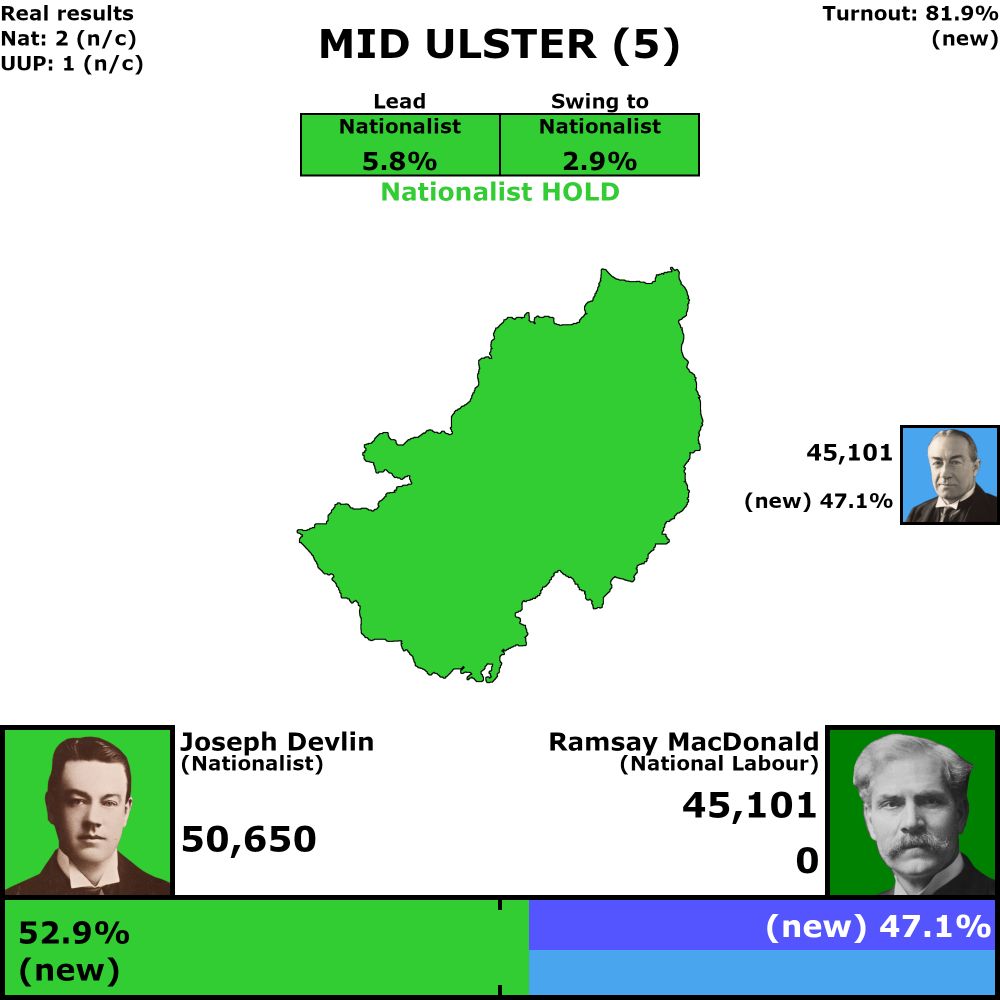
Mid Ulster, 3 votes
81.9% turnout (up 81.9%)
Nationalist hold, 5.8% lead
2.9% swing from National to Nationalist
Nationalist: 52.9% (up 52.9%)
Ulster Unionist: 47.1% (up 47.1%)
Seat Results
Nationalist: 2 seats (no change)
Ulster Unionist: 1 seats (no change), 1 uncontested
Mid Ulster [County], 1931
Nationalist HOLD
31.07.2025 21:40 —
👍 4
🔁 0
💬 2
📌 0
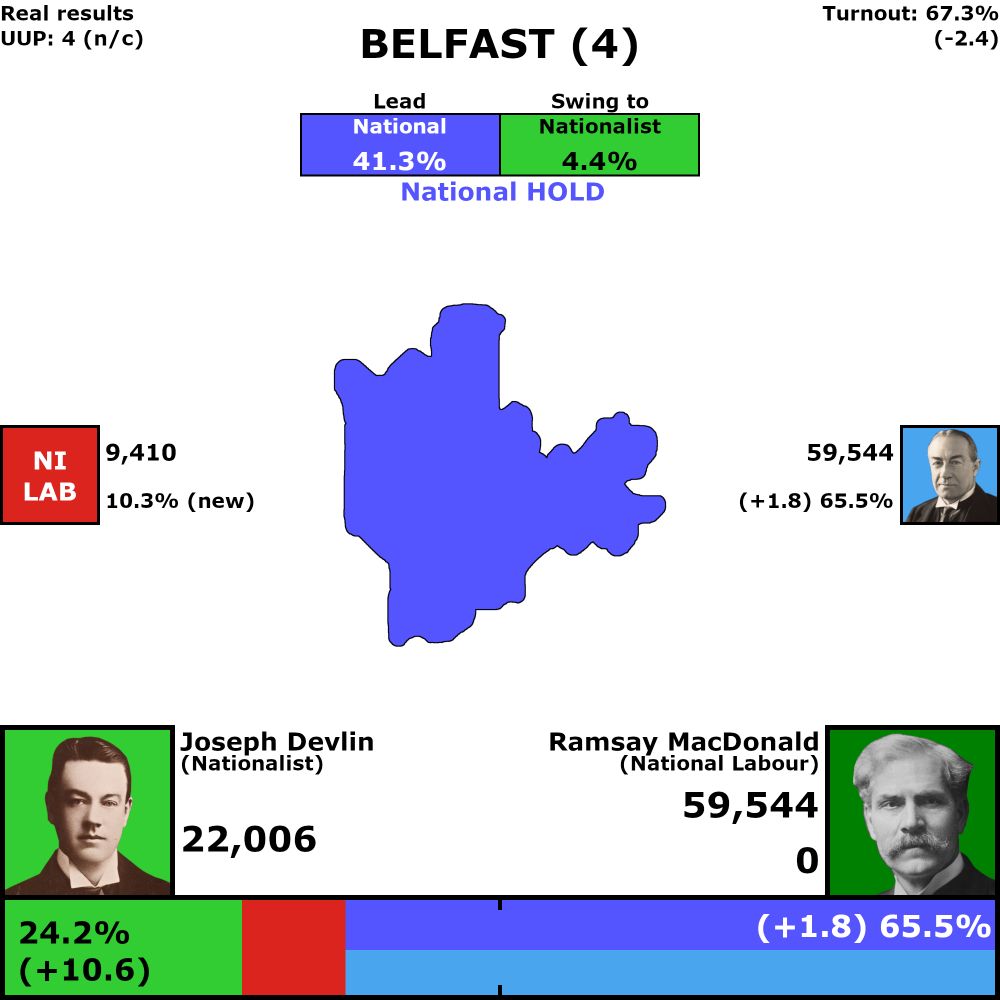
Belfast, 4 votes
67.3% turnout (down 2.4%)
National Hold, 41.3% lead
4.4% swing from National to Nationalist
Ulster Unionist: 65.5% (up 1.8%)
Nationalist: 24.2% (up 10.6%)
NI Labour: 10.3% (up 10.3%)
Seat Results
Ulster Unionist: 4 seats (no change), 2 uncontested
Nationalist: 0 seats (no change)
NI Labour: 0 seats (no change)
Belfast [County], 1931
National HOLD
31.07.2025 21:39 —
👍 3
🔁 0
💬 1
📌 0