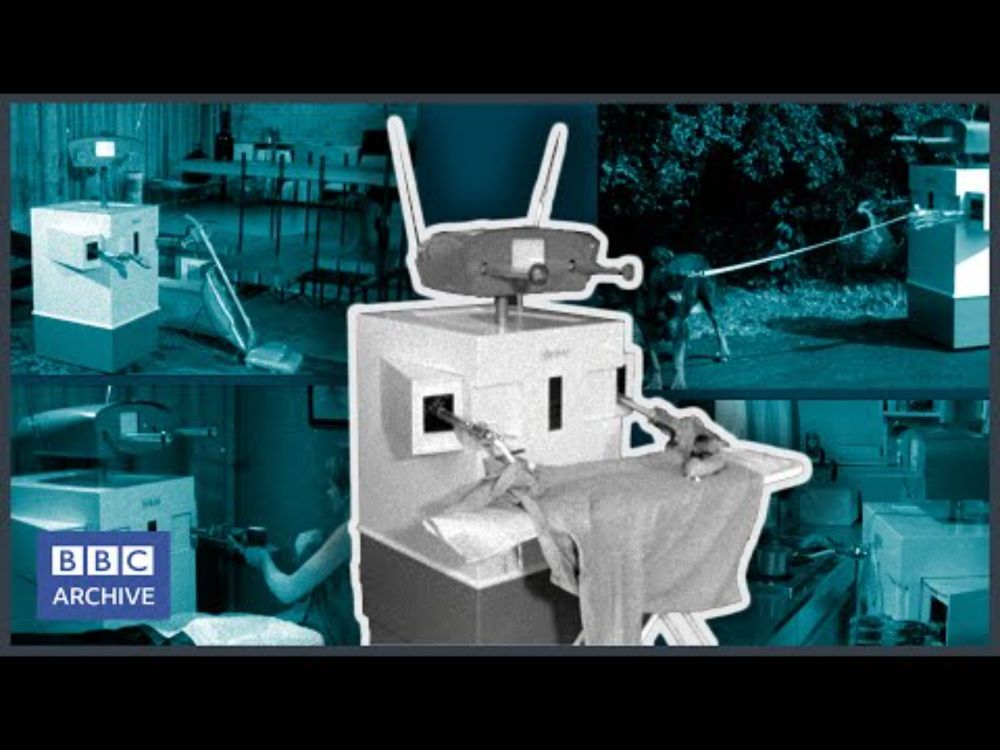
"if we had a million pounds we could get a working robot in ten years"
1966
youtu.be/T282C7cjWwg?...
@alex-lex.bsky.social
Data visualization researcher. Associate Prof of CS at the University of Utah. Lab website: https://vdl.sci.utah.edu. Co-founder of datavisyn: https://datavisyn.io
"if we had a million pounds we could get a working robot in ten years"
1966
youtu.be/T282C7cjWwg?...
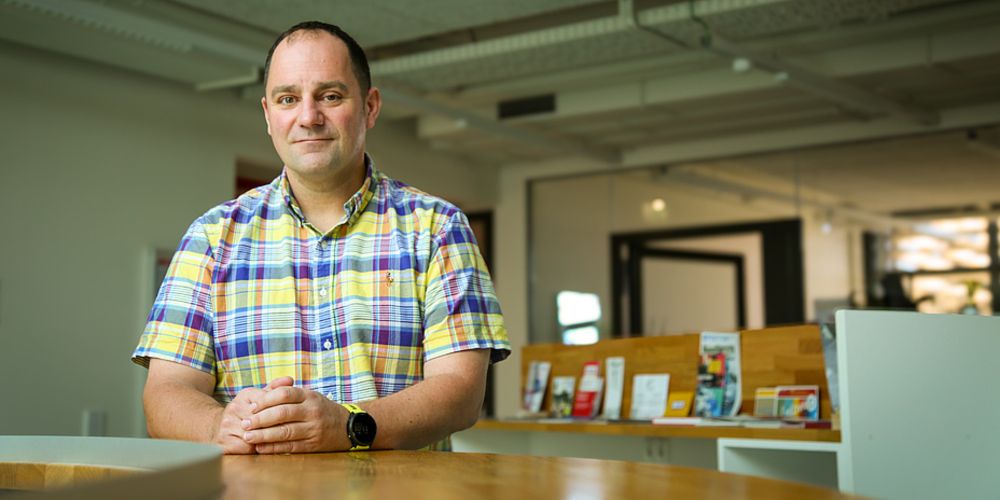
My new (and old) university TU Graz interviewed me about my return to Austria. Check it out; available in English and German.
www.tugraz.at/news/artikel...
When I started @neuromadlab.bsky.social in 2017, we decided to publish all empirical papers as preprints. It helped us gain traction in the early days and avoid the kind of gate keeping of less convenient results. The benefits far outweighted any potential risk. I never regretted preprinting.
02.07.2025 07:30 — 👍 28 🔁 7 💬 0 📌 0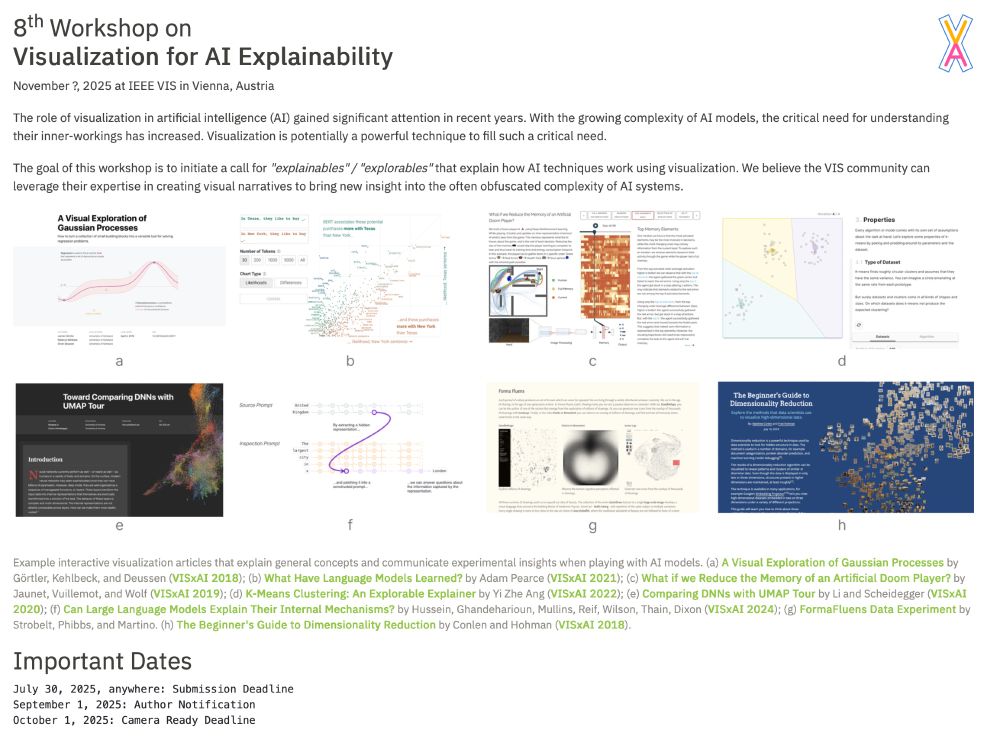
It's on! In its 8th year, the original VISxAI workshop wants your contributions for explaining ML/AI/GenAI principles. Please consider to submit.
Deadline: July 30
webpage: visxai.io
#ML #AI #GenAI #Visualization
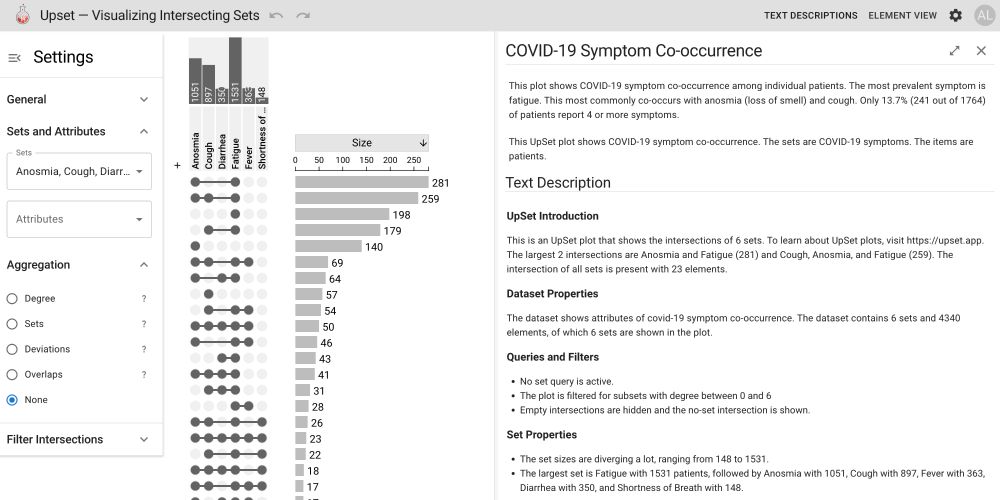
We all love upset plots (the best way to represent set data), but how do we make them accessible to everyone?
To answer this we { @maggiemccracken.bsky.social, @alex-lex.bsky.social, and others } developed a system (and ran a bunch of studies) to figure it out!
vdl.sci.utah.edu/blog/2025/06...
If you're at EuroVis, join us for our reVISit tutorial tomorrow at 9 to learn about how to make powerful online user studies! diglib.eg.org/items/765579...
04.06.2025 09:58 — 👍 2 🔁 0 💬 0 📌 0~45% of US corn production is now used to make ethanol, mostly for mixing into gasoline.
That's ~13% of all US crop land already used for energy production.
Using some of the same land for solar panels would capture 50-100 times more energy per acre.

If you're curios about how reVISit can help you run your user studies, join us for a meetup at #CHI2025 tomorrow from 9:00-10:30 in Room G218!
revisit.dev
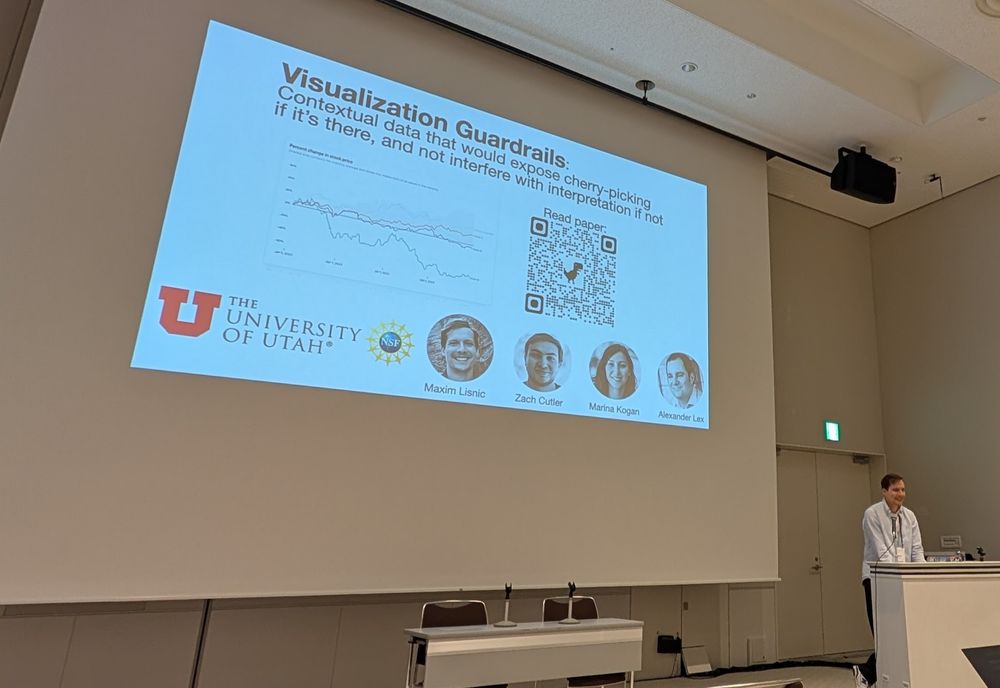
Max presenting at CHI
Maxim Lisnic is having a busy day presenting two #chi2025 papers on "guardrails against cherrypicking" and on "composing text in dashboard tools". Max is on the job market for PostDocs and academic positions. Talk to him if you're hiring!
vdl.sci.utah.edu/publications...
dl.acm.org/doi/10.1145/...
good vis design is a lot harder an optimization problem than the data-ink ratio makes it seem, and talking about it as if it were that simple has misled many people into confidently creating bad charts, including Tufte
23.04.2025 17:55 — 👍 6 🔁 3 💬 2 📌 0I’ll be joining the Institute of Human-Centred Computing – hcc.tugraz.at – and look forward to new collaborations with the fantastic team there.
I’ll stay closely connected to Utah, continuing my work with the amazing team at the SCI Institute and the Kahlert School of Computing.

The clock tower of Graz and the city in the background.
After an incredible decade at the University of Utah, I’m happy to share that I’ll be returning to my alma mater, TU Graz, this fall as a Professor of Human-Computer Interaction.
I’ll be hiring a PhD student and a PostDoc in Graz—if you're interested in HCI and visualization get in touch!
Check out SCI's contributions to #CHI2025 this year, including two papers and a course from our lab.
Can guardrails mitigate cherry picking in data explorers?
vdl.sci.utah.edu/publications...
Can you do Think Aloud studies on crowdsourced platforms?
vdl.sci.utah.edu/publications...
We’ll also hold an in-person get-together for course participants and anyone interested in reVISit in Room G218, 9:00–10:30am on Thursday, May 1.
11.04.2025 14:02 — 👍 0 🔁 0 💬 0 📌 0Course details:
Title: Running Online User Studies with the reVISit Framework
Mounday, Apr 28, 11:10 AM – 5:50 PM (with breaks)
Session links:
programs.sigchi.org/chi/2025/pro...
programs.sigchi.org/chi/2025/pro...
programs.sigchi.org/chi/2025/pro...
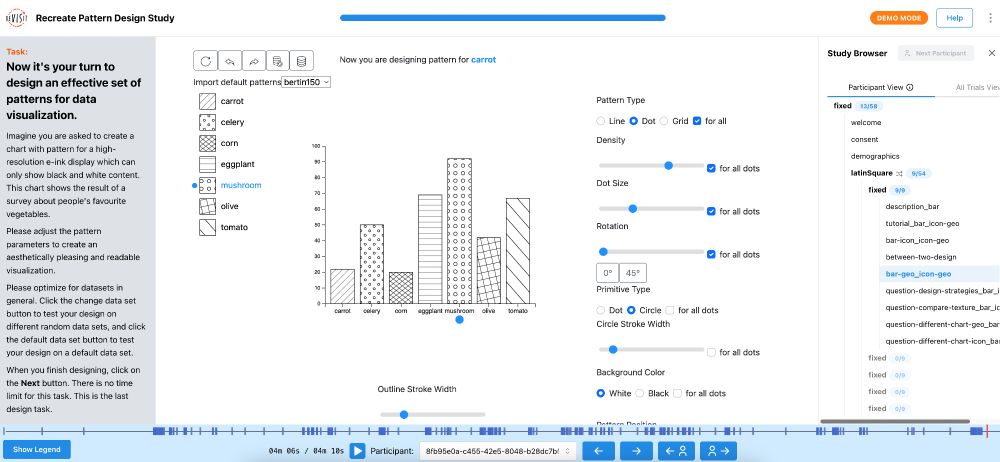
A screenshot of the reVISit interface showing the answers and provenance from a participant who completed the question. The study shown is a replication of He et al.’s pattern design study.
Going to #CHI2025 in Japan? Interested in running user studies?
Sign up for our virtual CHI 2025 course that teaches you how to use reVISit, a new, open-source user study tool reducing the tedium of study design. Come learn through some practical examples.
cvent.me/g5mx2w
revisit.dev

It’s the time of the year when students accepted to graduate programs make decisions on where to go, while others might still be anxiously waiting to hear back. Unfortunately, the grad admissions process is opaque, so I’ve written a post that gives background: vdl.sci.utah.edu/blog/2025/04...
09.04.2025 12:55 — 👍 2 🔁 1 💬 0 📌 0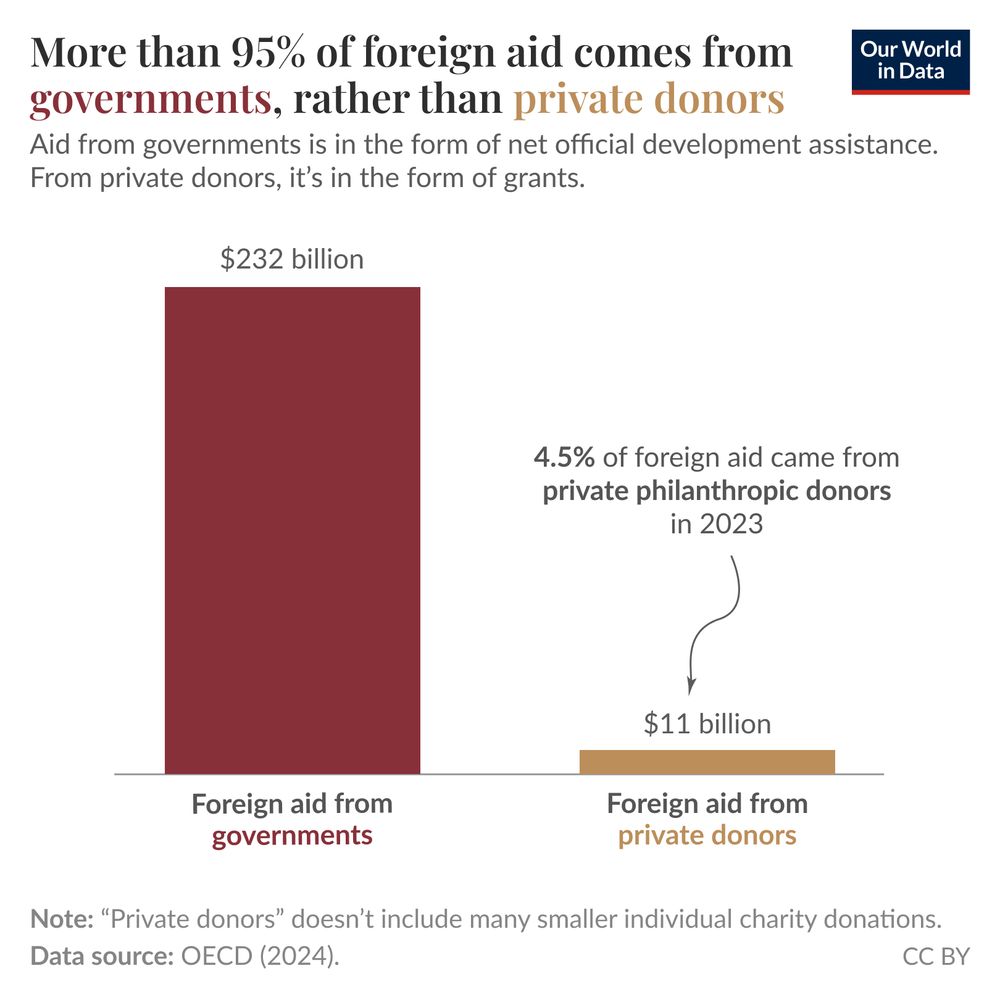
A bar graph titled "More than 95% of foreign aid comes from governments, rather than private donors" illustrates the distribution of foreign aid in 2023. The left portion shows a large maroon bar labeled "Foreign aid from governments," reaching $232 billion. The right section features a smaller tan bar labeled "Foreign aid from private donors," indicating $11 billion. A note beside the tan bar states that 4.5% of foreign aid came from private philanthropic donors. The footnote specifies that "Private donors" refers to philanthropic foundations reporting to OECD and excludes many individual charity donations or private investments. The data source is attributed to OECD (2024) and indicates that the information is shared under a Creative Commons BY license.
Most of the world’s foreign aid comes from governments, not philanthropic foundations
08.04.2025 18:39 — 👍 129 🔁 49 💬 2 📌 4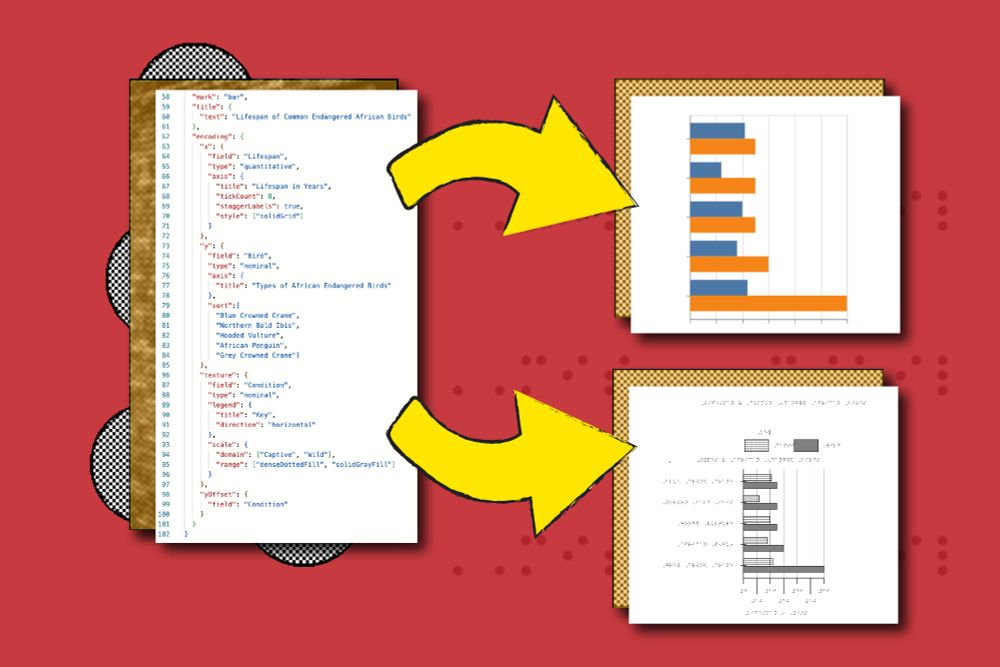
Tactile charts are an important tool for conveying data to blind and low vision people via embossed paper. However, tactile charts require high levels of time and expertise to design.
Introducing Tactile Vega-Lite, new work at #CHI2025 led by MIT SM student Katie Chen
news.mit.edu/2025/making-...
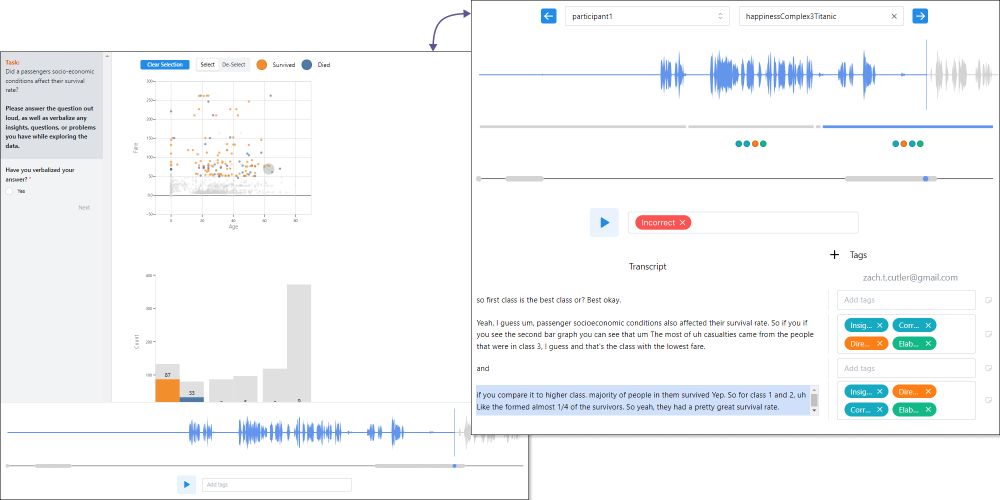
Can you run a think-aloud study via crowdsourcing? Yes you can! We used reVISit for running and analyzing online TA studies. And yes, online participants do actually speak, though they’re more critical than lab participants. Check out the CHI paper: vdl.sci.utah.edu/publications... #datavis #chi2025
20.03.2025 23:46 — 👍 4 🔁 0 💬 0 📌 0Unfortunately you do need to use a computer
20.03.2025 02:24 — 👍 0 🔁 0 💬 0 📌 0We're still looking for a few more participants!
20.03.2025 02:02 — 👍 0 🔁 0 💬 0 📌 01) Cool VIS study, 2) Help our replication effort! ->
19.03.2025 14:13 — 👍 0 🔁 2 💬 0 📌 0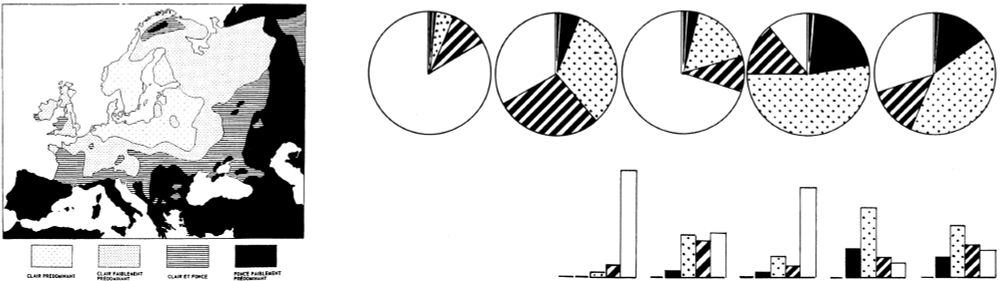
Different visualizations - a map, a pie chart, a bar chart, using black and white patterns.
How can we use black-and-white patterns in visualization? If you have visualization design experience, we’d love your input! We’re running a short study (less than 20 minutes) where you’ll experiment with designing patterns for a chart.
Please participate here revisit.dev/replication-...
Thank you!
Your dignity honors the bravery of the Ukrainian people.
Be strong, be brave, be fearless.
You are never alone, dear President Zelenskyy.
We will continue working with you for a just and lasting peace.
Yeah, there is just a huge mismatch in type it seems. I also think a chat interface as a means to create a graphical output is always going to be a terrible fit. It's like driving a car with voice commands - beyond awkward. I don't think in sentences when I am designing a map... maybe others do?
26.02.2025 02:18 — 👍 3 🔁 2 💬 1 📌 0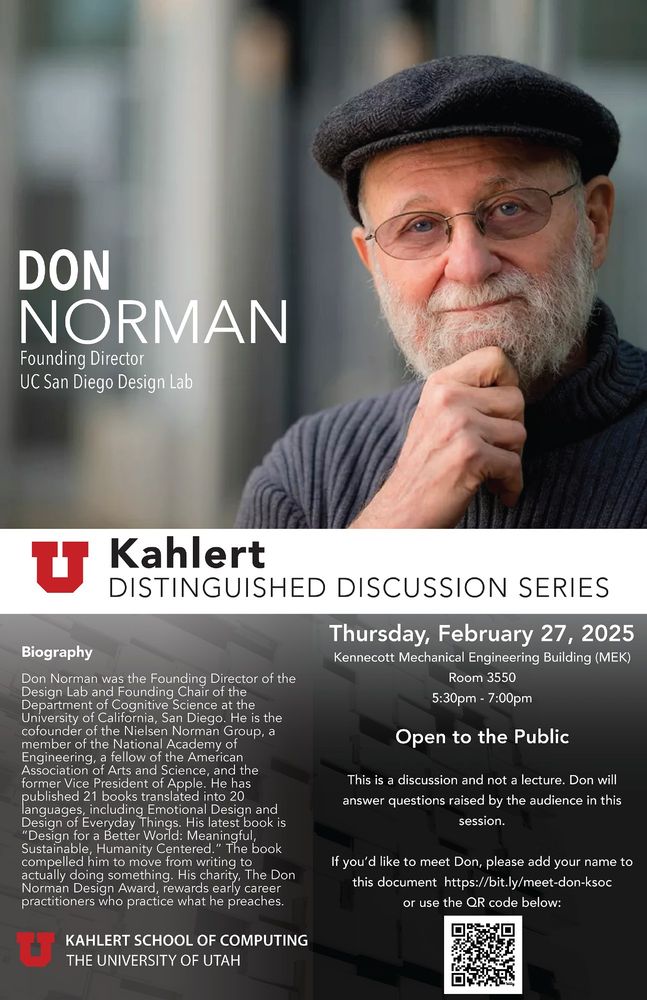
Mark your calendars for this Feb. 27 discussion with Don Norman, a renowned expert in user-centered design and beyond. He's among the most cited researchers in the world. 🔥
Norman will be hosted by Vineet Pandey, one of the inaugural faculty fellows in SCI's One-U Responsible AI Initiative.
Do you work with text data for your job or research? We’d love to talk to you!
We're running a paid user study to understand how people explore and visualize text data while programming—and to gather feedback on our new open-source visualization tool.
Details below 👇
reVISit 2.0 Highlight: reVISit now supports Vega and Vega-Lite stimuli. You have the freedom to plug in Vega JSON configurations inline, or as a file. You can leverage interaction and reVISit's provenance tracking and interaction replay feature as well, with no extra effort. revisit.dev #datavis
10.02.2025 15:43 — 👍 2 🔁 1 💬 0 📌 1ReVISit 2.0 (revisit.dev) reached several exciting milestones recently:
📁 You can now define an entire experiment in a single file— from trial data, stimuli (visualizations and interactions, thanks to Vega-Altair), study blocks/sequences and randomization, questionnaires, etc.