An Engine of Fossil Discovery Fights Its Own Extinction
For #fossilfriday, The New York Times has written a good article about the Paleontological Research Institution, what the museum means to the field of Paleontology, and its current financial situation (much improved even from a few weeks ago).
🧪🦑⚒️🦣 #paleontology
www.nytimes.com/2025/12/19/s...
19.12.2025 18:54 —
👍 68
🔁 36
💬 2
📌 2
Asymmetric leading & trailing edge shifts actually led to mid-latitude colonisations, particularly coherent in North Atlantic. The Pacific however exhibited highly spatially heterogenous responses and had extirpation hotspots that are masked in large scale assessments.
19.12.2025 09:48 —
👍 0
🔁 0
💬 0
📌 0


New preprint! 🚨
doi.org/10.64898/202...
We tested the hypothesis that deglacial poleward range shifts (equatorial extirpations at trailing edges) - a mechanism consistent with marine responses under climate warming - drove the emergence of the bimodal LDG in planktonic forams. Spoilet alert: no.
19.12.2025 09:39 —
👍 4
🔁 0
💬 1
📌 0

📢New paper alert!
Museum collections reveal secrets of prehistoric seafloor🐟ecosystem, according to new paper by Dr Ming Khan @ming-tfk27.bsky.social, Dr @egmitchell.bsky.social and Prof Andrea Manica.
Read more: bit.ly/4j4EK9F
@bas.ac.uk
17.12.2025 11:32 —
👍 8
🔁 4
💬 0
📌 0

Numbers and data are cool and all but let’s not forget that fossils are at the heart of palaeo research, so here are some fossil photos taken from PRI’ Sketchfab!
#PalAss25 is happening now; I presented this work at PalAss24 last year & submitted the paper shortly after, nice to see it out now!
13.12.2025 10:51 —
👍 7
🔁 0
💬 0
📌 0
Despite some possible effect of clustered and uneven sampling (read the paper) our results do not support gradual extinction patterns in the end-Cretaceous, and evidence of thriving life supports a single, catastrophic extinction even in the high latitudes!
13.12.2025 10:51 —
👍 6
🔁 0
💬 1
📌 0

We found that KLB 7 (oldest) had nested clumped structures; KLB 8 hovered between quasi nested clumped and Clementsian, while KLB 9 (just prior to K-Pg) had complex Clementsian structures.
13.12.2025 10:51 —
👍 1
🔁 0
💬 1
📌 0
We then saw metacommunity complexity: testing whether spatial replacement of taxa occurs through space along some underlying environmental gradient as a consequence of biotic interactions or environmental filtering (complex Clementsian), or whether these is instead nested loss (nested clumped comms)
13.12.2025 10:51 —
👍 2
🔁 0
💬 1
📌 0

We studied only the Molluscan Units (KLB 7-9). The K-Pg boundary is at the top of KLB 9. We found that significantly non-random pairwise associations between taxa increased consistently up-section, suggesting a thriving seafloor community with nothing to suggest gradual loss of biodiversity.
13.12.2025 10:51 —
👍 3
🔁 0
💬 1
📌 0

These fossils were collected in the 1980s by Zinsmeister, Macellari and colleagues and are presently cared for at The Paleontological Research Institution in Ithaca NY. The map below shows the sampling locations across the López de Bertodano Formation, which is subdivided informally into KLB 1 - 10.
13.12.2025 10:51 —
👍 3
🔁 0
💬 1
📌 1
We (@rowanwhittlebas.bsky.social; @jdwitts.bsky.social; @huwiceandstuff.bsky.social ; @egmitchell.bsky.social and Andrea Manica) used ecosystem complexity (measured as non-random pairwise co-occurrences of taxa and metacommunity structure) as proxies to assess ecosystem health in latest Cretaceous.
13.12.2025 10:51 —
👍 5
🔁 1
💬 1
📌 0

New paper alert! 🚨 🐌
We studied historic Antarctic fossils from the Zinsmeister Collection to assess whether the K-Pg extinction, as recorded on Seymour Island, was sudden or gradual. We found that benthic life thrived in the 4 million years before the K-Pg.
doi.org/10.1016/j.pa...
13.12.2025 10:51 —
👍 42
🔁 18
💬 2
📌 2
That’s amazing!!! Well done!
12.12.2025 09:46 —
👍 1
🔁 0
💬 0
📌 0
Wayyyyyyy too long!
Below is an example of the kind of complex imagery we annotated, which went on to become part of the training dataset for the Antarctic seafloor project!
20.10.2025 17:33 —
👍 0
🔁 0
💬 0
📌 0
“Why didn’t you use AI to get the data” was the question I was asked most during my PhD.
There was no Antarctic dataset on which an AI model could learn. & it took me an average of 8 hours per photo to label everything.
@camerontrotter.bsky.social’s new model can do it in a matter of seconds.
20.10.2025 17:29 —
👍 1
🔁 0
💬 0
📌 0
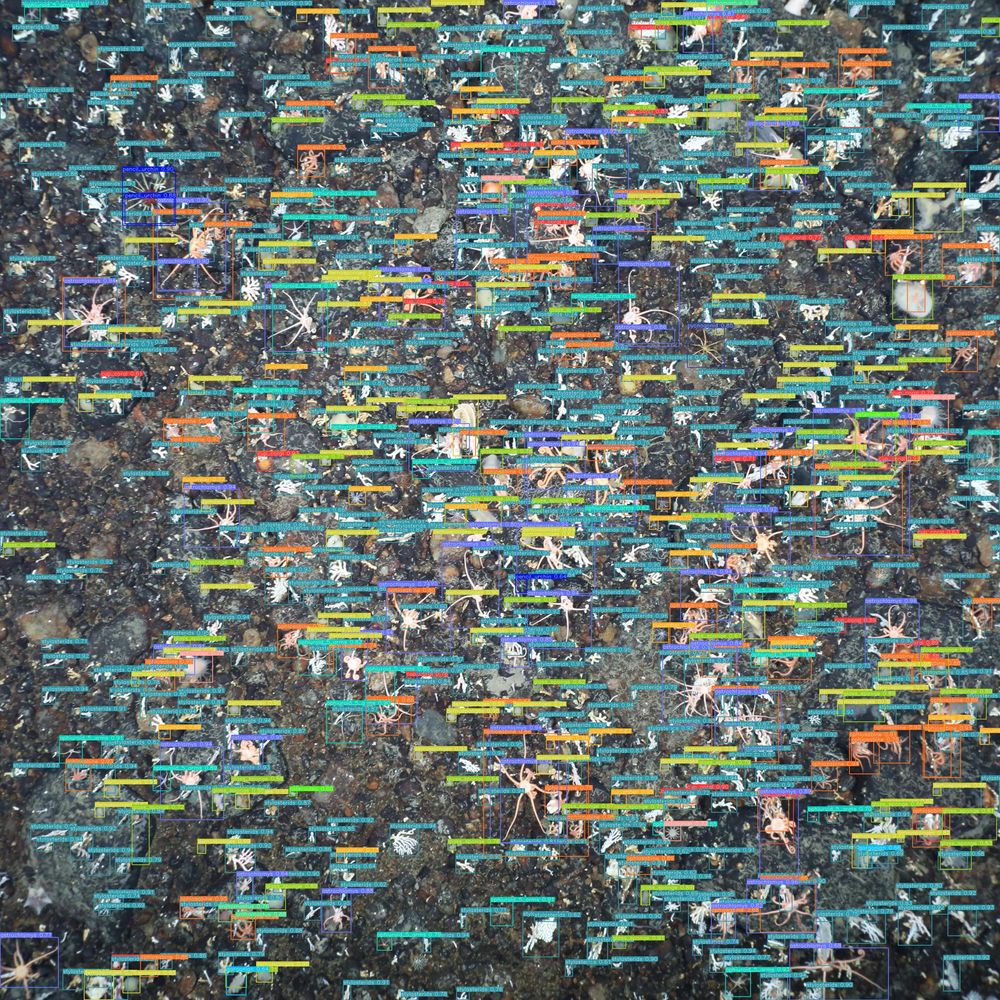
An example output from our framework. An image of the Antarctic seafloor, with hundreds of organisms on it. The organisms each have a bounding box around them, a class label, and a confidence score produced by our framework.
🇦🇶 Our new paper detailing the automated detection of Antarctic benthic organisms using high-res in situ imagery has been accepted to the #ICCV2025 Joint Workshop on Marine Vision!
📄 Read the preprint now: arxiv.org/abs/2507.21665
🧵1/4
30.07.2025 15:50 —
👍 7
🔁 5
💬 1
📌 0
Photoshopping @lastweektonight.com John Oliver onto fossils until the Paleontological Research Institution secures their funding!
Fossil shell of the ammonite Grossouvrites sp. from the Cretaceous Lopez de Bertodano Fmt of Seymour Isl, Antarctica (PRI 60629). Comedian is H. sapiens. Not to scale.
12.07.2025 11:32 —
👍 27
🔁 4
💬 0
📌 1
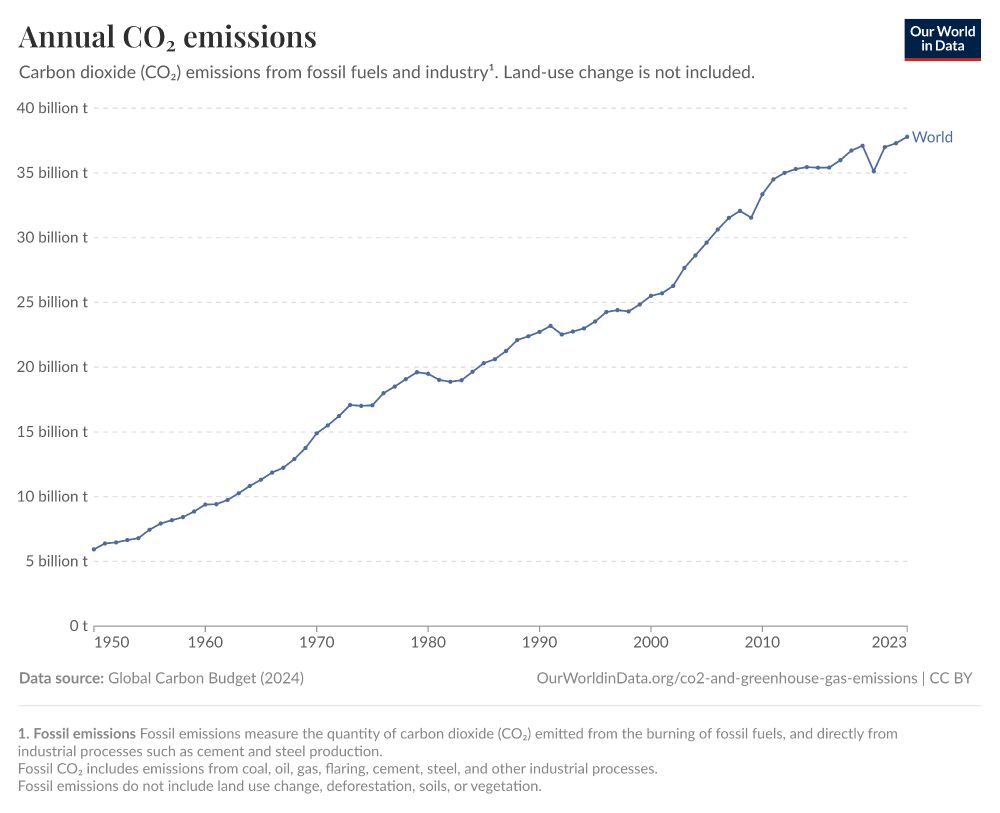
A line chart titled “Annual CO₂ emissions” shows the global carbon dioxide emissions from fossil fuels and industry from 1950 to 2023. The y-axis represents emissions in billions of tonnes (t), ranging from 0 to 40 billion t. The x-axis covers the years from 1950 to 2023.
The chart presents a steady increase in emissions from approximately 5 billion tonnes in 1950 to over 36 billion tonnes in 2023. Key features include:
A consistent upward trend from 1950 through the early 1970s.
A brief plateau and dip around 1980–1983.
A strong growth trend resuming in the late 1980s.
A sharp increase during the 2000s.
A slight drop around 2008–2009, likely due to the global financial crisis.
A major dip in 2020, attributed to the COVID-19 pandemic.
A rapid rebound in emissions after 2020, continuing the upward trend to a new high in 2023.
A blue line labeled “World” traces these changes over time.
Below the chart, the data source is listed as the Global Carbon Budget (2024), and the graphic is credited to OurWorldInData.org with a Creative Commons license (CC BY). A footnote explains that the data includes emissions from coal, oil, gas, flaring, cement, and steel, but excludes land-use changes such as deforestation.
I get annoyed at the narrative that all the awareness and work on climate change hasn't done anything. Yes, global CO₂ emissions indeed continue to climb, but we don't know the counterfactual. When I was in grad school, we were on track for 5°C of warming. Now it's below 3°C. That's progress.
22.06.2025 17:09 —
👍 2000
🔁 447
💬 76
📌 40
Lots of Earth System Modelling (🌍ESM) jobs up for grabs at @bas.ac.uk!
🫧 ESM - Past Carbon Cycle (w/ me and Xu Zhang)
🇦🇶 ESM - Antarctic Sea Ice
🌡️ ESM - Past Extremes
🧊 UKESM Sea Ice Model Developer
💧Research Assistant: Palaeoclimate Meltwater Modelling
www.bas.ac.uk/jobs/vacanci...
23.06.2025 13:50 —
👍 2
🔁 3
💬 0
📌 0
Photoshopping John Oliver onto fossils until the Paleontological Research Institution secures their funding!
Section of fossil tree fern, Tempskya wesselli, from the Cretaceous of Idaho. Comedian is H. sapiens. Not to scale.
25.05.2025 14:30 —
👍 42
🔁 8
💬 0
📌 3
@egmitchell.bsky.social @huwiceandstuff.bsky.social @rowanwhittlebas.bsky.social @camzoology.bsky.social @bas.ac.uk @newnhamcollege.bsky.social @awi.de
24.05.2025 15:55 —
👍 1
🔁 0
💬 0
📌 0
However, the pink morph exhibits dispersal plasticity, and is able to increase its dispersal distances, when in competition with the pink morph in mixed communities, increasing alpha diversity.
Coauthors Huw Griffiths, Nile Stephenson, Rowan Whittle, Autun Purser, Andrea Manica & Emily Mitchell.
24.05.2025 15:54 —
👍 1
🔁 0
💬 1
📌 0

Furthermore, we discovered that coexistence of the pink and orange morphs is due to inter-morph competition, with the orange morph emerging as the stronger competitor, maintaining its reproductive behaviour across all community types.
24.05.2025 15:51 —
👍 1
🔁 0
💬 1
📌 0

Using Spatial Point Process Analysis, a method borrowed from forest ecology, we discover that limited dispersal, rather than environment, structured the spatial arrangement of the cup corals. Dispersal limits of 6-10 cm suggests these cup corals are likely brooders, which produce crawl-away larvae.
24.05.2025 15:50 —
👍 2
🔁 0
💬 2
📌 0
We ask two questions: what processes drive the spatial distribution of Antarctic epibenthic communities at centimeter scales, which has largely been put down to “unknown biological factors”? Second, how do two, apparently very ecologically similar morphs coexist on the Powell Basin?
24.05.2025 15:49 —
👍 1
🔁 0
💬 1
📌 0

In in-situ seabed photos, they are only distinguishable by the colour of their tentacles, so we term them the “pink” and “orange” morphs. The corals form mixed communities and single population dominant communities, where either morph is near-absent.
24.05.2025 15:48 —
👍 2
🔁 0
💬 1
📌 0

New paper alert! 🚨
rdcu.be/entY4
In the second paper of my PhD, published today in Scientific Reports, we investigated the spatial ecology of two solitary scleractinian coral morphotoypes, which are likely Caryophyllia or Flabellum, from the Powell Basin slopes of Antarctica 🇦🇶 .
24.05.2025 15:48 —
👍 17
🔁 3
💬 1
📌 0