We're hiring a working student to curate the Data Vis Dispatch
Help us create our most popular weekly blog format, featuring the best new data visualization.
Want to get paid for looking at beautiful data visualizations from the world's leading newsrooms and visualization specialists? 🗺️ 📊 👀
We're hiring a working student to curate the Data Vis Dispatch. 🗞️
If you're a student in Germany, we'd love to hear from you! 👇
www.datawrapper.de/careers/work...
13.01.2026 15:25 —
👍 7
🔁 6
💬 1
📌 1

In einem Diagramm wird aufgezeigt, dass im April 2025 weltweit erstmals mehr Strom durch Solarenergie als durch Atomkraft erzeugt wurde.
Fast unbemerkt brachte der April einen weiteren kleinen Meilenstein der #Energiewende. Weltweit wurde erstmals mehr Strom durch #Photovoltaik als durch #Atomkraft erzeugt. In nur fünf Jahren hat sich laut des Analysediensts Ember die Solarstromerzeugung verdreifacht! #Energiewende
23.05.2025 12:46 —
👍 165
🔁 54
💬 7
📌 2

How to get to space | Datawrapper Blog
Hey, Ivan here 👋 ! I work on developing visualizations at Datawrapper. A few days …
If you want to get to space, where should you start? On Earth, of course! In this Weekly Chart, our vis developer Ivan explores the possible starting points for a voyage into orbit and beyond 🛰️ 🌖
03.04.2025 17:31 —
👍 1
🔁 2
💬 0
📌 0

Small multiple column chart showing UK Government spending as shares of GDP between 1970 and 2020 in the Health, Education, and Defence category. It shows, for example, that health spending in 2020/21 was £179 billion higher than pre-pandemic plans, and that education spending as a share of GDP peaked in 2009 and has declined since.

Small multiple column chart of the population of the world's largest cities, 1950-2035. It shows that Delhi, Dhaka and Mumbai grow the most, while Tokyo peaked at around 2020. Paris was once the biggest city, but not anymore – it grew the most between 1851 to 1856 (by over 20%).

Small multiple column chart of countries with higher and lower education spending than the world average. Iceland, Denmark, Sweden, Finland and others spend more, while Ireland, Italy, China, India, Russia, and others spend less than the world average.

Small multiple column chart showing that German Baby Boomers use Facebook the most – 57% of them use it. 50% use YouTube; 32% use Instagram; 18% use Pinterest.
🎉🎉 🎉 You can now create small multiple column charts in Datawrapper – for both time series and categorical data! Highlight individual columns, display values on all of them, add annotations, overlays, range highlights, and more: https://blog.datawrapper.de/small-multiple-column-charts/
18.02.2025 14:41 —
👍 84
🔁 8
💬 4
📌 6

What we built for you in 2024 - Datawrapper Blog
It’s been a busy year at Datawrapper! Since the start of 2024, we’ve developed two new visualization types, launched a PowerPoint add-in, introduced text
In 2024, Datawrapper's designers and developers created 15 big new features and many smaller updates and improvements 🎆
What are they most proud of? What were the challenges and surprises? Read their answers on our blog:
16.12.2024 21:19 —
👍 22
🔁 3
💬 1
📌 0

Data Vis Product Designer - Datawrapper
We’re looking for a Data Vis Product Designer to join our team, to improve and extend our UI that thousands of people are using.
🚨 You want to improve and extend an UI that thousands will use, and design the elements of data visualizations millions will see? Join us at a Data Vis Product Designer!
20.11.2024 13:00 —
👍 14
🔁 3
💬 0
📌 0
Bluesky is such a breath of fresh air.
No random algorithmic posts shoved into my timeline, no in-app web browser (🤮), no auto-updating feed if I don't touch the app for 30 seconds.
Back to basics. Hope it stays this way.
19.11.2024 09:35 —
👍 7
🔁 0
💬 1
📌 0
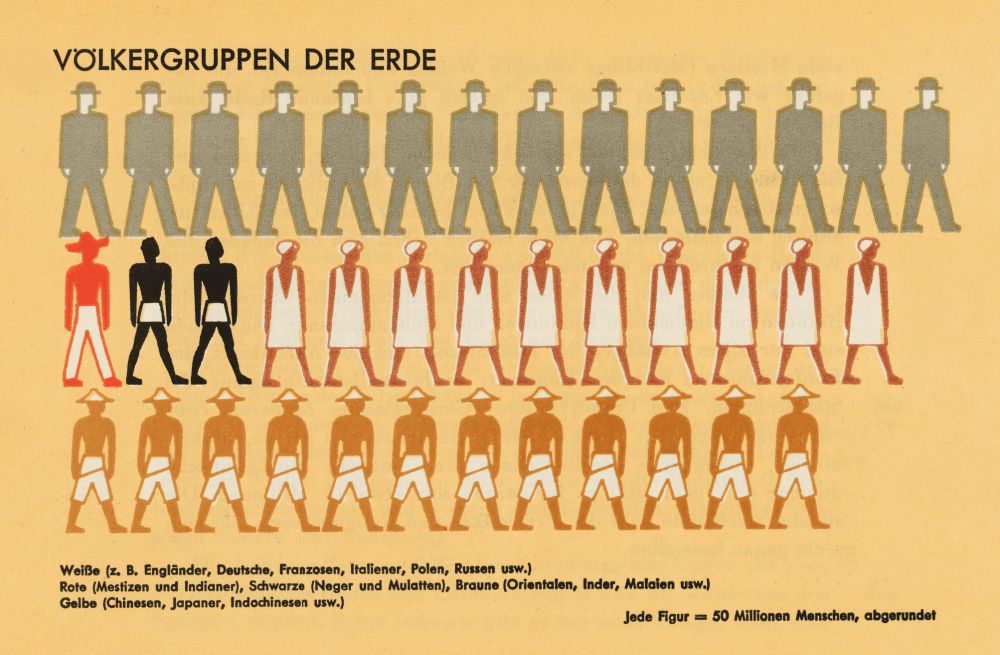
Love the artwork evolution.
Still a proud first edition owner!
15.11.2024 14:16 —
👍 0
🔁 0
💬 1
📌 0
Think this social media post is boring? Help us make it better! Our communications team (@lisacmuth.bsky.social, Rose, Guillermina + Vivien) is looking for someone to help us improve our social media game and keep our blog up to date: https://blog.datawrapper.de/hiring-werkstudentin-social-media/
18.10.2024 07:19 —
👍 6
🔁 2
💬 0
📌 0