We're hoping these results can help identify geographic regions of highest priority for targeted forest management and raise alarm bells for these previously unidentified species that may be exposed to greatest risk.
19.02.2026 17:30 —
👍 5
🔁 0
💬 0
📌 0

Histogram showing species with highest predicted exposure to high severity fire, with the flammulated owl being the most exposed species.
We also identified species predicted to have greatest exposure to high severity fire (in the western US) across their global range, including some fire-loving species (White-headed Woodpecker, Mountain Quail) and fire-prone species (Flammulated Owl, Brown-capped Rosy-finch).
19.02.2026 17:30 —
👍 5
🔁 0
💬 1
📌 0

Bar plots showing how avian hotspots are distributed across predicted low and high severity fire.
We found ~30% of hotspots are expected to burn at high severity, and of those hotspots the majority were historically exposed to predominantly low severity regimes, indicating a significant mismatch between what the resident biodiversity is adapted to and what it may be exposed to in the future.
19.02.2026 17:30 —
👍 4
🔁 1
💬 1
📌 0

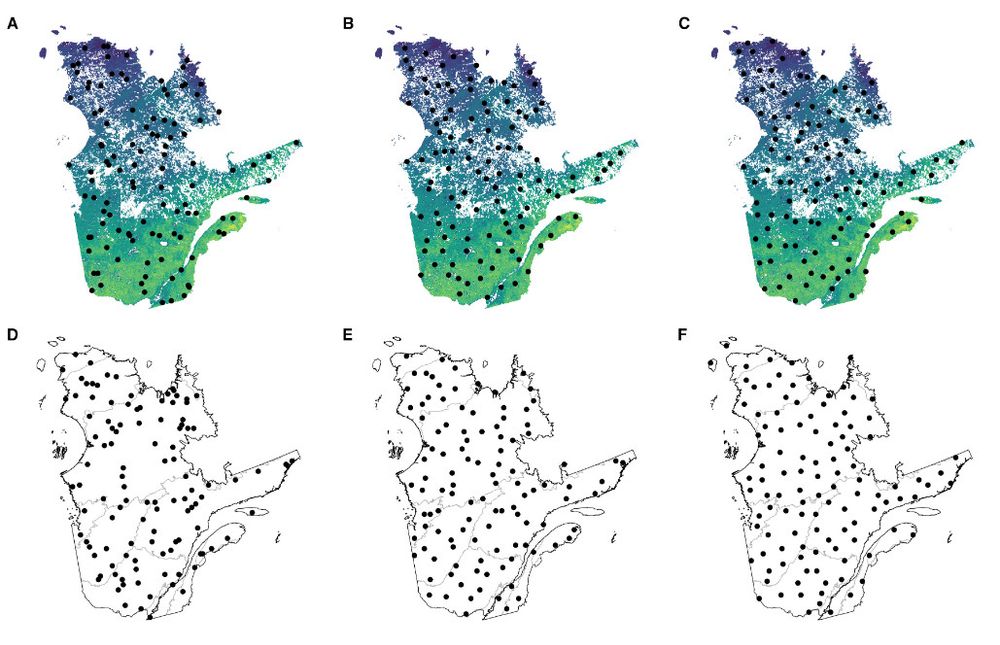
A series of maps of the western US showing where different aspects of avian diversity intersect with fire severity types.
Using eBird data products and forecasted fire severity we identified hotspots of bird species richness, functional richness, and community uniqueness and classified them into "areas of concern" or "refugia" based on whether they're predicted to burn at high or low severity.
19.02.2026 17:30 —
👍 2
🔁 0
💬 1
📌 0
This is a real tour de force by Maria Isabel. This paper is, put together, a whole century of CPU time done with the help of Calcul Québec. We will also be moving some of the outputs to BON-in-a-Box, @geobon.org cloud-based tool to facilitate the reporting of biodiversity indicators.
14.01.2026 13:14 —
👍 4
🔁 4
💬 0
📌 0
Thought our experience earlier this year receiving 8 reviews, some of which were for the wrong paper, was a bizarre one-off. Apparently not!
19.12.2025 00:37 —
👍 2
🔁 0
💬 0
📌 0
Yes, a great time was had by all 👍👍👍
18.12.2025 23:50 —
👍 5
🔁 0
💬 1
📌 0

Opportunities
***PhD and MSc openings – Movement ecology and conservation*** I will periodically support graduate students, postdocs, and other staff through the Biology Department at the University of New…
I’m recruiting a PhD and MSC student for fall 2026 working on the movement ecology and conservation of Mexican spotted owls in SW forests and rocky canyonlands. Exciting partnership with Los Alamos National Laboratory. Great vibrant lab group, high impact research! 🦉
gavinmjones.com/opportunities/
05.12.2025 19:30 —
👍 94
🔁 77
💬 3
📌 0

The role of AI in ecology’s computational carbon footprint
Click on the article title to read more.
With all the conversation surrounding the environmental impact of AI, we decided to give our two cents on what it all means for ecologists! esajournals.onlinelibrary.wiley.com/doi/10.1002/...
28.11.2025 18:00 —
👍 9
🔁 2
💬 0
📌 0

The Equilibrium Conundrum
Although an assumption of equilibrium dynamics underlies most ecological theory, the evidence for this dynamic in nature and in empirical studies is scarce. This creates an unfortunate disconnect bet...
Most major theories in ecology assume some sort of equilibrium, but only ~half of empirical tests acknowledge it & even fewer observed it in their system. Does this matter? How did the idea become so pervasive in ecology anyway? Find out in our new paper! onlinelibrary.wiley.com/doi/10.1111/...
04.11.2025 16:37 —
👍 35
🔁 15
💬 1
📌 0
Really excited to have been a part of this one! Hopefully sparks some conversation about what exactly we want our protected areas to *do*.
24.03.2025 22:33 —
👍 15
🔁 2
💬 0
📌 0
Some postdoc work up now up as a preprint! ecoevorxiv.org/repository/v... Choosing sites for monitoring biodiversity is critical for robust inference - so which algorithm should you use to pick sites? We found similar performance for algos and outline the features that might influence your decision.
12.02.2025 16:39 —
👍 23
🔁 6
💬 1
📌 0

Two directed acyclic graphs showing causal relationships. The first shows a simple relationship between the presence of rare plant species (x), illustrated with icons of individual plants, and grassland productivity (y), illustrated with icons of grasses. There is an arrow going from x to y. The second shows the same relationship, but this time with omitted variables (u). The omitted variables include observed omitted variables (like precipitation) and unobserved omitted variables (like legacies of agricultural activity). These are illustrated with an icon of a rain cloud, a fence, and a shovel. There are dashed arrows going from the omitted variables to both x and y.
New paper from me + @lauradee.bsky.social on using causal inference methods and concepts in ecology! onlinelibrary.wiley.com/doi/10.1111/... (1/5)
21.01.2025 18:00 —
👍 57
🔁 21
💬 1
📌 5
I'd love to be added!
15.01.2025 16:23 —
👍 1
🔁 0
💬 1
📌 0
tl;dr: big changes can happen in the functional space even when species-based metrics look otherwise stable through time, and on the flip side, losses/gains of species or changes in species identity can have little to no impact on the functional space
Please dm me for a pdf if you're paywalled!
07.01.2025 22:47 —
👍 3
🔁 0
💬 0
📌 0
We also found that individual studies fell into four general groups: no change in species or functional metrics, functional diversity change independent of species change, loss of functional redundancy, and increasing species richness.
07.01.2025 22:47 —
👍 2
🔁 0
💬 1
📌 0

We found no trend across communities in functional richness, evenness, or divergence - in line with other species-based work. This also held true for almost all models of the means of individual trait axes.
07.01.2025 22:47 —
👍 1
🔁 0
💬 1
📌 0