It happened again...
I represented one of three offers in an offer presentation yesterday.
Seller decided to terminate and list for $300k more.
GTA real estate in 2025 in a nutshell.
07.10.2025 15:34 — 👍 0 🔁 0 💬 0 📌 0
IN SUMMARY:
1. MOI has set a new YTD high.
2. Rate of sales has slowed in August 2025, especially compared to 2024.
3. Active listings below 30k for the first time since May.
8/8
25.08.2025 14:30 — 👍 0 🔁 0 💬 0 📌 0

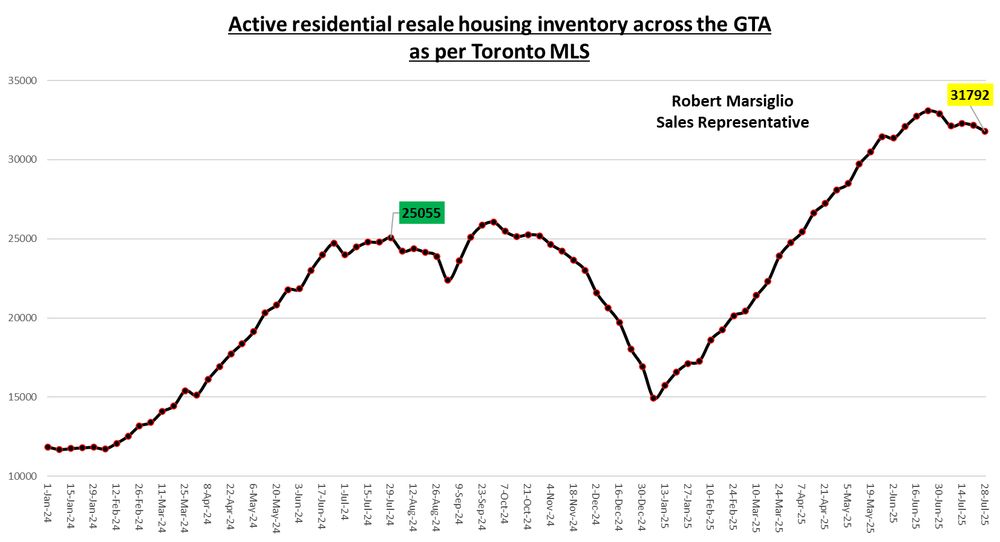
For the first time since my May 12 reading, GTA active listings are back under the 30,000 mark.
One more drop next week before the (potential?) fall inventory flood.
7/8
25.08.2025 14:30 — 👍 0 🔁 0 💬 1 📌 0

Lastly, active inventory continued it's drop.
TO Free: 3,738 (🔻72 or 1.89%)
TO Condo: 7,350 (🔻145 or 1.93%)
Durham: 2,981 (🔻160 or 5.09%)
York: 6,075 (🔻69 or 1.12%)
Peel: 6,016 (🔻126 or 2.05%)
Halton: 3,234 (🔻110 or 3.29%)
6/8
25.08.2025 14:30 — 👍 0 🔁 0 💬 1 📌 0

Here is the year-over-year comparison of rate of sales.
2025 has seen a slow down that 2024 didn't.
5/8
25.08.2025 14:30 — 👍 0 🔁 0 💬 1 📌 0

Here is the GTA wide picture that really highlights the slow down in rate of sales.
It's down about 900 in the last three weeks.
4/8
25.08.2025 14:30 — 👍 0 🔁 0 💬 1 📌 0

The big driver for the MOI spike has been the slow down in sales through August.
TO Free: 741 (🔻62 or 7.72%)
TO Condo: 978 (🔻38 or 3.74%)
Durham: 662 (🔻35 or 5.02%)
York: 944 (🔻13 or 1.36%)
Peel: 886 (🔻30 or 3.28%)
Halton: 620 (🔻13 or 2.05%)
3/8
25.08.2025 14:30 — 👍 0 🔁 0 💬 1 📌 0

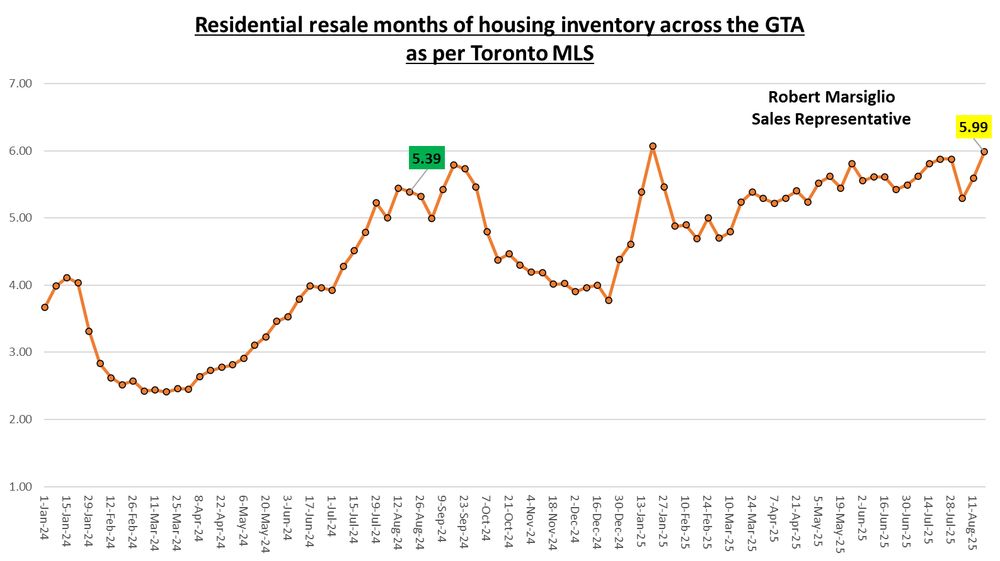
In the last three weeks, MOI across the GTA has jumped to a new YTD high (for my weekly readings).
Expect a drop next week when we get the month end expiries roll through.
2/8
25.08.2025 14:30 — 👍 0 🔁 0 💬 1 📌 0

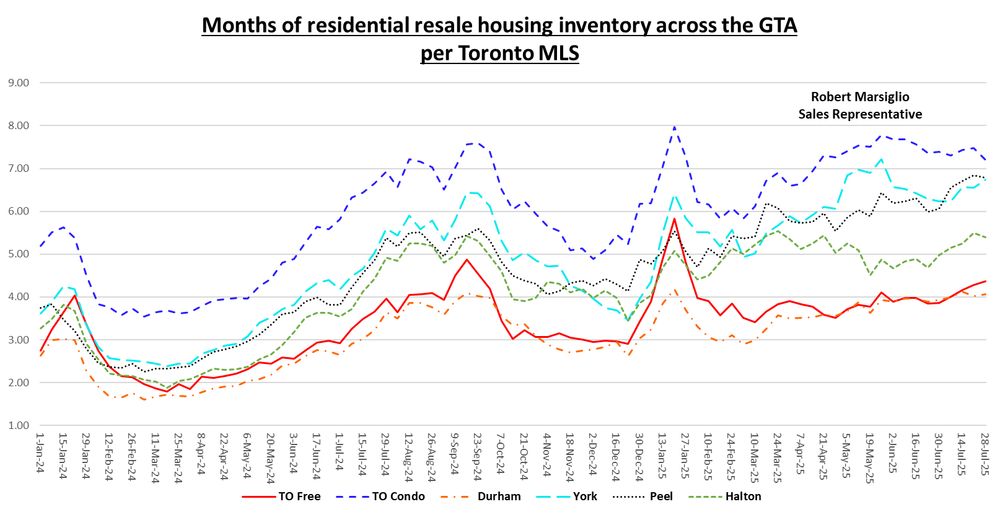
Monday months of #TORE resale housing inventory 🧵
(change from last week)
TO Free: 5.04 (⬆️0.30 or 6.32%)
TO Condo: 7.52 (⬆️0.14 or 1.88%)
Durham: 4.50 (🔻0.01 or 0.08%)
York: 6.44 (⬆️0.02 or 0.24%)
Peel: 6.79 (⬆️0.08 or 1.27%)
Halton: 5.22 (🔻0.07 or 1.26%)
1/8
25.08.2025 14:30 — 👍 0 🔁 0 💬 1 📌 0
Quick Oshawa update:
Showed a bungalow this past weekend. Listed low ($599k) with an offer night strategy.
Most recent comps on the street sold for mid/high $800s.
This one needed some work, but I had it pegged as low to mid $700s.
Sold firm before offer night for $650k.
19.08.2025 18:43 — 👍 1 🔁 0 💬 0 📌 0
IN SUMMARY:
1. August 2025 has seen rate of sales slow drastically compared to August 2024.
2. Active inventory is holding steady.
3. MOI has shot up to the second highest levels we have seen all year.
7/7
18.08.2025 21:34 — 👍 0 🔁 0 💬 0 📌 0

GTA wide, active listings stayed above the 30,000 mark for the 14th straight week.
Does it dip below next week?
6/7
18.08.2025 21:34 — 👍 0 🔁 0 💬 1 📌 0

Active listings fell across the board, but more drastically in the 416.
TO Free: 3,810 (🔻117 or 2.98%)
TO Condo: 7,495 (🔻146 or 1.91%)
Durham: 3,141 (🔻3 or 0.10%)
York: 6,144 (🔻66 or 1.06%)
Peel: 6,142 (🔻4 or 0.07%)
Halton: 3,344 (🔻29 or 0.86%)
5/7
18.08.2025 21:34 — 👍 0 🔁 0 💬 1 📌 0

August 2024 was all about the rate of sales holding steady.
August 2025 has given us the biggest two week drop of the year.
Does this indicate that we are in for a slower fall market?
4/7
18.08.2025 21:34 — 👍 0 🔁 0 💬 1 📌 0

The big driver of the MOI jump is a falling rate of sales.
TO Free: 803 (🔻105 or 11.56%)
TO Condo: 1,016 (🔻63 or 5.84%)
Durham: 697 (🔻70 or 9.13%)
York: 957 (🔻33 or 3.33%)
Peel: 916 (🔻100 or 9.84%)
Halton: 633 (🔻51 or 7.46%)
3/7
18.08.2025 21:34 — 👍 0 🔁 0 💬 1 📌 0
The regional jumps mean that the GTA is sitting at the highest MOI we have seen since late January.
Durham Region is the only market that set a YTD high this week. In fact, it is the highest weekly reading I have recorded in the 3+ years I've been tracking.
2/7
18.08.2025 21:34 — 👍 0 🔁 0 💬 1 📌 0

Monday months of #TORE resale housing inventory. 🧵
(change from last week)
TO Free: 4.74 (⬆️0.42 or 9.71%)
TO Condo: 7.38 (⬆️0.30 or 4.17%)
Durham: 4.51 (⬆️0.41 or 9.94%)
York: 6.42 (⬆️0.15 or 2.35%)
Peel: 6.71 (⬆️0.66 or 10.84%)
Halton: 5.28 (⬆️0.35 or 7.13%)
1/7
18.08.2025 21:34 — 👍 0 🔁 0 💬 1 📌 0
Since the start of August, there have been 890 detached home sales reported in the GTA.
1 in 20 sold for 90% of the list price or lower.
Buyers - don't be afraid to throw a Hail Mary.
13.08.2025 18:43 — 👍 0 🔁 0 💬 0 📌 0
In the past 2 months, I've experienced:
1. A seller reneging on multiple verbal agreements
2. A seller getting a haircut in the home during an inspection
3. A seller failing to vacate the home in time for closing
4. A seller taking the keys to the home with them when they moved
That's 1 deal
01.08.2025 15:55 — 👍 2 🔁 0 💬 0 📌 0

Is the tide starting to turn when it comes to GTA home sales?
July 2025 is shaping up to be the busiest July in terms of reported sales since 2021.
Freehold sales are projected to outpace 2017.
The doors are by no means being blow off, but have we hit the bottom for volume?
29.07.2025 18:40 — 👍 0 🔁 0 💬 0 📌 0
IN SUMMARY:
1. Summer sales slow down continues.
2. July inventory decline signals we've seen our spring/summer peak for active listings.
3. MOI stayed flat GTA-wide. Up in 3 markets, down in 3 markets.
7/7
28.07.2025 15:03 — 👍 1 🔁 0 💬 0 📌 0
Active listings are still outpacing 2024 by ~26.9%, but the July trend is different.
2024 saw a slow build while 2025 has seen a slow drop.
630 active listings have an expiry date between now and July 31, so expect a further drop in next week's reading.
6/7
28.07.2025 15:03 — 👍 0 🔁 0 💬 1 📌 0

Active listing inventory fell across all six market segments.
TO Free: 4,173 (🔻103 or 2.41%)
TO Condo: 8,018 (🔻125 or 1.54%)
Durham: 3,187 (🔻22 or 0.69%)
York: 6,504 (🔻15 or 0.23%)
Peel: 6,422 (🔻26 or 0.40%)
Halton: 3,488 (🔻73 or 2.05%)
5/7
28.07.2025 15:03 — 👍 0 🔁 0 💬 1 📌 0

While rate of sales has slowed through July, the drop off is not nearly as significant as what we witnessed in 2024.
2025 -🔻9.7%
2024 -🔻21.6%
4/7
28.07.2025 15:03 — 👍 0 🔁 0 💬 1 📌 0

One month ago, the TO Freehold market was the most active from a rate of sales perspective. Not anymore.
TO Free: 956 (🔻44 or 4.40%)
TO Condo: 1,113 (⬆️23 or 2.11%)
Durham: 783 (🔻14 or 1.76%)
York: 966 (🔻29 or 2.91%)
Peel: 946 (⬆️4 or 0.42%)
Halton: 647 (🔻1 or 0.15%)
3/7
28.07.2025 15:03 — 👍 0 🔁 0 💬 1 📌 0

Three markets saw MOI up, three markets saw MOI down.
It all resulted in a big nothing burger week-over-week.
2/7
28.07.2025 15:03 — 👍 0 🔁 0 💬 1 📌 0
Monday months of #TORE resale housing inventory 🧵
(change from last week)
TO Free: 4.37 (⬆️0.09 or 2.08%)
TO Condo: 7.20 (🔻0.27 or 3.57%)
Durham: 4.07 (⬆️0.04 or 1.09%)
York: 6.73 (⬆️0.18 or 2.77%)
Peel: 6.79 (🔻0.06 or 0.82%)
Halton: 5.39 (🔻0.10 or 1.90%)
1/7
28.07.2025 15:03 — 👍 0 🔁 0 💬 1 📌 0

Benchmark home price across the GTA continues to grind down as sales volume slows.
I think this slow grind continues until we see sales volume pick up. Once it does pick up, I think we will get a better idea of where the price floor sits.
3/3
23.07.2025 18:43 — 👍 0 🔁 0 💬 0 📌 0

Here is the same chart for the 905.
Similar trends with Q2 SNLR peaking in 2016 and setting 10-year lows in 2025.
2/3
23.07.2025 18:43 — 👍 2 🔁 0 💬 1 📌 0
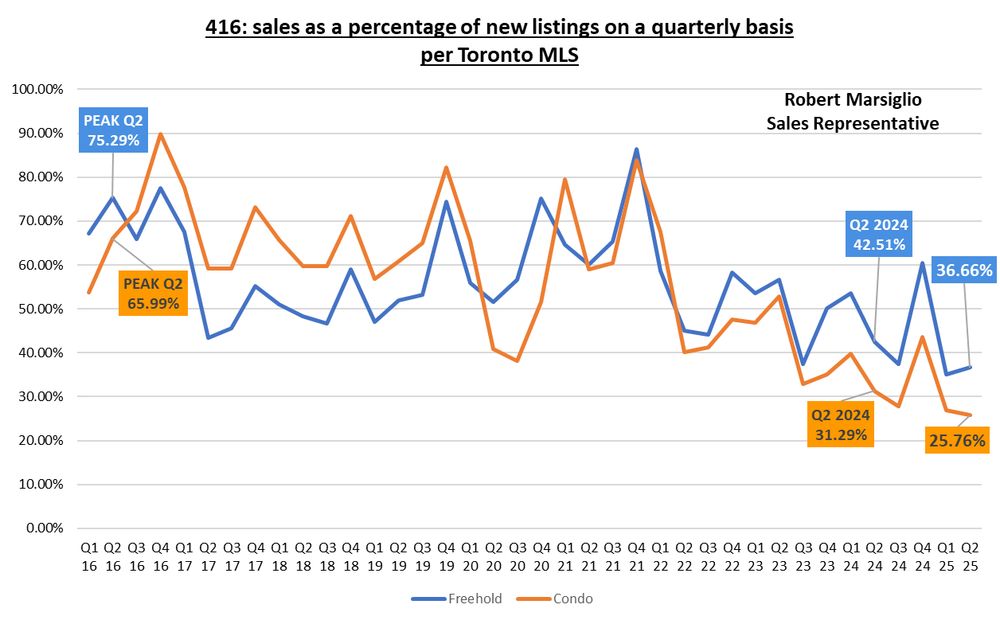
Q2 2025 saw the lowest sales as a percentage of new listings across the GTA in the last 10 years.
By this metric, 416 and 905 markets have been in buyer's market territory for the last 6+ months.
416 has been in a balanced to buyers market for the past 3 years.
1/3
23.07.2025 18:43 — 👍 0 🔁 0 💬 1 📌 0
