A St. Elsewhere theme with snowglobe snow falling.
15.10.2025 02:43 — 👍 0 🔁 0 💬 0 📌 0
Slap Shot is a different thing, yeah.
Miracle would also fit here.
14.10.2025 11:32 — 👍 1 🔁 0 💬 1 📌 0
Heavier setup but might fit: [Escape to] Victory---Stallone/Michael Caine/Pelé in a WWII POW camp playing soccer to escape.
13.10.2025 23:40 — 👍 0 🔁 0 💬 1 📌 0
Might be an actual honest-to-goodness marching French horn (which is not the same as a mellophone)?
11.10.2025 03:14 — 👍 3 🔁 0 💬 1 📌 0
Raised to believe he's arguably the Greatest American, tbh.
I mean, Abe Lincoln never skipped a World Series game for Yom Kippur now, did he.
09.10.2025 03:31 — 👍 32 🔁 2 💬 1 📌 0
First vehicle for me was a '91 Previa that was as old as me and had belonged to my grandfather, who had a backup beeper installed after-market. Took it to college, became designated people-hauler for my friend group, and graduated just in time for it to be my sister's first vehicle.
20.09.2025 00:23 — 👍 2 🔁 0 💬 0 📌 0
Serious answer: That I believe would fall under academic Rice. Academic Rice is basically the same as it was then; this is the third difference version of the athletic owl since I matriculated. Also that's a really fun project.
19.09.2025 00:18 — 👍 2 🔁 0 💬 1 📌 0
Please tell me they're already negotiating the Rolaids deal.
24.08.2025 02:55 — 👍 1 🔁 0 💬 0 📌 0

Chicken and Broccoli Recipe | Gimme Some Oven
This classic chicken and broccoli recipe is full of fresh and delicious flavor, and it's ready to go in a snap!
Really enjoy this one: www.gimmesomeoven.com/chicken-broc... usually with thighs instead of breasts. Works just as well with super firm tofu instead of chicken; also works reasonably well with green beans instead of broccoli.
22.08.2025 16:44 — 👍 0 🔁 0 💬 0 📌 0
Mildly surprised that the low point isn't Rocky V.
15.07.2025 03:51 — 👍 0 🔁 0 💬 1 📌 0

Traditional July 4 Programming Note
TCM’s annual airing of 1776 will be a late one this evening
04.07.2025 13:42 — 👍 25 🔁 5 💬 2 📌 8
And 3) the Republicans held the House from January 2011 on.
03.07.2025 15:19 — 👍 4 🔁 1 💬 3 📌 0
...Second-threepeat Jordan? (Space Jam notwithstanding)
03.07.2025 02:47 — 👍 1 🔁 0 💬 0 📌 0
For my money the Saint Louis Zoo is the best zoo in the country. Also Ted Drewes. Science Center is good. And if you enjoy theater and don't mind outdoors see if the Muny has anything of interest on that week--one of the best theater companies in the country.
05.06.2025 03:16 — 👍 5 🔁 0 💬 1 📌 0
The Oven of Akhnai - Wikipedia
The Oven of Akhnai! en.m.wikipedia.org/wiki/The_Ove...
Which has many many layers of interpretation beyond the story itself, as well.
23.05.2025 23:56 — 👍 3 🔁 0 💬 0 📌 0
Highly recommend the Spokane Indians, who worked with the Spokane tribal leaders to create a uniform in the variant of Salish spoken by the Spokane
21.05.2025 01:42 — 👍 3 🔁 0 💬 1 📌 0
It me, the other person equipped to appreciate that.
20.05.2025 20:17 — 👍 2 🔁 0 💬 0 📌 0
Berkman and Pierzynski, though.
(But you're probably right and this team would probably infuriate me more if I wasn't primarily radio rn.)
27.04.2025 23:04 — 👍 1 🔁 0 💬 0 📌 0
Even the 2013 team?
27.04.2025 22:48 — 👍 0 🔁 0 💬 1 📌 0
To be fair, the most impactful bad calls literally evened out--one strike called a ball, one ball called a strike, in the same plate appearance. One could argue that this was simply cleaning up an earlier mistake. (One could also reasonably argue that neither mistake should have been made.)
30.03.2025 18:31 — 👍 1 🔁 0 💬 0 📌 0
My vague recollection (having not watched The Search in a few years) was that it was less that it had to be Romulan, more that because of some treaty (Khitomer, maybe?) the Federation wasn't allowed to have cloaking devices so the way to get around *that* was to have a Romulan supervise it?
18.03.2025 04:19 — 👍 2 🔁 0 💬 1 📌 0
Another possibility is repeated high-resolution spectroscopy of HL Tau to observe how the 6.4 keV iron fluorescence changes over time with the 6.7 keV iron line. If the 6.4 keV line didn't change as the 6.7 keV line does, that could indicate changing geometry rather than changing emission. 13/14
05.03.2025 16:58 — 👍 0 🔁 0 💬 1 📌 0
BUT to say anything for certain about the nature of the variability would require more data, of course. The observing window for HL Tau in 2020 was six observations over 40 days--a longer baseline (comparable to the ~81 days from K2 Campaign 13) would be beneficial. 12/14
05.03.2025 16:58 — 👍 0 🔁 0 💬 1 📌 0
A 21 day period would be much larger than the rotation period of the star. BUT it would match the period of an orbiting body in the disk at a circular orbit of ~0.15 AU(!!!). We discuss possibilities for what that could be (accretion funnels, induced hot spots on the star, disk currents). 11/14
05.03.2025 16:58 — 👍 0 🔁 0 💬 1 📌 0
So, what to make of the variability? The simplest answer is that it's random--we might be seeing parts of "slow-rise, flat-top" flares. But that's not the most interesting possibility, so we decided to consider possible explanations for if it *is* periodic at 21 days. 10/14
05.03.2025 16:58 — 👍 0 🔁 0 💬 1 📌 0

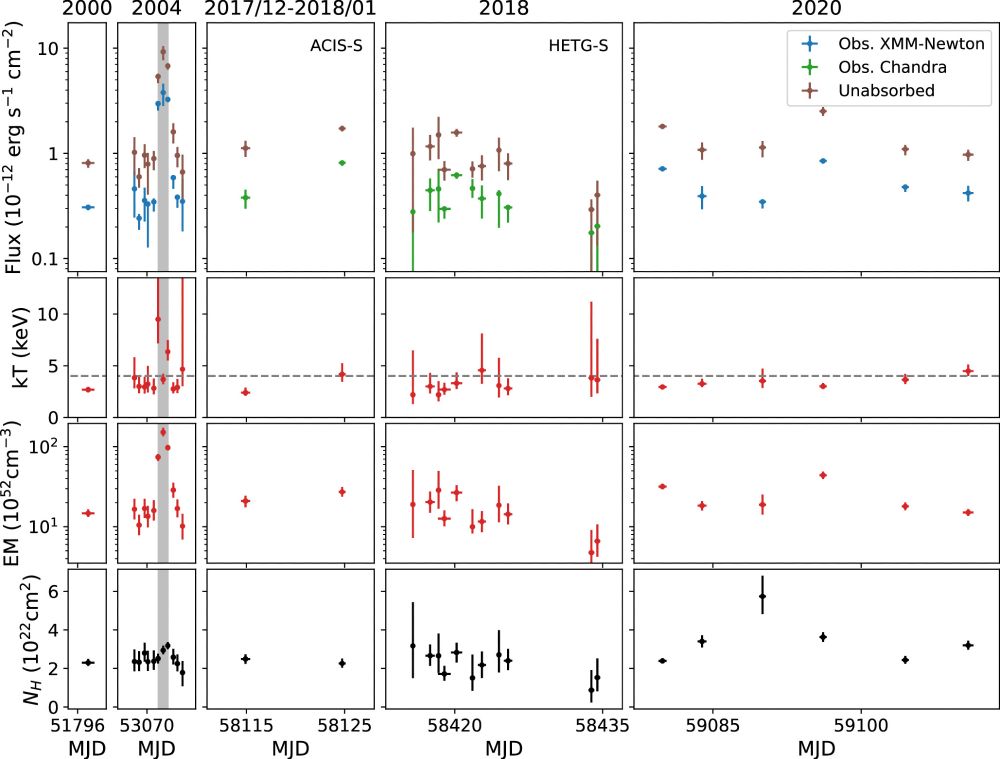
Figure 9 from Silverberg et al. (2025). Comparison of model fits to HL Tau observations from 2000 to 2020. All models use one collisionally-excited plasma component with variable temperature and a fixed abundance for Fe (and elements with Fe-like first ionization potential) set at the best-fit value from a joint fit to the faint XMM-Newton observations from 2020 and a variable absorption component. Top row: flux (in units of pico-ergs per second per square centimeter) is shown as both absorbed (as observed; blue for XMM-Newton, green for Chandra) and unabsorbed (corrected for absorption; brown). Second row: the plasma temperature for the single plasma component in keV (red) in comparison to 4 keV (dashed gray line). Third row: the emission measure (in units of 10^52 per cubic centimeter) for the single plasma component (red). Bottom row: the hydrogen column density NH (in units of 10^22 square centimeters) of the absorbing material (black). Observing windows are labeled above each column. The observations during the flare identified by G. Giardino et al. (2006) in 2004 are highlighted in gray. The data show that HL Tau is variable, that the by-eye period in 2020 does not necessarily extend to earlier epochs (but might be there?), that the variation in 2020 is due to changing emission rather than changing absorption, and that this pattern does not necessarily hold at earlier epochs.
We were able to reprocess and analyze archival Chandra & XMM-Newton observations of HL Tau from 2000, 2004, 2017, and 2018, and look at how it changes (or doesn't) over time. The temperatures stay consistent around 4 keV. The bright 2020 observations are not as bright as a 2004 flare. 9/14
05.03.2025 16:58 — 👍 0 🔁 0 💬 1 📌 0

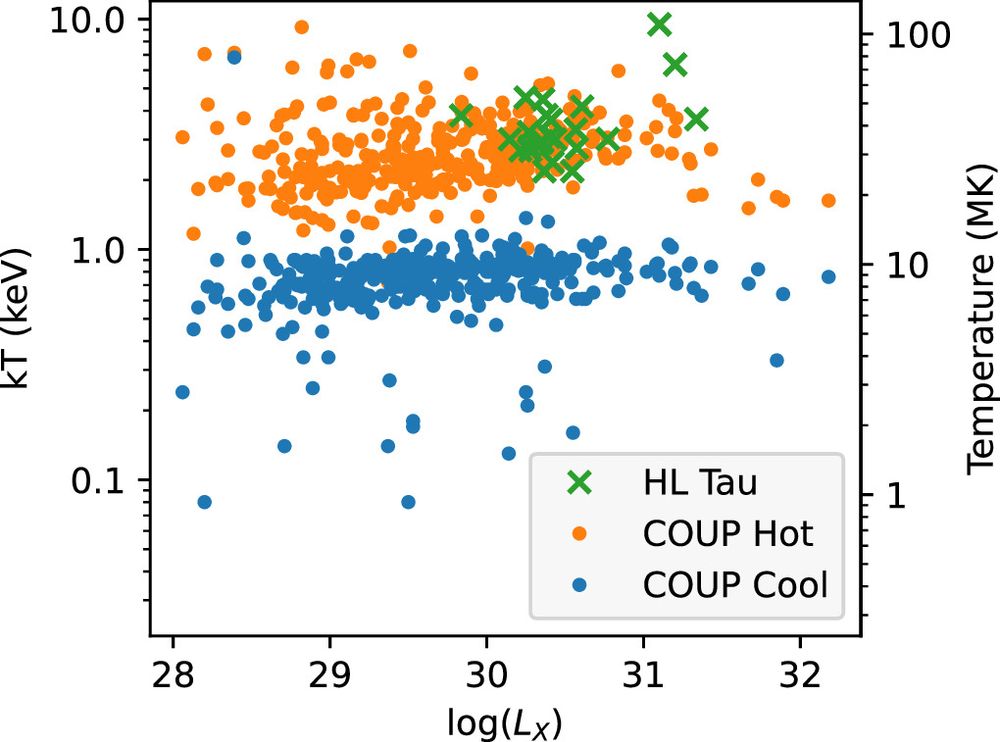
Figure 8 from Silverberg et al. (2025). Temperature vs. unabsorbed X-ray luminosity for single-temperature fits to HL Tau (green crosses), in comparison to temperature and unabsorbed luminosities from two-temperature fits (blue and orange circles) to the COUP pre-main-sequence stars (T. Preibisch et al. 2005). The plot shows temperature (measured in keV) in log space on the y axis, as a function of log(X-ray luminosity) on the x axis. The plot depicts blue, orange, and green scatter plots. Blue points represent the temperatures and luminosities associated with cool plasma from COUP, while orange points represent temperatures and luminosities associated with hot plasma. The blue scatter points are flat in temperature as a function of log(luminosity), while the orange points increase linearly as a function of log(luminosity). HL Tau is plotted as green "x" shapes, which overlap with the high-luminosity end of the COUP data. The right y axis shows temperature in millions of Kelvin.
So, what all does this tell us? Our best fit models and the consistent presence of 6.7 keV emission indicate that the spectrum of HL Tau is hot (consistently ~4 keV), on the hot end and bright end of YSOs compared to the COUP observations, but generally consistent with being a Class I YSO. 8/14
05.03.2025 16:58 — 👍 0 🔁 0 💬 1 📌 0
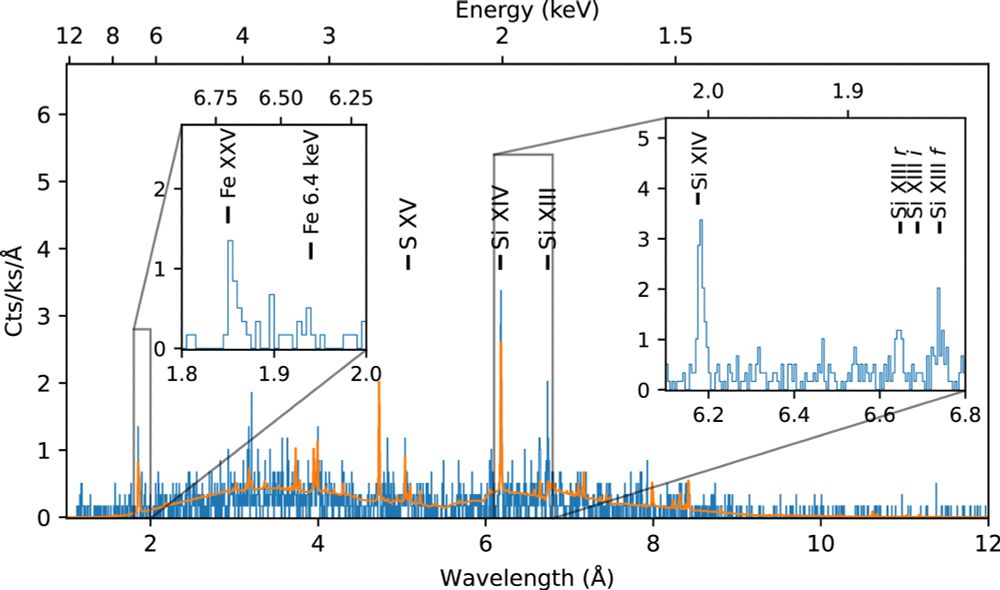
Iron fluorescence at 6.4 keV is emission from cold iron in the disk, stimulated by the 6.7 keV emission from the star. The detection here is marginal, but plausible. We also see the Si XIII r-i-f triplet, with f stronger than r, indicating the presence of both hot and cool plasma. 7/14
05.03.2025 16:58 — 👍 0 🔁 0 💬 1 📌 0

Figure 7. Combined grating data from all 11 Chandra/ACIS/HETG observations of HL Tau, with spectral lines of interest labeled. The best-fit model fit jointly to the individual zeroth-order and combined grating spectra is shown in orange. Left inset: a zoom-in on the region around the Fe xxv feature at 1.85 Å (6.7 keV) shows a clear detection of the Fe xxv line and a marginal detection of the 6.4 keV neutral Fe fluorescence line in ∼300 ks. Right inset: a zoom-in on the 6–7 Å region shows a strong detection of the f line of the Si xiii He-like triplet and a fainter but still present detection of the r line. Inset units are same as in the larger figure. The plot itself is of counts per kilosecond per angstrom as a function of wavelength in angstroms (on the lower x axis) and energy in keV (on the upper x axis). The observed data are blue, while the best fit model is in orange. A left inset shows a strong peak in Fe XXV emission at 1.85 angstroms, and marginal emission at 1.94 angstroms. The right inset shows strong Si XIV emission, and clear detections of the Si XIII r and f lines. The f line is stronger than the r line.
We also got a high-resolution spectrum using the High-Energy Transmission Grating on Chandra! These data show clear emission lines that help constrain the temperature and density of the plasma. We also see indications of cooler plasma hidden by the absorption, and a hint at iron fluorescence! 6/14
05.03.2025 16:58 — 👍 0 🔁 0 💬 1 📌 0
The official account of the National Baseball Hall of Fame and Museum. It's always baseball season here.
The Carpentries: Software Carpentry, Data Carpentry and Library Carpentry. An open global community teaching the skills and perspectives to turn data into knowledge
The nonprofit organization behind the Python programming language. For help with Python code: http://python.org/about/help/
On Mastodon: @ThePSF@fosstodon.org
New Yorker staff writer and Houston Rockets fan.
Rabbi at Central Reform Congregation in STL; co-founder of http://campindigopoint.org 🏳️⚧️🏳️🌈; activist in the fight to #ProtectTransKids and their families from our government (he/him) 🖖
abolitionist in love with cinema // https://nonmodernist.com // https://herhollywoodstory.com
magazine editor, Texas Highways
I commission and edit the Open Road essay series: https://texashighways.com/topic/open-road/
I like spicy food. Cowboys, Rangers, Wazzu, Video Games, Theme Parks
Publisher of The Joe Sheehan Baseball Newsletter since 2010.
Find me here:
http://www.joesheehan.com
http://sheehannewsletter.slack.com
Subscribe (10% off):
https://www.paypal.com/cgi-bin/webscr?cmd=_s-xclick&hosted_button_id=FVWKMMDRHZ7ZS
Category 1 mind, Category 4 attitude. 🧪🔭🚀
Planetary scientist, Dad-in-training, space enthusiast, Professor based at the University of Leicester
https://linktr.ee/leigh.fletcher
https://orcid.org/0000-0001-5834-9588
Astro student interested in the atmospheres of young brown dwarfs & planetary mass objects | Can usually be found shouting obscenities at python. he/him
NASA Affiliated citizen science project. Sister to Planet Patrol. Account is shared by the Advanced Team.
We’re on the Zooniverse platform, looking at Eclipsing Binary star candidates! https://www.zooniverse.org/projects/vbkostov/eclipsing-binary-patrol
• just a lawyer who gives a shit
• clayjak.substack.com | ig: clayjak
Established in 1841 for the reporters who cover the U.S. Senate.
https://www.dailypress.senate.gov/
current twitter ex-pat. past congressional reporter. contributing editor @newrepublic.com. running a communications consulting business and raising a tiny baseball fan irl.
let’s work together! ⬇️
meredithshiner.com
9/11 First Responder, Former Rescue Squad Critical Care Medic, Drum Corps Alum, STL City SC Fan, St Louligan Tailgate Posse, Ole Miss Alum & Fan.
Certified, verified asshole and shit stirer virtuoso
For Holy Name Shall Always Be (FHNSAB)
About: https://www.storage-b.com/about
Website: https://www.amon-hen.com/
Drum and Bugle Corps: https://www.drum-corps.net/
| World Traveler | Bluecoats Alum | John Carroll University Alum | Physics | Computers |
Drum Corps AF is an irreverent podcast about drum corps and the marching arts. https://t.co/qnv0O4wun2
Marching Music’s Major League


