Which satellite provider kosmi?
28.02.2026 08:26 — 👍 1 🔁 0 💬 1 📌 0Which satellite provider kosmi?
28.02.2026 08:26 — 👍 1 🔁 0 💬 1 📌 0
Here's the full story on our website:
www.bas.ac.uk/news/acciden...
And here's the paper in Communications Earth & Environment:
www.nature.com/articles/s43...

Our latest paper is now out, and it's not good news www.bbc.co.uk/news/article...
25.02.2026 10:14 — 👍 4 🔁 4 💬 0 📌 0
Love this paper title:
A roadmap towards monitoring walruses from space
academic.oup.com/icesjms/arti...
From @bas.ac.uk / @ptfretwell.bsky.social / and others
Two can play this game of Canadian Palantir eh.
“We shall track on the beaches, we shall track on the landing grounds, we shall track you in the fields and in the streets, we shall track in the hills; we shall never surrender.”

Nice phytoplankton booms in Marguerite Bay Antarctica
09.02.2026 12:37 — 👍 4 🔁 0 💬 0 📌 0
What's going on with
the Penguin 🐧 chicks 🐥 ??
Click to enlarge ↕️↔️
📸🛰 #Sentinel2
Footage: @sentinelonline.bsky.social
@ptfretwell.bsky.social
Link.dataspace.copernicus.eu/r753

Great to visit BAS yesterday to chat penguins and meet more of the wildlife from space community (what a cool name for a research theme).
27.01.2026 21:15 — 👍 3 🔁 1 💬 0 📌 0
Line graph time series of 2026's daily Arctic sea ice extent compared to decadal averages from the 1980s to the 2010s. The decadal averages are shown with different colored lines with purple for the 1980s, blue for the 1990s, green for the 2000s, and white for the 2010s. Thin white lines are also shown for each year from 2000 to 2025. 2026 is shown with a thick gold line. There is a long-term decreasing trend in ice extent for every day of the year shown on this graph between January and March by looking at the decadal average line positions.
Friday ice update - #Arctic sea ice extent is currently the *lowest* on record (JAXA data)...
• about 500,000 km² below the 2010s mean
• about 1,090,000 km² below the 2000s mean
• about 1,640,000 km² below the 1990s mean
• about 2,110,000 km² below the 1980s mean
More: zacklabe.com/arctic-sea-i...
Maps of average summer sea ice extent 1978-2010 and whale catches from Antarctic Atlas
23.01.2026 09:44 — 👍 3 🔁 0 💬 0 📌 0
There are almost 300,000 data points in the IWC blue whale catch record, not one catch is recorded in the area of recent summer sea ice loss near the coast of West Antarctica. This shows that that Antarctic summer sea ice has not been as low as it is now for more than a century.
23.01.2026 09:42 — 👍 6 🔁 1 💬 1 📌 0
Our first paper from the 'EPIC' project- 'How will Emperor Penguins Respond to Changing Ice Conditions?'🐧❄️ - is now out. 🎉
My first first-author penguin paper🐧! w co-authors @changingice.bsky.social, Chris Stokes, Melanie Marochov, @ptfretwell.bsky.social, Stéphanie Jenouvrier
tinyurl.com/4635pdwh

For many years we have watched the Wilkins Ice shelf slowly break up. In 2009 it detached from Charcot Island to form Attenborough Strait. Yesterday, the last sliver joining it to Rothschild Island began to disintegrate. I'm waiting for tomorrow's image.
19.01.2026 18:08 — 👍 8 🔁 4 💬 0 📌 0
There's a lot of chat about the new subglacial map of Antarctica on the BBC that was generated using inverse modelling. Spot the difference:
16.01.2026 13:44 — 👍 5 🔁 0 💬 0 📌 0
The past 3yrs were 1.5C warmer than preindustrial & experts say we're underestimating the impacts:
“This is Titanic risk modelling, looking backwards from the... Titanic in April 1912 & predicting a smooth voyage. This fails the 1st principles of risk management” www.newscientist.com/article/2511...


Following on from our Penguin event 18/12/25 with Peter and Lisa Fretwell, we made a donation to the WWF Climate Fund, thanks to the attendees who wore penguin colours or costumes. If you would like to support this worthy cause, then please follow this link:-
support.wwf.org.uk/climate-reco...

The satellite tags from our recent emperor penguin fieldwork are still going strong. Some have traveled amazing distances!
07.01.2026 13:34 — 👍 10 🔁 2 💬 0 📌 0
We launched the second Ticket to Antarctica campaign, virtually taking 70,000 schoolchildren on an extraordinary journey from Canada to Antarctica, as they followed the flight of our Twin Otter aircraft and learned first-hand about polar science, aviation, and life at the bottom of the Earth.
29.12.2025 18:03 — 👍 11 🔁 1 💬 1 📌 1


A fantastic crowd enjoyed our penguin-themed event with Peter & Lisa Fretwell last Thursday. We all learnt a lot about these beloved birds and are now fully versed in how to do the various types of penguin walks!
Wishing you all a very Happy Christmas from Authors In Oundle.

image of 3D Digital Twin of Rothera Research Station showing BIM models and tracked vehicles including SDA ship
We’ve been developing a 3D Digital Twin of Rothera, incorporating detailed Building Information Models (BIM) of the Discovery Building and other station facilities. We’ve also integrated live tracking data for our ship, aircraft, and vehicles. In this image you can see our ship docked at the wharf.
18.12.2025 13:29 — 👍 7 🔁 1 💬 0 📌 0Nice to see our research on emperor penguins included in this high impact report.
17.12.2025 18:38 — 👍 1 🔁 0 💬 0 📌 0That one up on me Grant. The only Humboldts I have seen were in London Zoo.
15.12.2025 07:20 — 👍 1 🔁 0 💬 1 📌 0
Authors in Oundle have had a very successful year and I'd like to send sincere thanks to everyone involved in the business.
Have a wonderful festive break and I hope to see you at events in 2026!
Helen Shair, Founder and Director.
www.authorsinoundle.co.uk
Looking forward to next week www.authorsinoundle.co.uk/aio-event/pe...
12.12.2025 14:11 — 👍 1 🔁 1 💬 0 📌 0Emperor penguins have to gamble between being too far from the ice edge, or moving closer and the ice breaking up under them. This time it looks like they got it wrong.
05.12.2025 14:11 — 👍 8 🔁 3 💬 0 📌 0Looking at the sea ice it is very low near DDU. Research shows that if the sea ice edge is nearer, the chicks grow faster. This is great, as long as the sea ice doesn't give out completely in the next two weeks before the chicks fledge!
03.12.2025 21:26 — 👍 1 🔁 0 💬 0 📌 0
Satellite image of an Antarctic coastal ice shelf captured by Sentinel-2, showing rugged snow-covered terrain on the left and fragmented sea ice on the right. An inset highlights a smaller section of the ice. The overlaid graphic reads: “Who knew you could spot penguin colonies via satellite data? On Antarctica Day, Sentinel-2 imagery highlights how remote emperor penguin colonies can be detected from space.” Logos of the European Union, Copernicus, ESA, and Sentinel Online appear at the top.

Satellite image of an Antarctic coastal ice shelf captured by Sentinel-2, showing rugged snow-covered terrain on the left and fragmented sea ice on the right. An inset highlights a smaller section of the ice. The overlaid graphic reads: “Who knew you could spot penguin colonies via satellite data? On Antarctica Day, Sentinel-2 imagery highlights how remote emperor penguin colonies can be detected from space.” Logos of the European Union, Copernicus, ESA, and Sentinel Online appear at the top.
On Antarctica Day, #Sentinel-2 imagery highlights how remote emperor penguin colonies can be detected from space. They leave a visible signature on the ice, helping researchers track colonies in areas too difficult to access on the ground 🛰️
#SentinelOnline #ESA #EarthObservation
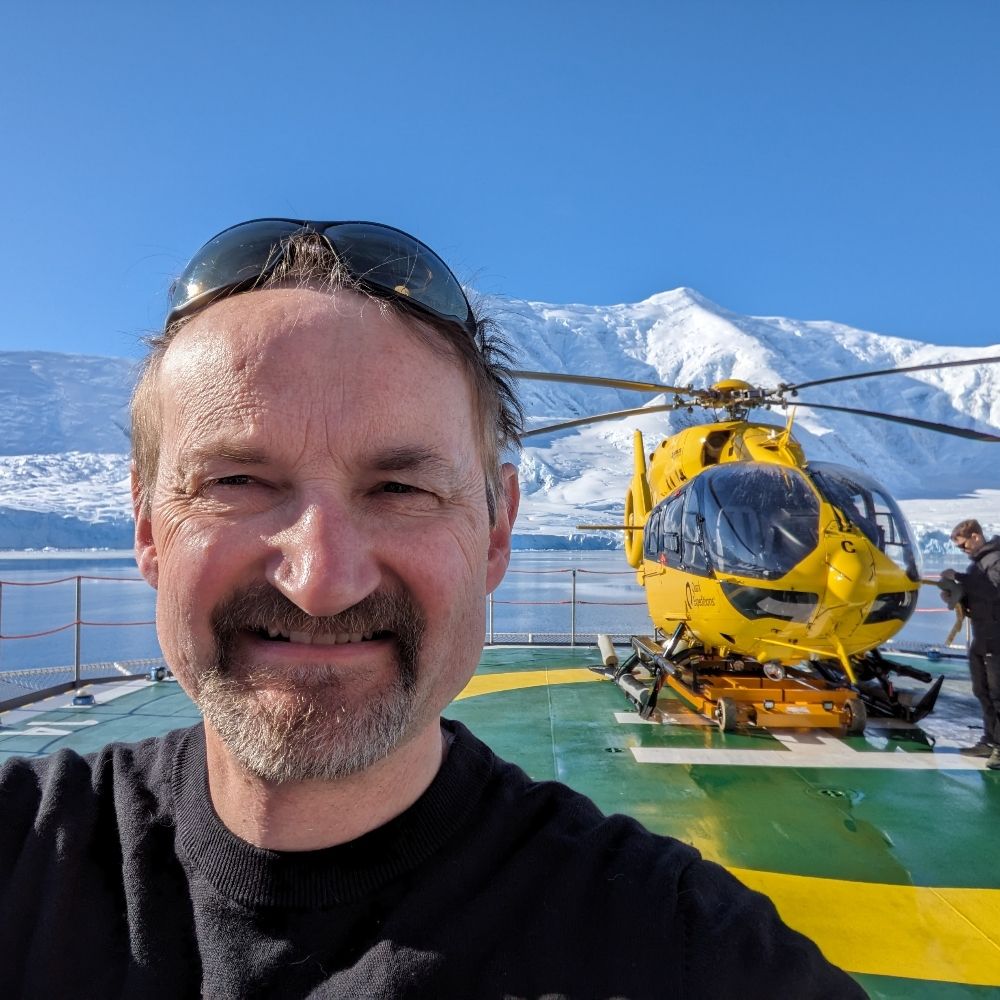
Flying off from Snow Hill Island
02.12.2025 21:39 — 👍 6 🔁 0 💬 0 📌 0
Map of the world showing countries symbolised as dark green if they are consultative parties to the Treaty, light green if they are non-consultative parties and white if they are not signatories.
Happy Antarctica Day! We’ve recently updated this map to show consultative and non-consultative signatories of the Antarctic Treaty, signed on this day in 1959. The Treaty designates Antarctica a continent for peace and science. December 1st raises awareness of this global agreement and its goals.
01.12.2025 17:01 — 👍 10 🔁 3 💬 0 📌 0
