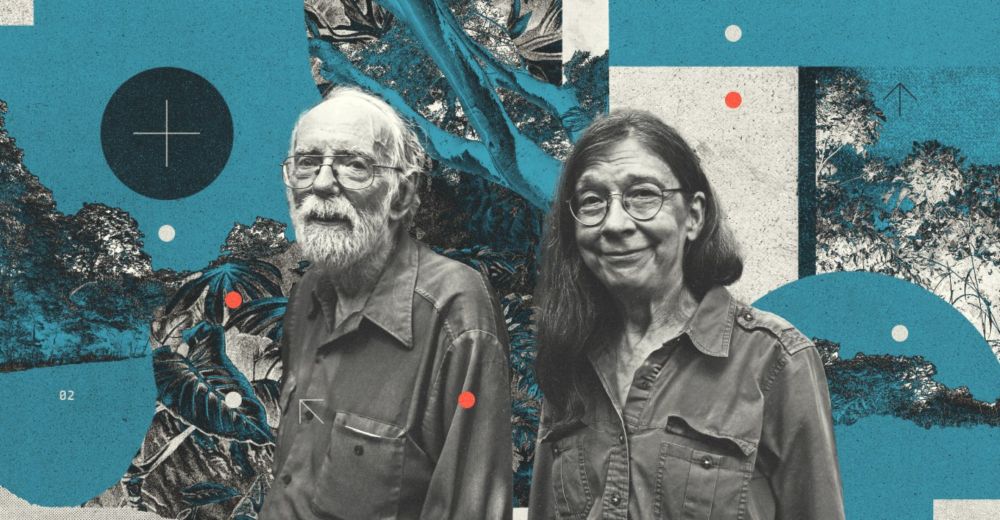
They turned cattle ranches into tropical forest — then climate change hit
“This is what gives me hope.”
The Verge received a Covering Climate Now award for this story about a quirky and determined community of scientists and locals bringing forests back to life in Costa Rica, despite new perils brought on by climate change.
Congrats to @justcalma.bsky.social on the well-deserved win!
18.09.2025 21:42 — 👍 156 🔁 35 💬 3 📌 1
Large mural by Bacon in Southend-on-Sea, UK, created for Southend City Jam, depicting a hyper-realistic hand covered in floral patterns holding a small bird on its fingers, surrounded by glowing yellow flowers against a dark blue background.
By Bacon in Southend-on-Sea, UK for Southend City Jam.
13.09.2025 09:33 — 👍 206 🔁 21 💬 2 📌 0
Heading into a glorious time for local fruit in #Toronto. Peaches, pears and plums all looking good.
www.mapto.ca/maps/the-fru...
#topoli #ediblecity #map #mapping #gis #dataviz
07.08.2025 14:24 — 👍 14 🔁 6 💬 0 📌 3
We declare the world as our canvas!
Blog Posts about inspiring street art: https://streetartutopia.com/
#streetartutopia #streetart #graffiti #publicart #mural
Mastodon: https://mastodon.online/@streetartutopia
design enthusiast | tableau visionary | iron viz finalist '23 | ✈️🐠🥁📊
Internet Shenanigans: https://linktr.ee/brrosenau
Enrich your stories with charts, maps, and tables – interactive, responsive, and on brand. Questions? Write us: datawrapper.de/contact-us
Freelance Data Designer
Programs Director @ Data Viz Society
She/they/whatever
programs@datavisualizationsociety-dot-org
BSs in Biology and Applied Physics, PhD in Organismic and Evolutionary Biology
writer/blogger, formerly journalist at WSJ, Dow Jones, Reuters, others. #economics #markets, #music, #philosophy, #books, #technology, #photos, etc. (ie hopelessly eclectic) Toronto. May not respond to DMs. Blog at: https://doncurren.blogspot.com
| Husband & dad^3
| head data & visualizations at @spiegel.de
| #Svelte and #D3
| biochemistry & computational biology PhD
| 🇸🇪🇩🇪🇪🇺
| https://spiegel.de/duv
| https://higsch.com
An Independent Data Visualisation Expert educating, inspiring, and celebrating data viz excellence, everywhere since 2010.
🇬🇧 in 🇮🇪
It’s all here http://visualisingdata.com/
Data analysis + visualization freelancer. Python and d3.js. Ph.D. in Astronomy and Astrophysics. www.fernandobecerra.com
Sr. Engineer for Data Journalism & Investigations @bloomberg.com
Previously:
@princetoncitp.bsky.social
@umwallacehouse.bsky.social 21-22 Fellow
@themarkup.org
@propublica.org
data/dev/design/map enthusiast
Data viz and development @revisual.co, interned @graphics.reuters.com
Bangalore, India
#dataviz #rstats #svelte #maps
🔗 https://aman.bh
Visual journalist and engineer at Axios. Builder of websites, data visualizations, and pixel cats. She/her.
Science. Data. Journalism. Maps. Teach: @ucscscicomm.bsky.social. Ex: BuzzFeed News, berkeleyjournalism.bsky.social, @newscientist.com, @nature.com, @science.org.
https://www.peteraldhous.com/
Data editor @NBCNews.com, @NBCguild.bsky.social strong, Oregonian born & raised, lives in NYC (Gowanus, Brooklyn). Formerly: New York Daily News, Denver Post, Medill.
Into dataviz, spreadsheets, accessibility, coding.
joemurph.76 on signal
joemurph.com
Data journalist at @data.ft.com. These days mainly thinking about elections data and how to use automation and AI in news. #ddj #dataviz
Chief Nerd @ Northwestern University Knight Lab • Project lead @ Census Reporter • Board Member @ City Bureau • Information Design • Digital Journalism • Civic Technology
Signal: JoeGermuska.53
Historian - Democracy and Its Discontents - Newsletter: Democracy Americana https://democracyamericana.com - Podcast: Is This Democracy https://podcasters.spotify.com/pod/show/is-this-democracy
Knight Chair in Journalism at Mizzou. Authored first textbook for News Product Management. Previously: Director of Product at McClatchy. Big @newsproduct.org fan.
The FT’s team of reporters, statisticians, illustrators, cartographers, designers, and developers work with colleagues across our newsrooms, using graphics and data to find, investigate and explain stories.
https://www.ft.com/visual-and-data-journalism
Designer, journalist, and professor.
Author of 'The Art of Insight' (2023) 'How Charts Lie' (2019), 'The Truthful Art' (2016), and 'The Functional Art' (2012). NEW PROJECT: https://openvisualizationacademy.org/