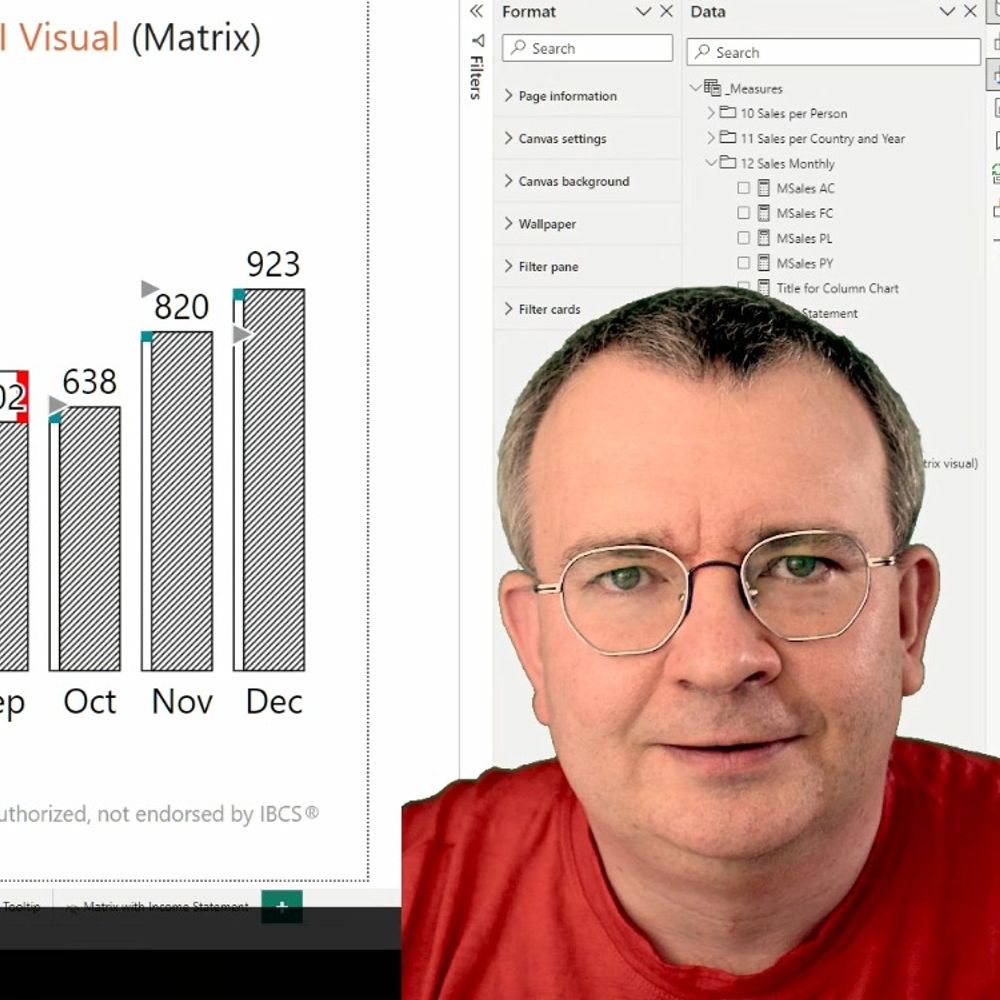
Beaver vs chainsaw
15.02.2024 14:40 — 👍 1 🔁 0 💬 0 📌 0

Today we have a rainbow in the morning. I wish everyone a good time.
12.02.2024 07:17 — 👍 1 🔁 0 💬 0 📌 0

The only way to use an overhead projector in class.
30.01.2024 16:13 — 👍 4 🔁 1 💬 0 📌 0
The world's premier forum for advances in visualization and visual analytics. https://ieeevis.org/year/2024/welcome
Program manager at the @Microsoft Fabric CAT team
Kasper On BI show on Youtube, Spotify and Itunes.
Tweets are my own.
Power BI Developer and Consultant
Data Explorer, Visualizer, Explainer
IBCS® Certified Analyst
Principal - Data Visualization • @Evolytics • @ConcordUSA • #TableauAmbassador • x3 #TableauVisionary • @KC_TUG • #WOW2022 • #DataPlusMusic • Go Forth And Viz
CEO of dataliteracy.com, author of nine books on data and AI including Avoiding Data Pitfalls and AI Literacy Fundamentals
Crafting data experiences at http://truth-and-beauty.net
Creating & writing about data vis for @datawrapper.de
Information design and data visualization studio focused on the environment, social development, and governance.
Montreal (since 2013).
English and French
Interactives, dashboards, reports, presentations, training
Posts by Francis Gagnon, founder
Data Journalist @ Zeit Online, before: Frankfurter Allgemeine Zeitung
Alumna 2020 @ City, London University
Data science with #rstats • Creative Data Visualisation • Power BI, SQL, Python • Serial learner of new things (currently: d3.js) • Charity Retail Data Scientist
filmicaesthetic.github.io
Designer, journalist, and professor.
Author of 'The Art of Insight' (2023) 'How Charts Lie' (2019), 'The Truthful Art' (2016), and 'The Functional Art' (2012). NEW PROJECT: https://openvisualizationacademy.org/
Independent instructor and best-selling author, data visualization and dashboard design.
Books, videos, articles, training workshops to level up your dataviz or dashboard design chops: www.practicalreporting.com
Playing with data, visualizing it for humans at flowingdata.com
ASA Fellow; #rstats developer of graphical methods for categorical and multivariate data; #datavis history of data visualization; #historicaldatavis; Milestones project
Web: www.datavis.ca
GitHub: github.com/friendly
Information Visualization 📊📉✍🏼 at University of Twente
Core project: The Languages of Visualization, with Clive Richards
Also at UT Climate Centre @utclimate.bsky.social
LinkedIn: https://linkedin.com/in/yuriengelhardt
Mastodon: https://vis.social/@yuri
I'm making music from the data🎶 #PowerBI addict, Microsoft Data Platform MVP, O'Reilly Instructor, Pluralsight Author, blogger, speaker, learner...Father of 2, Barca and Messi fan⚽
Bringing data to life, addicted to Power BI and Microsoft Fabric, then, now, and even more in the future. Fabric and Power BI sherpa by day and data addict by night ... Some of my data heroes are Marz / Cleveland / Tufte
Just doing the work and teaching you the clicks of #MicrosoftFabric including #PowerBI. Videos every Tuesday, Wednesday and Thursday and Saturday live streams!
📘 https://pbi.guide/book
🧑🏻🎓 https://pbi.guru/training
Microsoft Ⓜ️VP | Author | Speaker | Power BI & Excel Developer & Instructor
🌐 https://accessanalytic.com.au/