
"An Evolutionary Hypothesis on the Persistence of Non-Coding DNA in Complex Genomes: The Passive Selfish DNA Model"
doi.org/10.32942/X28...

@ecoevorxiv.bsky.social
A free pre-print and post-print service for ecology, evolution, and conservation. Run by @sortee.bsky.social. Server: https://ecoevorxiv.org Instructions & FAQ: https://sortee.github.io/ecoevorxiv/
"An Evolutionary Hypothesis on the Persistence of Non-Coding DNA in Complex Genomes: The Passive Selfish DNA Model"
doi.org/10.32942/X28...
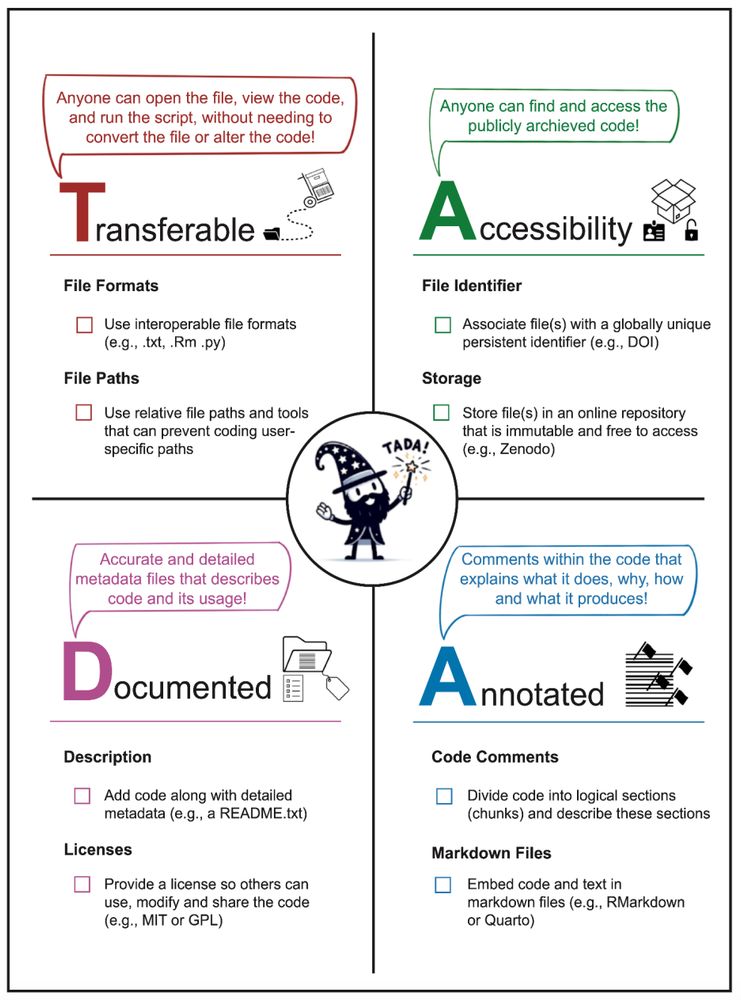
A checklist highlighting the key points of TADA: Transferable, Accessible, Documented, and Annotated code.
"TADA! Simple guidelines to improve code sharing"
doi.org/10.32942/X2D...
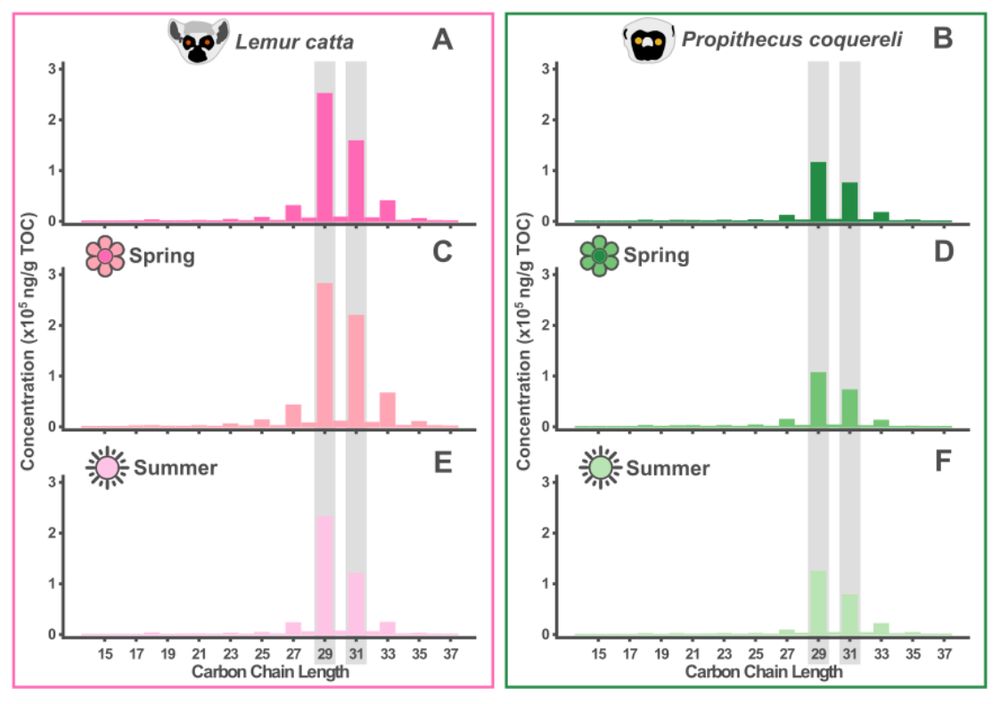
The concentration in ng/g TOC of n-alkanes extracted from 92 Lemur catta and 76 Propithecus coquereli faecal samples. Panels A, B) give the average concentration of all faecal samples; panels C, D) give the average for measurements on faecal samples collected during the Spring (May-June); panels E, F) give the average for measurements on faecal samples collected during the summer (August-September).
"Faecal n-alkanes differ significantly between two lemur species reflecting differences in consumed diet"
doi.org/10.32942/X2J...
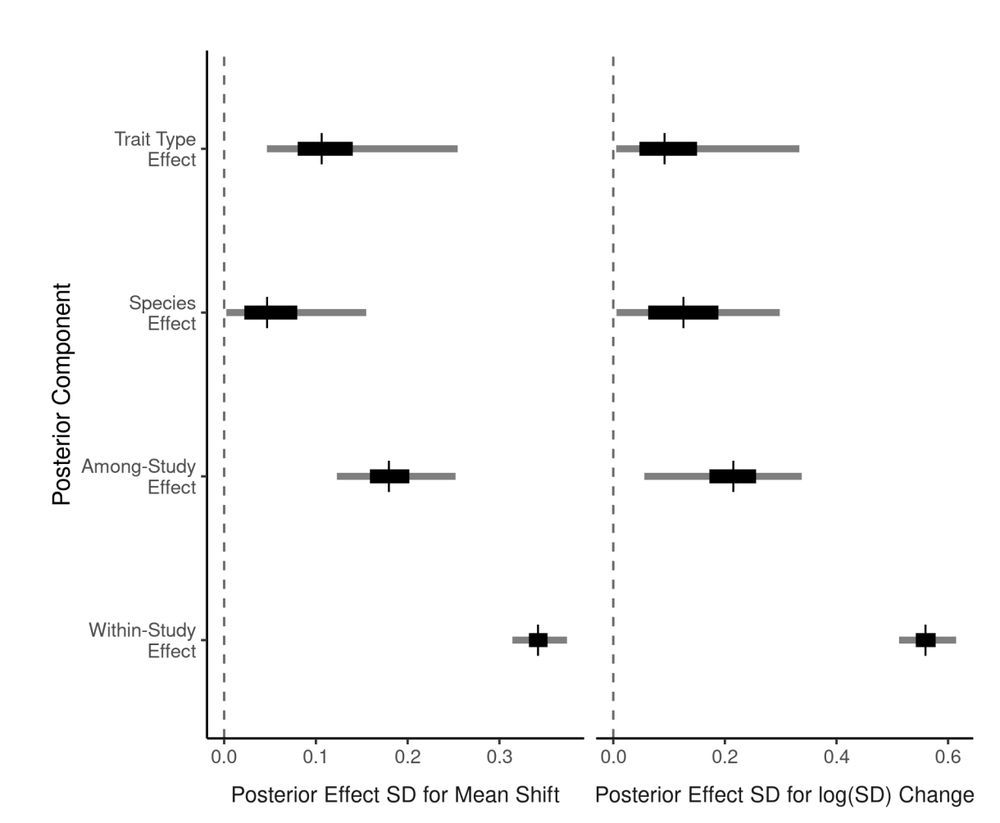
Variation among effect categories for mean (left) and variance (right) models. Values are the standard deviation of the category’s random effects for the core-edge change, with the median, 50%, and 95% credible intervals of the posterior distributions.
"Trait shifts during range expansions: A meta-analysis"
doi.org/10.32942/X24...
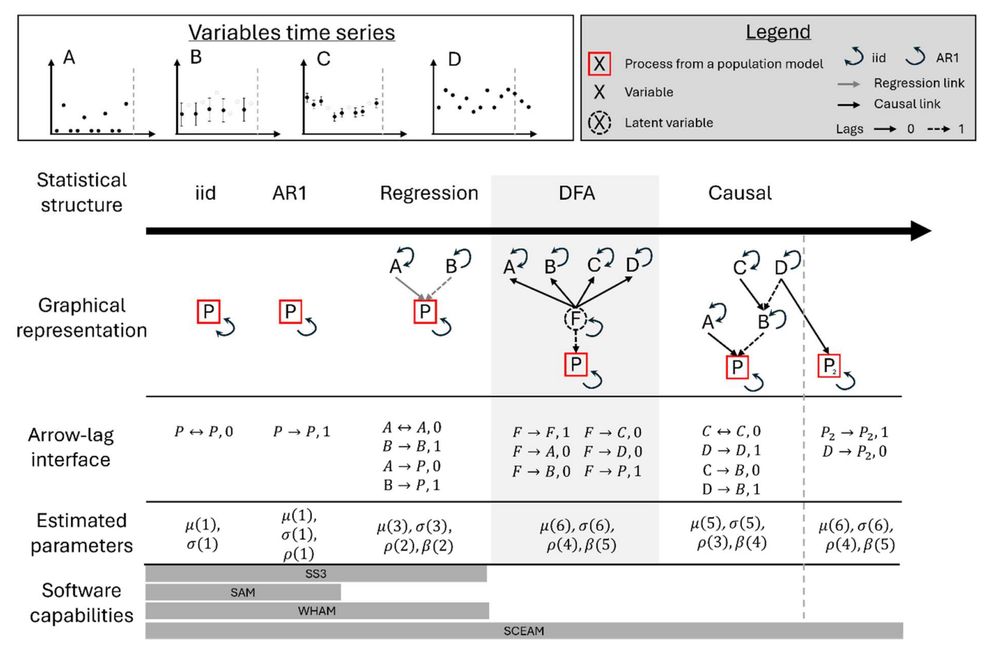
Overview of the various options (columns) to represent time-variation in a population process (P in the red square): random deviation around a mean (iid), autoregressive structure of order one (AR1), regression on environmental variables, Dynamic Factor Analysis (DFA) and causal. Each statistical structure has a graphical representation, the number of estimated parameters, and existing software able to estimate it: Stock Synthesis (SS3, Methot and Wetzel, 2013); SAM (Nielsen and Berg, 2014), WHAM (Stock and Miller, 2021), and Structural Causal Enhanced Assessment Model (SCEAM, this study).
"Causal models as a scientific framework for next-generation ecosystem and climate-linked stock assessments"
doi.org/10.32942/X2X...
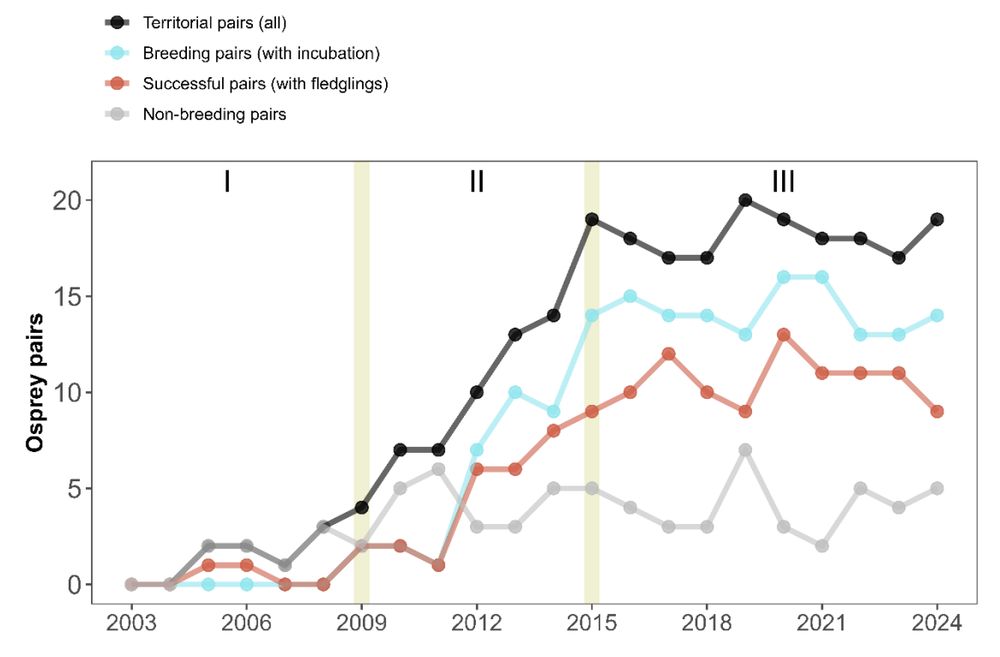
Evolution of the breeding population of Ospreys in southern Iberia from the beginning of the reintroduction project (2003) to the last records (2024).
"From reintroduction to extinction risk: past, present and future of the newly established population of Ospreys in southern Iberia"
doi.org/10.32942/X22...
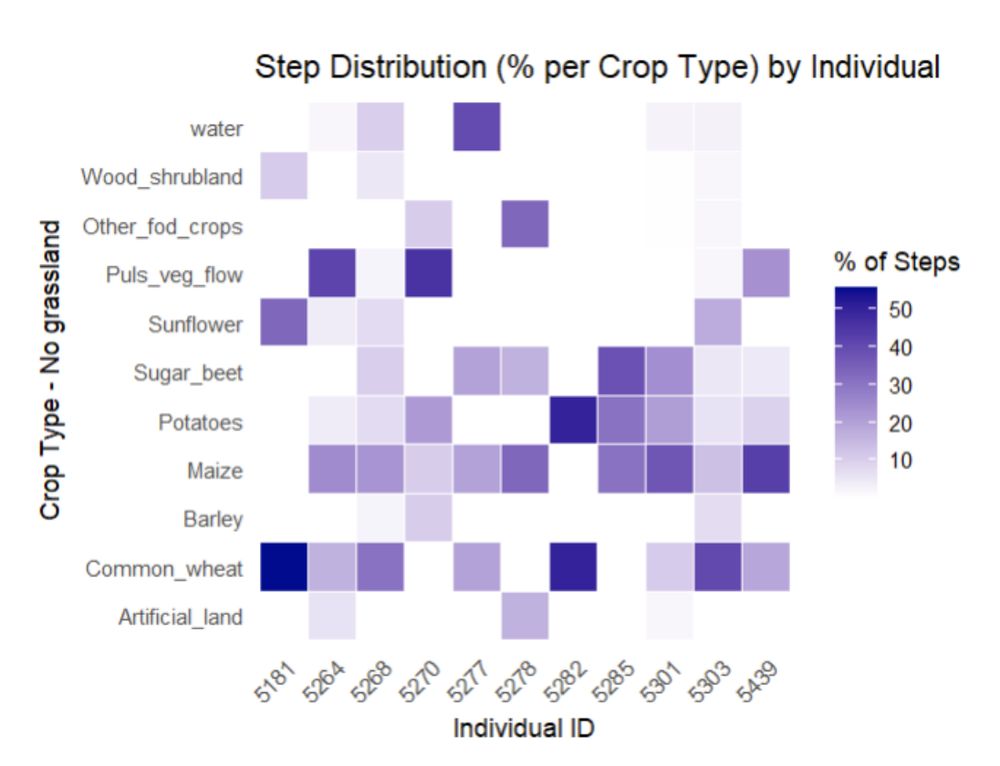
Within-individual variation in crop types.
"Tracking the hidden niches: Movement-based insights into northern lapwing intraspecific variation and conservation"
doi.org/10.32942/X2N...
"Exploring the Integration of Traditional Ecological Knowledge with Artificial Intelligence to Mitigate Human-Wildlife Conflict in Kerala, India"
doi.org/10.32942/X2S...
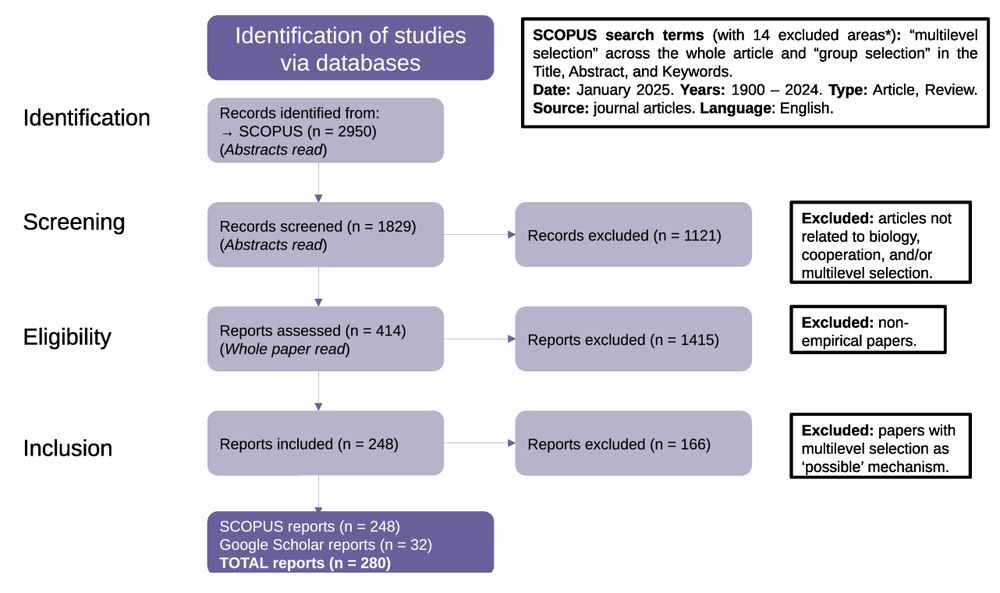
BIBLIO flow diagram for bibliometric review of empirical studies of multilevel selection.
"Abundant empirical evidence of multilevel selection revealed by a bibliometric review"
doi.org/10.32942/X25...
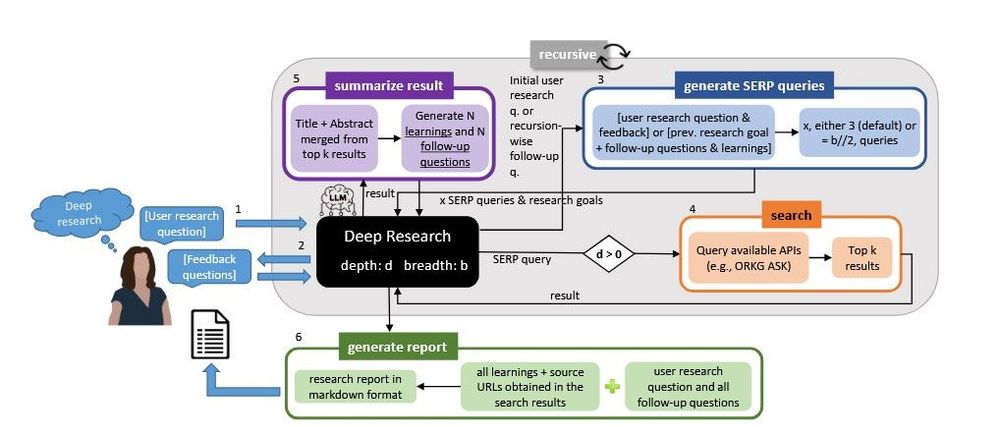
"DeepResearch_Eco: A Recursive AgenticWorkflow for Complex Scientific Question Answering in Ecology" doi.org/10.32942/X2M...
02.08.2025 23:56 — 👍 0 🔁 0 💬 0 📌 0
"Flawed analysis invalidates claim of a strong Yellowstone trophic cascade after wolf reintroduction: A comment on Ripple et al. (2025)" doi.org/10.32942/X2Q...
01.08.2025 23:55 — 👍 0 🔁 0 💬 0 📌 0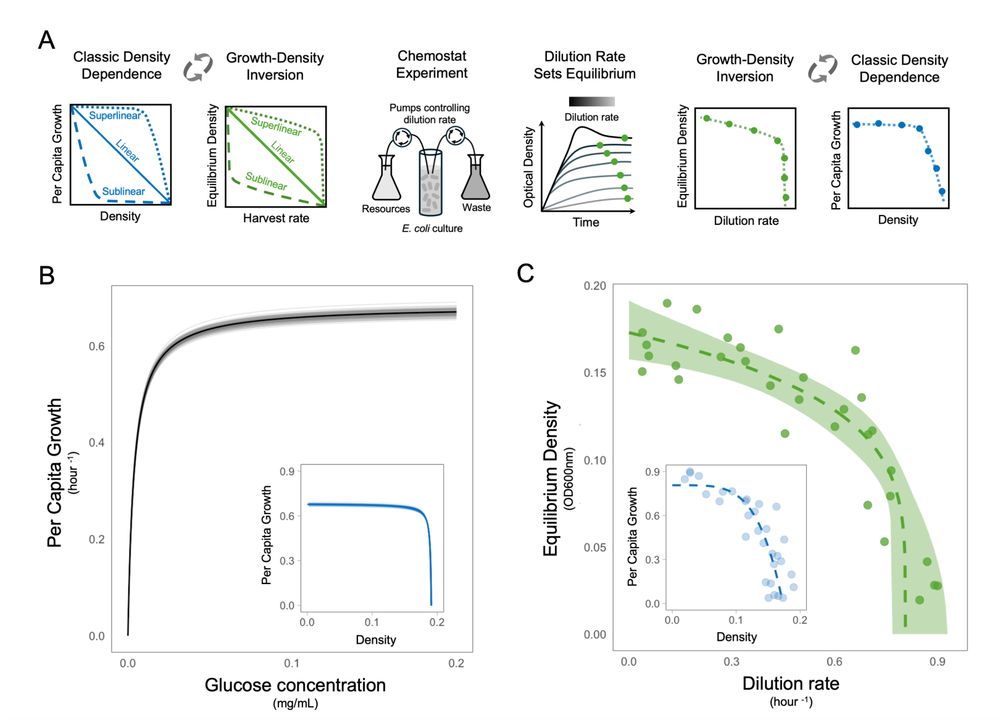
(A) Schematic of the experimental approach where the classic density dependence perspective (blue) is inverted (green) to overcome the challenges of manipulating densities. We varied the dilution rate of chemostats and quantified densities at equilibrium (when growth rate is equal to dilution rate) to study the shape of density dependence. (B) Parameterized Monod growth function with 100 posterior draws representing uncertainty. Inset shows the analytical prediction for the density dependence of this parameterized consumer–resource model. (C) Inverse θ-logistic model fitted to the experimental data with 95% credible intervals. Inset shows the same data and model with axes inverted to give the classic density dependence perspective.
"Density dependence revisited: strong evidence for superlinear population growth"
doi.org/10.32942/X2F...
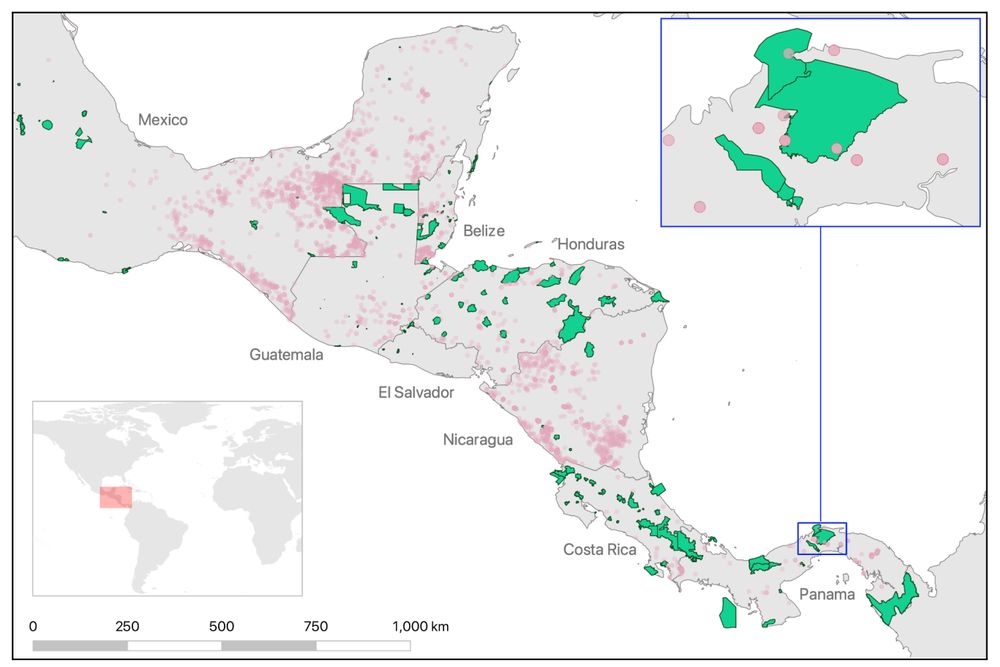
The spatial distribution of confirmed screwworm infestation in animals between January 1st, 2023, and July 26th, 2025 (red circles) according to data in the World Animal Health Information System database, and national parks with terrestrial components (green polygons) according to the World Database on Protected Areas in Central America and Southern Mexico. Other protected area types, such as RAMSAR sites, are not shown. The blue-framed inset shows reported cattle infestation cases in Chagres and Portobelo National Parks, Panama.
"Illegal cattle trade brings New World Screwworm to wildlife and continues to destroy protected areas in Mesoamerica"
doi.org/10.32942/X2K...
"Physical and Migration Metrics of White Storks (Ciconia ciconia) and the influence that landfills play in their variation" doi.org/10.32942/X20...
31.07.2025 23:54 — 👍 0 🔁 0 💬 0 📌 0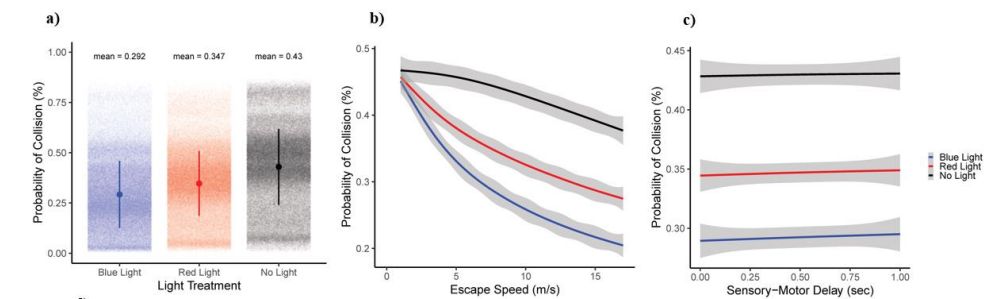
The relationship between each variable manipulated in our modeling and the probability of collision, where grey bars represent the standard deviation. a) The mean and standard deviation in the probability of collision for each of the three light scenarios, where each point represents the average probability of collision for over 500 runs of the model and with the same combination of manipulated variables. b) The relation between escape speed (m/s) and probability of collision for the three light scenarios. c) The relation between sensory-motor delay (sec) and probability of collision for the three light scenarios.
"A new model to quantify the probability of collision between birds and aircraft: applications for onboard lighting"
doi.org/10.32942/X2T...
"Genetic evidence for the rediscovery in the wild of the critically endangered Sahara killifish Apricaphanius saourensis (Cyprinodontiformes: Aphaniidae)" doi.org/10.32942/X2X...
31.07.2025 05:51 — 👍 0 🔁 0 💬 0 📌 0
"Big bills, small changes: with few exceptions, Jungle crows show minor variation in bill morphology across their distribution" doi.org/10.32942/X2N...
30.07.2025 23:50 — 👍 1 🔁 0 💬 0 📌 0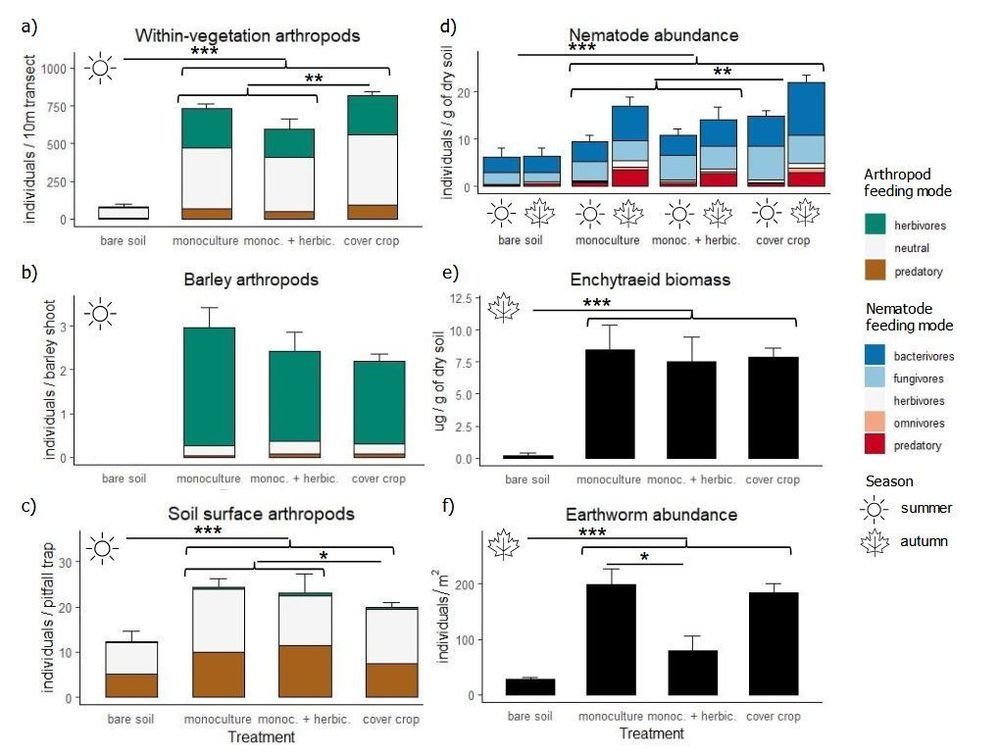
"Cover crops influence aboveground and belowground invertebrates in farmlands" doi.org/10.32942/X27...
30.07.2025 18:48 — 👍 0 🔁 0 💬 0 📌 0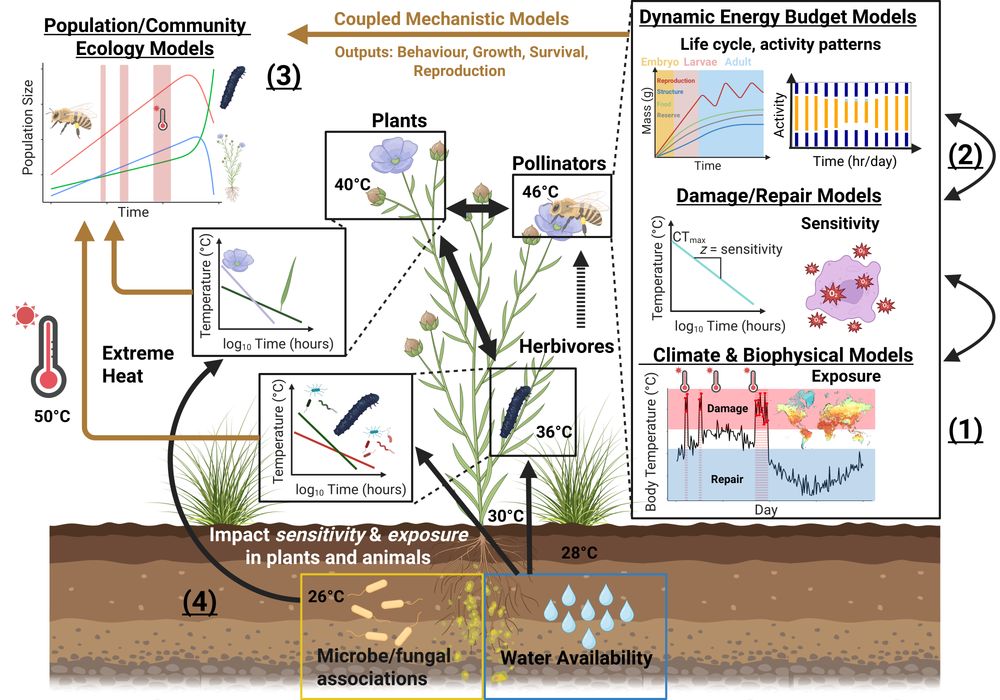
"A systems-modelling approach to predict biological responses to extreme heat" doi.org/10.32942/X2B...
30.07.2025 12:00 — 👍 1 🔁 2 💬 0 📌 0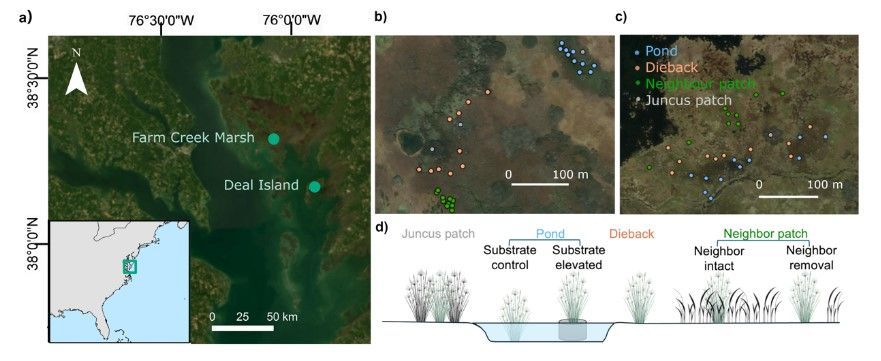
"Recruitment bottlenecks and reinforcing environmental degradation drive marsh collapse" doi.org/10.32942/X2C...
30.07.2025 09:46 — 👍 0 🔁 0 💬 0 📌 0
"Evolutionary Origins of the Blood Vascular System in Metazoans – A Microbial Perspective"
doi.org/10.32942/X2Z...
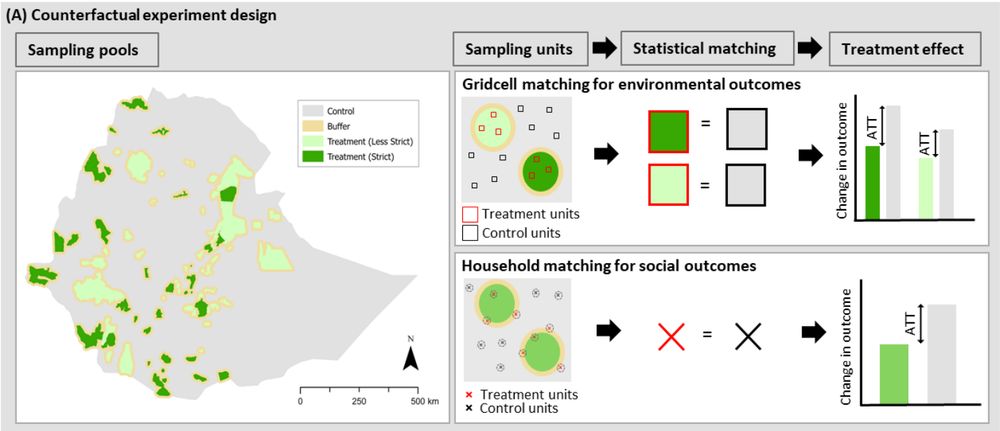
Effectiveness of Ethiopia’s protected area network. (A) Summarises the counterfactual experiment design.
"Trade-offs between nature and people reveal challenges in translating global conservation targets into national realities"
doi.org/10.32942/X23...
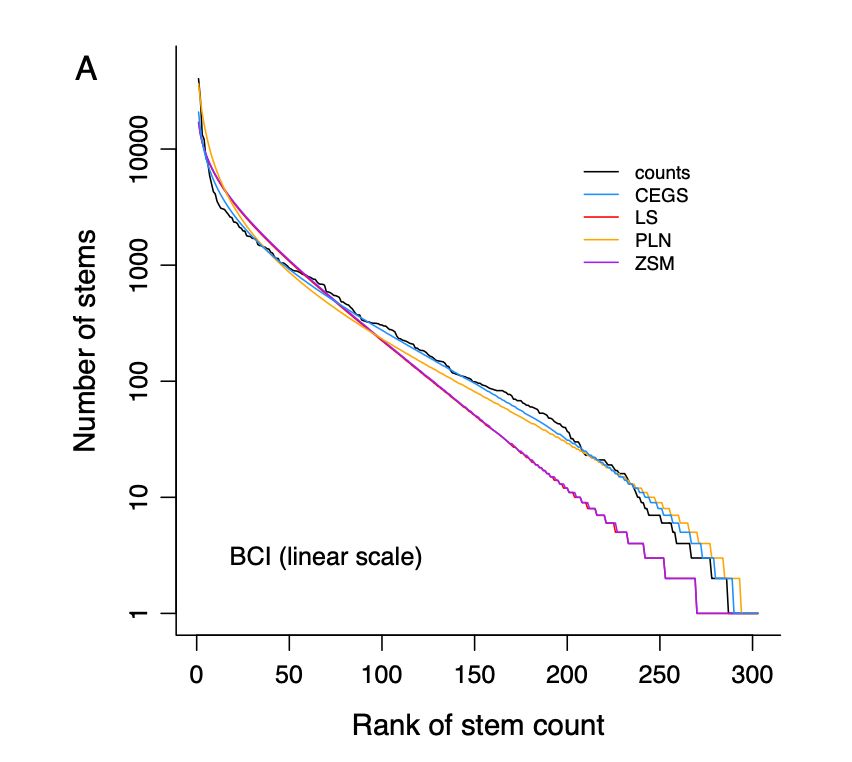
The empirical rank-abundance distribution for the entire Barro Colorado 50 ha plot. Raw counts are in black. Fits are shown for four models: the compound exponential geometric series (CEGS: blue), log series (LS: red), Poisson log normal (PLN: orange), and zero-sum multinomial (ZSM: purple). x-axes are linear.
"What's really happening on the Barro Colorado Island 50 ha forest plot?"
doi.org/10.32942/X26...
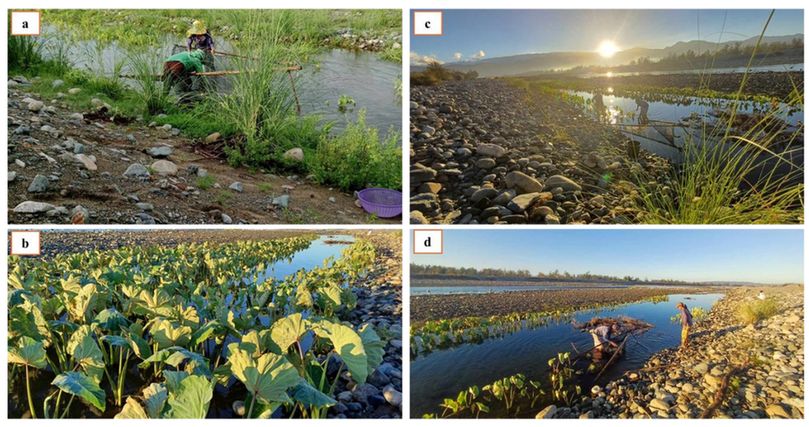
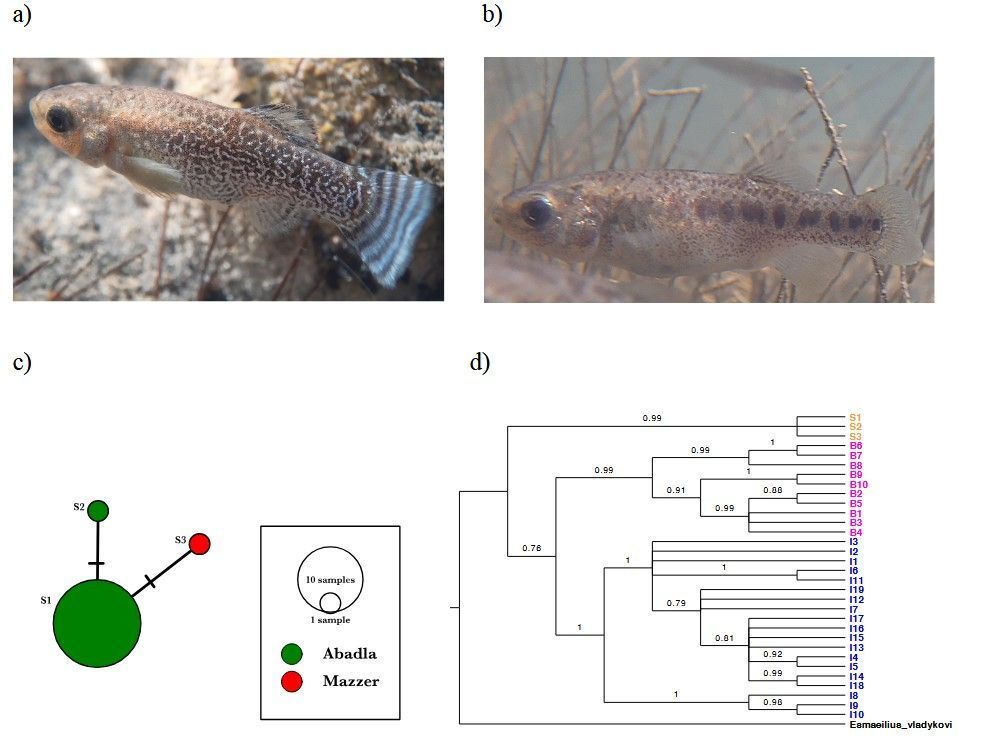
Sampling sites where O. luzonensis was collected: Site 1 (a,b) and Site 2 (c,d).
"Rediscovery and Habitat Assessment of the Endemic Philippine Medaka (Oryzias luzonensis) in Northern Luzon"
doi.org/10.32942/X2B...
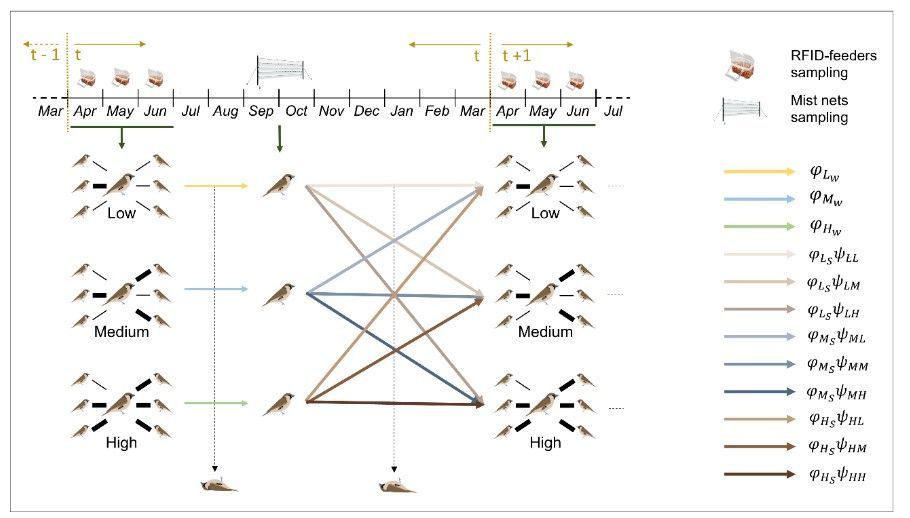
"The number of strong social bonds is linked to survival in a cooperative bird" doi.org/10.32942/X2H...
30.07.2025 03:45 — 👍 1 🔁 0 💬 0 📌 0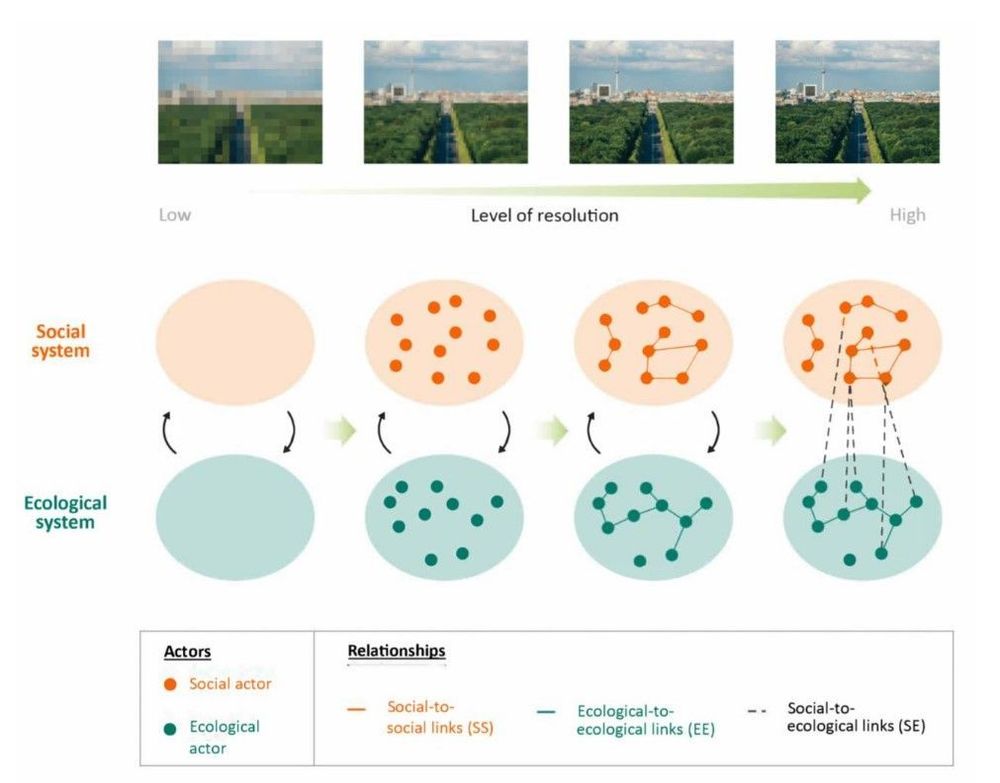
"Social-ecological networks in urban ecology research" doi.org/10.32942/X2N...
29.07.2025 21:44 — 👍 1 🔁 0 💬 0 📌 0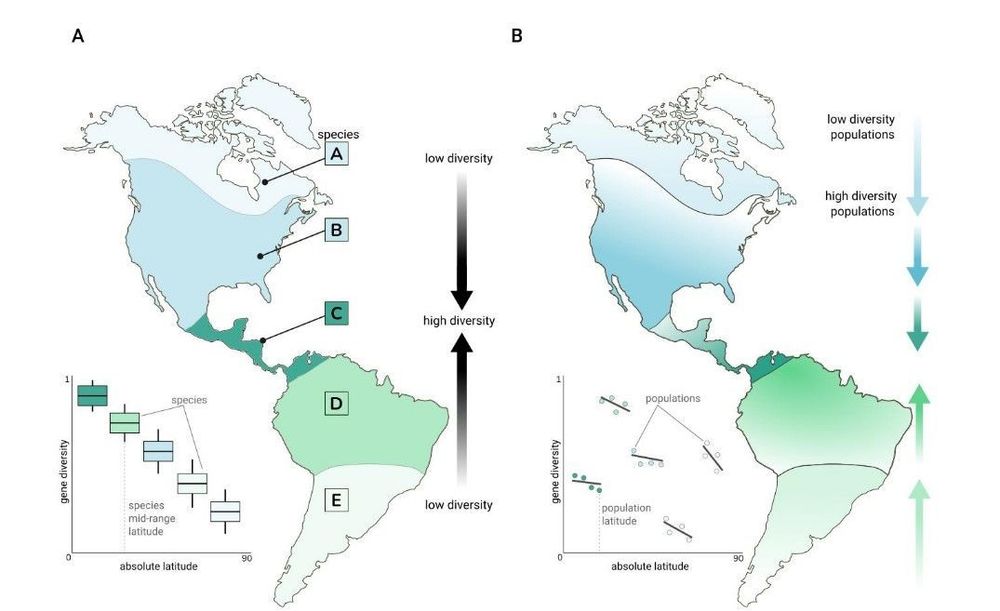
"Latitudinal genetic diversity gradients steepen toward the poles" doi.org/10.32942/X2R...
29.07.2025 18:43 — 👍 0 🔁 0 💬 0 📌 0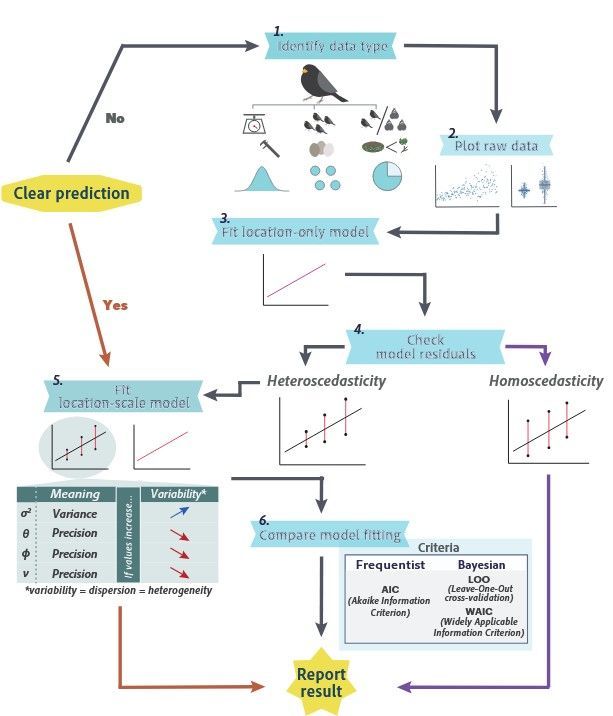
"Location–scale models in ecology: heteroscedasticity in continuous, count and proportion data " doi.org/10.32942/X2W...
29.07.2025 09:42 — 👍 0 🔁 0 💬 0 📌 0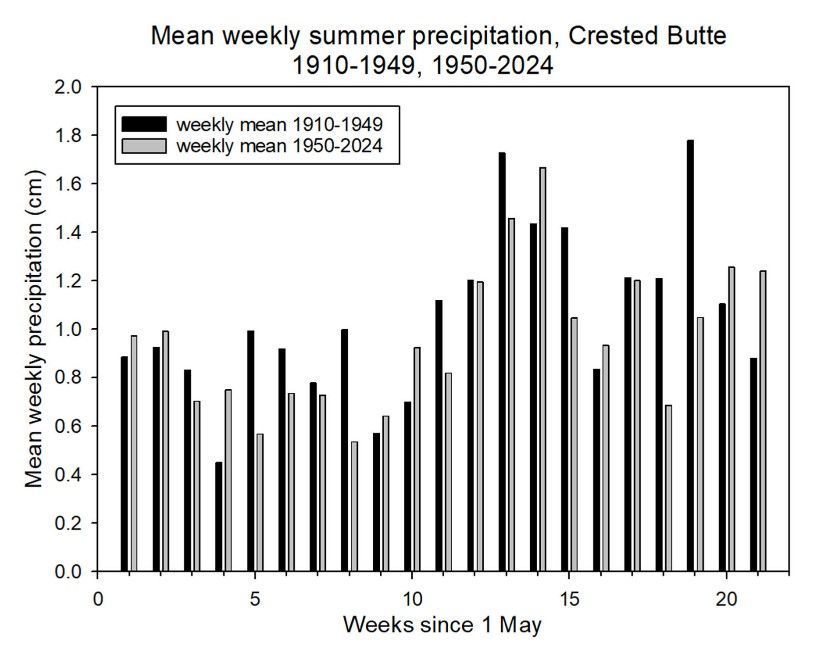
"Long-term change in precipitation and its variability and consequences in a montane environment" doi.org/10.32942/X25...
29.07.2025 06:39 — 👍 0 🔁 0 💬 0 📌 0
"Six decades of losses and gains in alpha diversity of European plant communities " doi.org/10.32942/X21...
28.07.2025 21:40 — 👍 0 🔁 0 💬 0 📌 0