Springer Nature retracting papers based on bonkers dataset
www.thetransmitter.org/retraction/e... Good. #autism

@nistara.bsky.social
Data Science | Epidemiology | Wildlife Health & Conservation | Veterinary Science University California, Davis nistara.net
Springer Nature retracting papers based on bonkers dataset
www.thetransmitter.org/retraction/e... Good. #autism

From @nytimes.com: Sharks and Rays Gain Sweeping Protections From Wildlife Trade
These represent the first time there’s been recognition that some sharks and rays are wildlife, just like elephants or rhinos, WCS’s @lukedavid301.bsky.social tells the paper.
🌎 www.nytimes.com/2025/12/02/s...

Japanese researchers have described a new species of sea anemone that appears to share a mutually beneficial relationship with hermit crabs.
The pale pink sea anemones, now named Paracalliactis tsukisome, were found attached to the shells of hermit crabs.
![[Scene is a kitchen - a middle aged woman called JANET is boiling peas at the stove. A younger more colourfully dressed woman named LIZ approached her.]
JANET:
Ugh...
LIZ:
What's up?
JANET:
I am so bored of cooking peas!
LIZ:
Have you tried...
AI peas?
JANET:
AI peas?
LIZ:
They're peas with AI!
[Liz holds up to us a packet of peas labelled: Pea-i AI - Peas with AI].
LIZ:
Al-powered peas harness the potential of your peas
JANET:
What
LIZ [Now a voiceover as we cut to a whizzy technology diagram of peas all connected by meaningless dotted lines]
Why not take your peas to the next level with Al Peas' new Al tools to power your peas?
[Show a techno diagram of a pea with a label reading 'AI' pointing to a random zone in it]
LIZ:
Each pea has Al in a way we haven't quite worked out yet but it's fine
[Show Janet and Liz now in a Matrix-style world of peas]
LIZ:
With Al peas you can supercharge productivity and make AI work for your peas!
JANET:
What
LIZ:
Shut up
LIZ:
Our game-changing Pea-Al gives you the freedom to unlock the potential of the power of the future of your peas workflow
From opening the bag of peas
to boiling the peas
to eating the peas
To spending millions on adding Al to the peas and then having to work out what that even means.
JANET:
Is it really necessary to-
LIZ [Grabbing Janet by the collar]:
THE PEAS HAVE GOT AI, JANET
[Cut to an advert ending screen, with the bag of peas and the slogan:
AI PEAS: Just 'Peas' for god's sake buy the AI peas.
[Ends]](https://cdn.bsky.app/img/feed_thumbnail/plain/did:plc:4m3we4apbjayclzcnhwe3pfp/bafkreiayqa37f7kik7l7s7fbtfp2sir5ckb662ry2lylinyjrfa2rkvvka@jpeg)
[Scene is a kitchen - a middle aged woman called JANET is boiling peas at the stove. A younger more colourfully dressed woman named LIZ approached her.] JANET: Ugh... LIZ: What's up? JANET: I am so bored of cooking peas! LIZ: Have you tried... AI peas? JANET: AI peas? LIZ: They're peas with AI! [Liz holds up to us a packet of peas labelled: Pea-i AI - Peas with AI]. LIZ: Al-powered peas harness the potential of your peas JANET: What LIZ [Now a voiceover as we cut to a whizzy technology diagram of peas all connected by meaningless dotted lines] Why not take your peas to the next level with Al Peas' new Al tools to power your peas? [Show a techno diagram of a pea with a label reading 'AI' pointing to a random zone in it] LIZ: Each pea has Al in a way we haven't quite worked out yet but it's fine [Show Janet and Liz now in a Matrix-style world of peas] LIZ: With Al peas you can supercharge productivity and make AI work for your peas! JANET: What LIZ: Shut up LIZ: Our game-changing Pea-Al gives you the freedom to unlock the potential of the power of the future of your peas workflow From opening the bag of peas to boiling the peas to eating the peas To spending millions on adding Al to the peas and then having to work out what that even means. JANET: Is it really necessary to- LIZ [Grabbing Janet by the collar]: THE PEAS HAVE GOT AI, JANET [Cut to an advert ending screen, with the bag of peas and the slogan: AI PEAS: Just 'Peas' for god's sake buy the AI peas. [Ends]
Every ad now
13.11.2025 17:38 — 👍 5317 🔁 2350 💬 66 📌 95Please take some time to read about the origin of the 1.5C target. It didn't originate from naivety or stupidity. Those who put it forward certainly didn't see it as "pointless" then, and would probably still not.
@climatehome.bsky.social
www.climatechangenews.com/2015/12/10/a...

Painted woolly bats are listed as Near Threatened on the IUCN Red List. Ornamental trade is the top threat they face, and several lines of evidence point to steep declines in at least some populations.
We are doing everything we can to stop the trade.
act.biologicaldiversity.org/_M_d3tlOQ0G4...

POSTDOC JOB AD: I'm hiring a Bayesian ecologist to build a (IMO, extremely fun) model of humpback whale spatiotemporal dynamics in California
2-year position starting fall 2026. in-person in Santa Cruz; collab w with Mevin Hooten's lab at UT Austin.
ask me Qs or apply: recruit.ucsc.edu/JPF02003

A speech about what drives me, how science and open source are bitter victories, unable to make improve the world if society does not embrace them for the better:
gael-varoquaux.info/personnal/a-...
If you've ever wanted to learn how to make beautiful websites with #QuartoPub and #rstats , check out this workshop I'm giving in a couple weeks! It'll be a blast (and we're covering Quarto's brand new _brand dot yaml system!)
03.10.2025 18:36 — 👍 87 🔁 26 💬 2 📌 1Here is a note we have just had published in Oryx Conservation News, in support of the proposal to list African hornbills in CITES Appendix II. Please share this far and wide!
www.cambridge.org/core/journal...

tl;dr Collinearity is a form of lack of information that is appropriately reflected in the output of your statistical model. When collinearity is associated with interpretational difficulties, these difficulties aren’t caused by the collinearity itself. Rather, they reveal that the model was poorly specified (in that it answers a question different to the one of interest), that the analyst overly focuses on significance rather than estimates and the uncertainty about them or that the analyst took a mental shortcut in interpreting the model that could’ve also led them astray in the absence of collinearity. If you do decide to “deal with” collinearity, make sure you can still answer the question of interest.
Was asked about collinearity again, so here's Vahove's 2019 post on why it isn't a problem that needs a solution. Design the model(s) to answer a formal question and free your mind janhove.github.io/posts/2019-0...
01.10.2025 05:29 — 👍 115 🔁 35 💬 3 📌 4
A graphic showing the concept of mapply in R, with multiple input vectors being paired and processed by a function returning a single output vector.
Just published my new R article: 'Mapply: When You Need to Iterate Over Multiple Inputs'! 🚀 If `sapply` doesn't quite cut it for your multi-variable iterations, `mapply` is your friend. Learn to pair inputs beautifully. #RStats #Mapply
https://drmo.site/bhXeDb
Thank you @gaborcsardi.org
30.09.2025 23:51 — 👍 0 🔁 0 💬 0 📌 0Been loving its cli_progress_along() function lately. Super helpful package!
#rstats #cli
I read "Some of your monsters will be like this" and then wondered why...
29.09.2025 20:29 — 👍 0 🔁 0 💬 0 📌 0
a table about lemurs

a table about students and schools

a table about wines
{tinytable} 0.14.0 for #RStats makes it super easy to draw tables in html, tex, docx, typ, md & png.
There are only a few functions to learn, but don't be fooled! Small 📦s can still be powerful.
Check out the new gallery page for fun case studies.
vincentarelbundock.github.io/tinytable/vi...

Whoa—my book is up for pre-order!
𝐌𝐨𝐝𝐞𝐥 𝐭𝐨 𝐌𝐞𝐚𝐧𝐢𝐧𝐠: 𝐇𝐨𝐰 𝐭𝐨 𝐈𝐧𝐭𝐞𝐫𝐩𝐫𝐞𝐭 𝐒𝐭𝐚𝐭 & 𝐌𝐋 𝐌𝐨𝐝𝐞𝐥𝐬 𝐢𝐧 #Rstats 𝐚𝐧𝐝 #PyData
The book presents an ultra-simple and powerful workflow to make sense of ± any model you fit
The web version will stay free forever and my proceeds go to charity.
tinyurl.com/4fk56fc8

We've joined UC Davis Grand Challenges and UC Davis Health to partner with @cepi.net and @bostonu.bsky.social's BEACON project to integrate #AI with expert knowledge for ranking #viruses with the pandemic potential.
cepi.net/new-global-c...

Specimen Inactivation Methods for Proteomics─Comparisons of Irradiation, Chemical, and Heat Treatments on Downstream Serum Analyses #JProteomeRes #MassSpec pubs.acs.org/doi/10.1021/...
19.09.2025 18:06 — 👍 2 🔁 2 💬 0 📌 0Aww thank you, and the pleasure was all mine as I've said before 😊 Look forward to seeing more great work from you!
23.09.2025 05:44 — 👍 1 🔁 0 💬 0 📌 0Congratulations on getting your first chapter out @brookegenovese.bsky.social!! What a special milestone and such great work!
23.09.2025 05:41 — 👍 0 🔁 0 💬 0 📌 0
Screenshot from https://posit.co/conf-pricing-2025/ showing the posit conf virtual ticket pricing. $99 for standard virtual ticket, $49 for Government and Non-profit employees, and Free for students, academics, and needs-based attendees. There are hand-drawn doodles by Libby that highlight each option and one note says "Plus, Virtual Day!"
People keep telling me they can't afford to attend #PositConf2025 next week, so I need to make a public service announcement: attending virtually is very affordable (or free!) & is amazing! Get registered & hangout with me on the Discord server!! #databs #rstats #python
09.09.2025 19:32 — 👍 38 🔁 21 💬 2 📌 0Just made this little diagram and it's so pretty! {ggdiagram} is really neat for these types of graphics #rstats
(code here: gist.github.com/andrewheiss/... )
Huge congratulations, Joanna!!
14.04.2025 07:04 — 👍 1 🔁 0 💬 0 📌 0
A screenshot of the paper

A screenshot of the paper

A screenshot of the paper

A screenshot of the paper
🚀 New preprint! "Spatial Data Science Languages: Commonalities and Needs" 🌍
Exploring challenges & insights from #Rstats #Python & #JuliaLang for spatial data handling—geodetic coords, data cubes, and more!
arxiv.org/html/2503.16...
#SpatialDataScience #rspatial #geopython #juliageo
chatgpt has fully broken-through to every facet of the corporate environment. I'm spending a not-insignificant amount of my time every week now explaining to people that just because chatgpt told you that something was possible doesn't mean that it a) is or b) even exists
21.03.2025 13:44 — 👍 11325 🔁 1563 💬 286 📌 154Please get in touch if you are up for chatting with recent U.S. fed employees about career paths!
14.03.2025 21:52 — 👍 11 🔁 8 💬 0 📌 0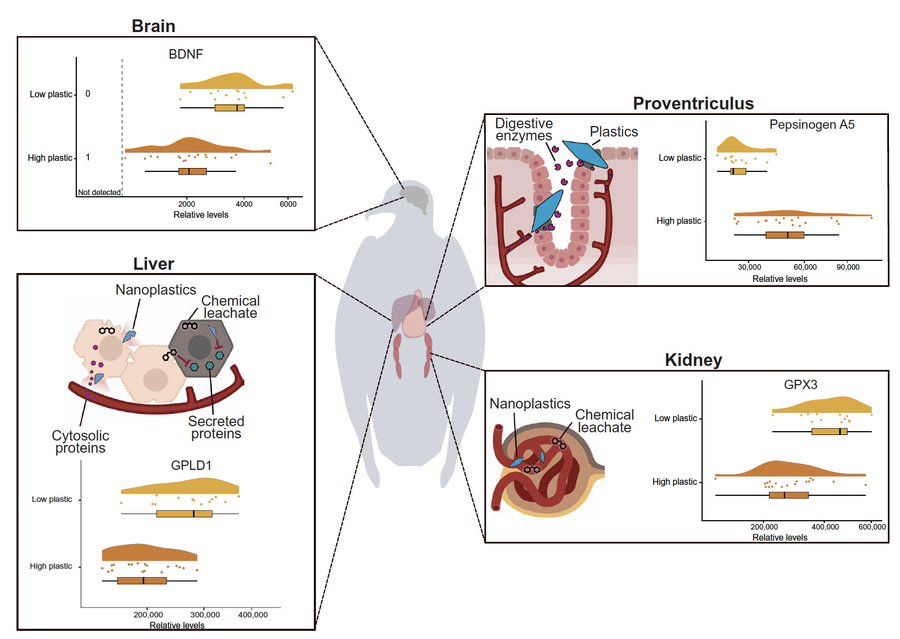
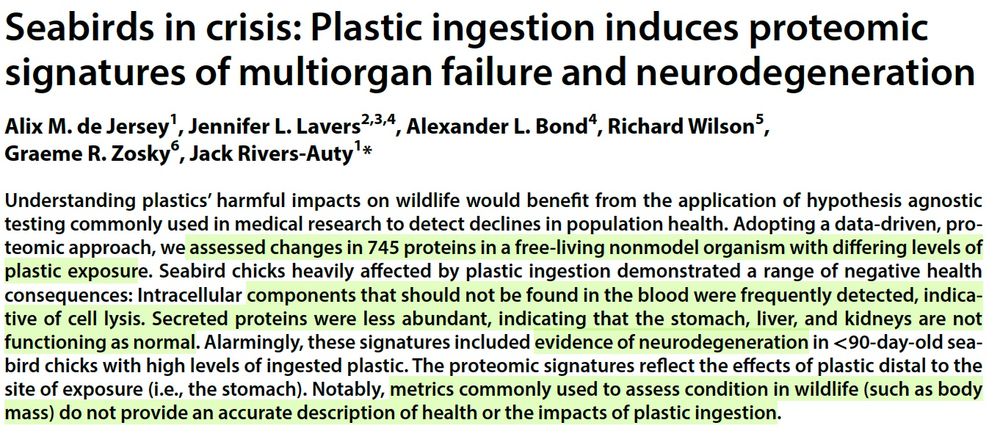
Maybe the crisis in seabirds with multi-organ failure from exposure to plastics will help raise awareness of their serious hazard and lead to action
science.org/doi/10.1126/...
Our paper is out, and it is distressing.
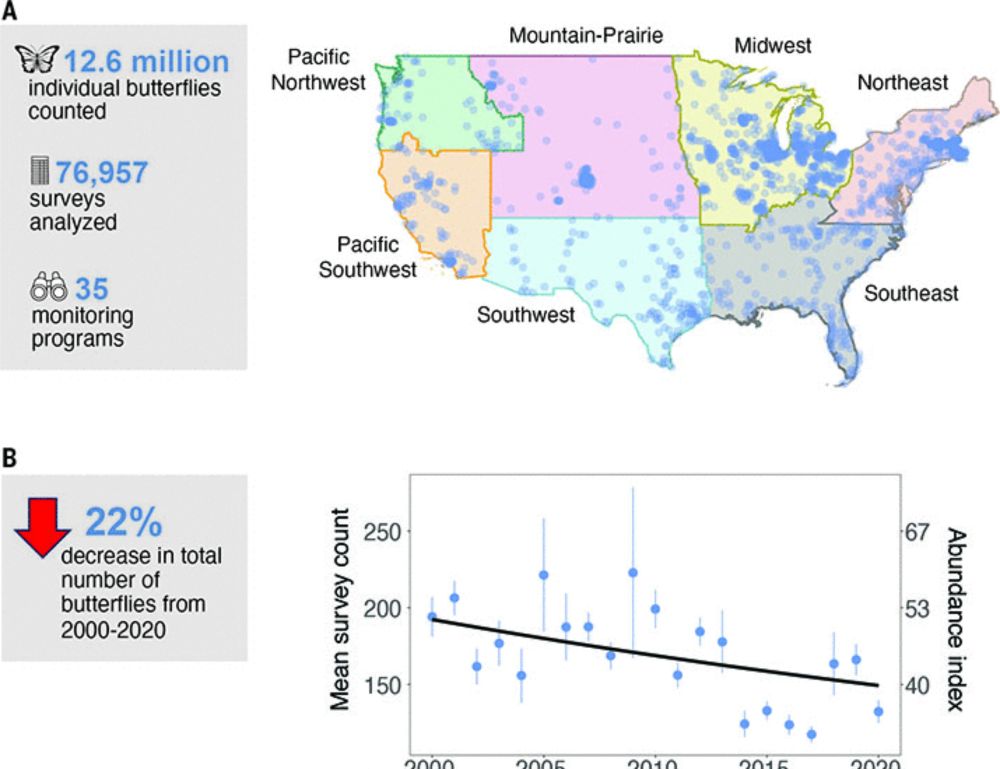
Rapid butterfly declines across the United States during the 21st century | Science www.science.org/doi/10.1126/...
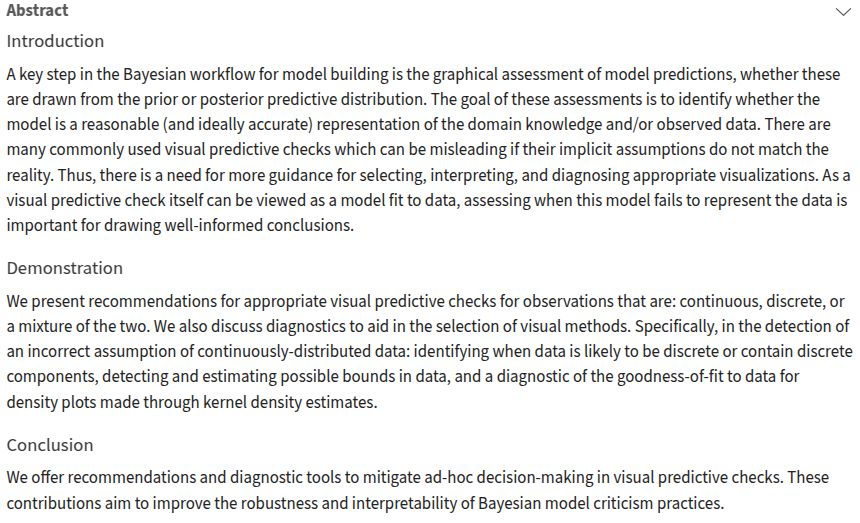
Abstract Introduction A key step in the Bayesian workflow for model building is the graphical assessment of model predictions, whether these are drawn from the prior or posterior predictive distribution. The goal of these assessments is to identify whether the model is a reasonable (and ideally accurate) representation of the domain knowledge and/or observed data. There are many commonly used visual predictive checks which can be misleading if their implicit assumptions do not match the reality. Thus, there is a need for more guidance for selecting, interpreting, and diagnosing appropriate visualizations. As a visual predictive check itself can be viewed as a model fit to data, assessing when this model fails to represent the data is important for drawing well-informed conclusions. Demonstration We present recommendations for appropriate visual predictive checks for observations that are: continuous, discrete, or a mixture of the two. We also discuss diagnostics to aid in the selection of visual methods. Specifically, in the detection of an incorrect assumption of continuously-distributed data: identifying when data is likely to be discrete or contain discrete components, detecting and estimating possible bounds in data, and a diagnostic of the goodness-of-fit to data for density plots made through kernel density estimates. Conclusion We offer recommendations and diagnostic tools to mitigate ad-hoc decision-making in visual predictive checks. These contributions aim to improve the robustness and interpretability of Bayesian model criticism practices.
New paper Säilynoja, Johnson, Martin, and Vehtari, "Recommendations for visual predictive checks in Bayesian workflow" teemusailynoja.github.io/visual-predi... (also arxiv.org/abs/2503.01509)
04.03.2025 13:15 — 👍 64 🔁 20 💬 4 📌 0